8/28 Focus on Selling Above 3412Good evening, everyone!
Gold pulled back near 3398 earlier today but held above the 3386–3378 support before rallying again and breaking through the 3400 level. Price is now above 3410, with the next major resistance zones at 3412–3419–3427 (and previous highs at 3433–3438). These levels are likely to be tested multiple times, but the closer price gets to 3419–3427, the heavier the selling pressure will be.
📌 Key Supports: 3404–3398–3386
📌 Trading Plan: Above 3412, focus on sell setups first; then look for potential buy opportunities after pullbacks confirm support.
Stay calm, trade with the trend, and capture profits wisely.
Xauusdsignal

XAUUSD 15m – EW Short SetupHi fellow traders,
On the 15m XAUUSD chart, I am applying Elliott Wave principles to capture a potential short move. Price action is unfolding within an ending diagonal pattern, and I am anticipating the final leg down as wave (v).
Additional confluence is provided by the red-shaded supply zone, which coincides with the projected entry area and strengthens the probability of a reversal at this level.
I am entering at 3335.37, with a Stop Loss at 3345.30 serving as the invalidation level. My Take Profit is set at 3307.64, targeting the next key support area.
Good luck and trade safe.

XAUUSD 1H – EW Bearish Scenario Hi fellow traders,
On the 1h XAUUSD chart, I am applying Elliott Wave principles to outline a potential expanding flat scenario, forming either as an X-wave or a B-wave. If this count holds, I expect another leg to the downside before the larger structure completes.
The red-shaded supply zone provides a potential rejection area, while the blue-shaded demand zone below marks where price could stabilize. Most importantly, the golden box beneath remains untested, aligning with my expectation that price will revisit this key support zone before a stronger reversal.
For this setup, my entry is positioned around the supply zone, with a Take Profit aimed at the golden box below. The Stop Loss is placed at the invalidation level, meaning the trade idea is no longer valid if price breaks above this structure.
Although the broader sentiment may lean bullish, this bearish scenario remains technically supported by Elliott Wave structure and confluence levels.
Good luck and trade safe.

Gold Trade Set up Aug 28 2025OANDA:XAUUSD
www.tradingview.com
price is making HH/HL on the daily 4h and 1h time frames so overall im bullish. There is a 1h FVG formed and HL acting as SSl that is being tested, so if price closes above HL i will look for internal structure on the 5m to target BSL around 3409 but if price closes under HL it can come to test lower SSL around 3385 before continuing up

Gold Surges Amid Fed Drama & Key Data: Buy or Sell Now?Fundamental Analysis: What’s Shaking Up Gold Prices?
USD Index Up 0.2%: A stronger dollar makes gold pricier for foreign buyers, creating short-term pressure. But don’t worry—gold remains the ultimate safe-haven in times of uncertainty! 📉
US Treasury Yields Rise 0.4%: Higher yields make non-yielding gold less attractive. Still, with persistent inflation, gold’s allure as a hedge stays strong! ⚖️
Fed Drama: Trump vs. Lisa Cook: Earlier this week, Trump announced plans to oust Fed Governor Lisa Cook from the Board of Governors. Cook’s legal team fired back, filing a lawsuit to block her removal, setting the stage for a prolonged legal battle. The result? Gold surged to a 2-week high on August 26 following this news. Political uncertainty = Rocket fuel for gold! 🔥🇺🇸
Key Economic Data on the Horizon: Investors are on edge awaiting GDP data today (28/08) and the PCE index—Fed’s favorite inflation gauge—on 29/08. Reuters’ poll forecasts PCE inflation at 2.6% for July 2025, matching June’s level. If the data comes in softer than expected, the Fed might cut rates, sending gold soaring! 📊 What’s your take on the Fed’s next rate move?
Technical Analysis: Bullish Trend Intact, But Watch for a Pullback!
Gold continues its bullish run, breaking through the 3393 level with a clear BOS (Break of Structure), signaling the uptrend is alive and well! However, price is hesitating around the 340x resistance zone, with risks of a sharp pullback at any moment. Strategy: BUY short-term to ride the momentum, but be ready to SELL on signs of a structural reversal. Don’t miss out! 📉📈
Key Resistance: 3399 - 3405
Key Support: 3393 - 3385 - 3381 - 3374 - 3363 - 3352
Sell Zone: 3403 - 3405
SL: 3410
TP: 3399 - 3393 - 3385 - 3381 - 3374
Buy Zone: 3375 - 3373
SL: 3369
TP: 3381 - 3385 - 3393 - 3400
#Gold #XAUUSD #TradingView #Fed #Trump #PCE #GDP #GoldTrading #Finance #Investing #TechnicalAnalysis #MarketUpdate #Crypto #Forex

GOLD BUY SETUP Gold Buy Zones :
CISD (3396)
FVG (3393 , 3390)
BRB ( 3393 , 3388)
Targets : 50 Pips , 80 Pips , 150 Pips , 200 Pips
Follow Us For More Trades & Comment Your Opinion

XAUUSD Q4 is Coming; September Reset for Gold Traders
Summer is leaving its mark already. For some, it’s the heat of missed trades. For others, it’s the frustration of chop: false breaks, liquidity traps, the kind of price action that tests your patience more than your strategy. Another batch of traders comes back refreshed from their holidays...
But every year, like clockwork, September arrives.
And this month is different.
It’s the reset button. Liquidity returns as big players come back from summer. Volumes rise. Market makers shift gears. What looked like a bit of chaotic moves in July and August begin to make sense in September, because the context changes.
1️⃣ Why September Matters
Think of it as the gateway to Q4.
It’s not just “another month”, but the bridge between the summer ranges and the final push of the year.
• Institutions reposition.
• Central banks set the tone for year-end.
• Physical demand from India and China accelerates into festivals and holidays.
This is when the market stops drifting and starts building direction.
2️⃣ Q4: The Final Act
October to December is rarely quiet. It’s when portfolios get rebalanced, reports closed, and big narratives find their conclusion.
For Gold, Q4 often means:
• Volatility with a purpose. Not just random spikes, but moves that make a mark.
• Trends that can define the whole year. One or two big swings can make all the difference.
• Liquidity sweeps early, momentum later. September often tests both sides before revealing the path.
3️⃣ The Psychology of the Season
This is where traders win or lose more in their minds than on their charts.
• Patience over FOMO. September rewards those who wait for clarity.
• Confidence over ego. Don’t chase every move to “make up” for the passed summer.
• Preparation over reaction. Mark your levels, define your risk, and let the market come to you and your reaction zones.
It’s not about catching the first candle of the move. It’s about being ready for the real trend when it reveals itself.
4️⃣ How to Prepare
• Treat September as a filtering month. Don’t overtrade; study how XAUUSD reacts around key liquidity pools.
• When October–November come, be ready to scale into clean moves.
• In December, remember that thinner liquidity can still hide powerful setups — but choose them carefully.
✨ A Note for Serious Traders
The edge isn’t in chasing signals, it’s in building structure and a sure plan with a few great trades/week. Every trader stepping into Q4 should have:
• A clear bias based on higher timeframes, then move to the lower ones.
• Defined key levels & reaction zones marked in advance. Do your homework on the charts.
• Discipline to avoid impulsive trades and wait for price to come to the plan.
That’s how you survive September and thrive in Q4. Outlooks and daily bias updates — when done properly — bring in good/great results and fewer SL.
Let's get ready for XAUUSD fall trading!
If this article helped you today and brought you more clarity:
Drop a 🚀 and follow us✅ for more trading ideas and trading psychology.

Gold (XAU/USD) – 30m – AMD (Accumulation / Manipulation / DistriGold (XAU/USD) – 30m – AMD (Accumulation / Manipulation / Distribution)
🔹 Phase 1: Accumulation
The market showed a period of range-bound price action in the lower zone, where liquidity was building up.
This phase indicates that smart money was collecting positions, creating the base for the next move.
The price respected the liquidity trendline and showed a gradual shift of demand.
---
🔹 Phase 2: Manipulation
A clear stop-hunt / liquidity grab occurred above the accumulation range.
This move is characterized by a false breakout above the consolidation zone, designed to trap early buyers.
The spike in volume and quick rejection signals the transition into distribution.
---
🔹 Phase 3: Distribution
Price moved into the 3,406 – 3,410 area, marking the distribution zone.
This is where supply overtakes demand as institutional players offload positions.
Strong rejection candles confirm sellers are active here.
Risk of reversal is high, and any long trades are considered risky at this point.
---
🔹 Outlook & Trading Plan
If price holds below 3,406, we can expect a downward continuation toward 3,377 and potentially the 3,368 liquidity pool.
Any short entry should ideally align with rejection signals in the distribution phase.
If the market breaks and sustains above 3,410, it invalidates the distribution setup and indicates continuation of bullish momentum.
---
✅ Bias: Bearish under 3,406
🎯 Targets: 3,377 – 3,368
❌ Invalidation: Above 3,410
Analysis: mohsen mozafari nejad
Adminstration of persiaux king academy

Gold (XAU/USD) Targets $3,397 – $3,406 Amid Bullish MomentumAnalysis:
The 4H chart of Gold (XAU/USD) shows strong bullish momentum after a corrective phase. Price has broken above consolidation and is currently trading around $3,382, with upside targets at $3,397 and $3,406 (highlighted resistance zone).
The supply zone on the higher timeframe remains intact below $3,280, acting as a long-term support.
Immediate support levels lie at $3,371, $3,356, and $3,348. A break below these could shift momentum bearish.
Current bullish structure suggests that as long as price holds above $3,371, buyers may drive the price higher toward the resistance levels.
A rejection from $3,406 may lead to a pullback toward the mid-support zone before another attempt higher.

Gold Shows Potential Breakout at $3,390Gold (XAU/USD) has been exhibiting mixed price action over the past few weeks. On the 4-hour chart, we notice a critical resistance trendline forming a descending pattern that has contained price movement for some time. The current price stands at $3,390.26, indicating a potential breakout scenario.
Key Levels to Watch
Resistance: $3,400 – A level that has repeatedly capped upward movements.
Support: $3,325 – The lower boundary of recent price consolidation.
Immediate Buy Level: $3,390.54
Immediate Sell Level: $3,390.32
The price is currently testing the descending trendline, suggesting a possible upward momentum if bulls sustain above this level. Traders should be cautious of a false breakout, as consolidation is still evident around $3,375 – $3,400.
RSI Analysis
The Relative Strength Index (RSI) 14-period shows the momentum hovering near the 60-65 zone, indicating moderately strong buying pressure but not yet overbought. Previous RSI peaks near 70 triggered minor pullbacks, highlighting the importance of this indicator for spotting reversals.
ZigZag Indicator Insight
The ZigZag 5 10 indicator highlights the swing highs and lows, helping traders visualize the trend reversal points. The recent formation suggests a potential shift toward an upward trend if the current breakout holds above the resistance.
Trading Strategy
1. Bullish Scenario:
Entry above $3,400 with a target near $3,450.
Stop loss around $3,375 to manage risk.
2. Bearish Scenario:
If the breakout fails and price dips below $3,375, short positions could target $3,325.
Confirm with RSI moving below 50 for stronger conviction.
Conclusion
XAU/USD is showing signs of a potential bullish breakout after a prolonged period of consolidation. Traders should monitor the $3,400 resistance level closely and watch RSI behavior for momentum confirmation. With careful risk management, this could be a profitable swing trade opportunity.

Gold (XAU/USD) 28 August 2025Gold continues to consolidate within a high-volatility environment, with price testing key liquidity pools and approaching unmitigated supply/demand levels. Today’s analysis blends Daily macro bias, 4H swing structure, and 1H execution refinement to identify the most reliable zones for institutional-grade entries.
🔵 Demand Zones (Buy Setups)
Primary Buy Zone: $3360 – $3370
This is today’s highest-probability demand area.
Daily: Bullish structure intact with higher-highs and higher-lows.
4H: Fresh bullish Order Block formed after a strong BOS (Break of Structure).
1H: Liquidity sweep below recent lows at 3372, providing a refined entry trigger.
Indicators: RSI recovery from oversold divergence; MACD showing momentum reversal.
Volume: Absorption at 3365 confirms buyer presence.
Execution Plan:
SL: 3350 (structure invalidation)
TP1: 3405
TP2: 3425
Secondary Buy Zone: $3325 – $3335
Daily: Nested demand block aligning with prior bullish BOS.
4H: Deep discount zone of previous swing.
1H: ICT displacement candle originated at 3330, unmitigated.
Execution Plan:
SL: 3310
TP1: 3365
TP2: 3400
🔴 Supply Zones (Sell Setups)
Primary Sell Zone: $3420 – $3430
This is the nearest high-probability supply area.
Daily: Strong resistance shelf; unmitigated supply.
4H: Bearish OB after displacement down from 3428.
1H: Liquidity pool resting above 3415 equal highs.
Indicators: Bearish RSI divergence; MACD momentum fading.
Execution Plan:
SL: 3440
TP1: 3390
TP2: 3365
Secondary Sell Zone: $3455 – $3465
Daily: Weekly supply nested in premium pricing.
4H: Swing-high liquidity at 3460 remains untested.
1H: Inefficient wick zone above equilibrium.
Indicators: RSI extreme overbought; ATR volatility ceiling.
Execution Plan:
SL: 3475
TP1: 3430
TP2: 3400
⭐ Executive Summary – Golden Zone
The Primary Buy Zone at $3360 – $3370 stands out as today’s Golden Zone:
Backed by 6 institutional confluences across Daily, 4H, and 1H.
Well-defined risk with SL at 3350.
Reward asymmetry toward TP1 at 3405 and TP2 at 3425.
This zone offers the cleanest risk-to-reward profile, aligning macro structure with intraday liquidity positioning.
⚖️ Final Note
As always, zones are execution frameworks, not blind signals. Wait for confirmation on 1H/15M displacement and liquidity sweeps before entering. Managing risk with precision is crucial given Gold’s current volatility and ATR expansion.

Gold is in the Bearish Direction after Retesting ResistanceHello Traders
In This Chart GOLD HOURLY Forex Forecast By FOREX PLANET
today Gold analysis 👆
🟢This Chart includes_ (GOLD market update)
🟢What is The Next Opportunity on GOLD Market
🟢how to Enter to the Valid Entry With Assurance Profit
This CHART is For Trader's that Want to Improve Their Technical Analysis Skills and Their Trading By Understanding How To Analyze The Market Using Multiple Timeframes and Understanding The Bigger Picture on the Charts

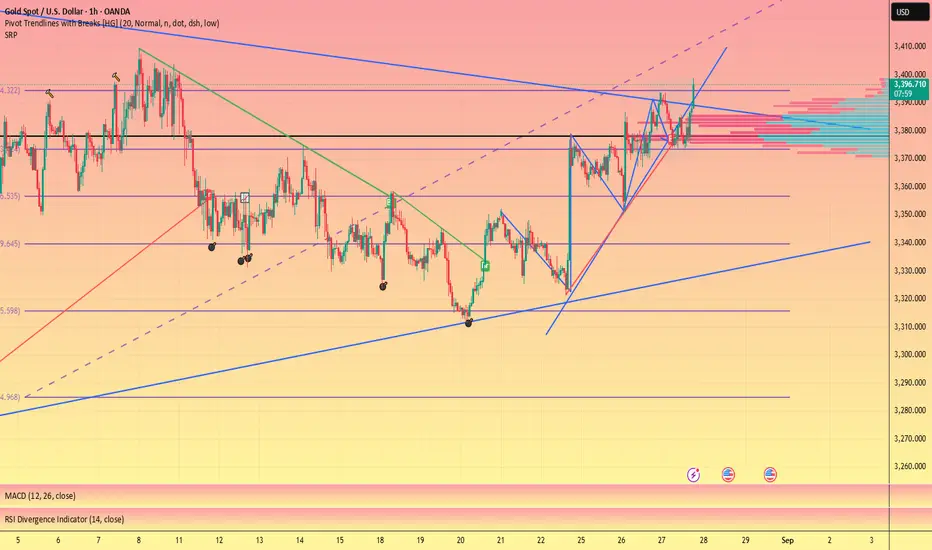
If it doesn't break 3400, be wary of a possible pullback#XAUUSD
Gold continued its upward trend tonight, consolidating again near 3390. Don't chase the rally at high levels!📊
Gold is near the upper edge of a convergent triangle.📐 As I told you before, whether it can effectively break through the edge of the triangle will determine the subsequent trend of gold in the short term. ⚖️
If it fails to effectively break through the upper range of 3395-3410 in the short term, then gold may still have the possibility of a pullback. 📉Otherwise, upward momentum will be fully opened. Exercise caution in evening trading.💻
There will be initial unemployment claims data tomorrow, so please pay attention to it.
Trump manipulates the market, bulls still have a chance#XAUUSD
Yesterday, I gave everyone a targeted trading plan. 📊First, it took into account the trading strategy of most people who wait for gold to pull back and go long. 📈Secondly, it supplemented the trading idea for large capital accounts to consider shorting with a light position near 3370 and waiting for a pullback.📉
This morning, gold fell to the ideal trading range of 3356-3345 as expected,🎯 and then rebounded, providing bulls with good profit margins. 🐂
I believe that as long as people who seriously refer to the trading strategy, 🤔whether they are partners who follow up on short orders and seize the profits of callbacks, or friends who arrange long orders at support levels to capture opportunities for pull-up, they will all be able to reap good returns. 🤑
This also once again verifies that our strategic logic around the "key range game" is in line with the current market rhythm.⚖️
Influenced by the morning news, gold rose in the short term and then entered a high-level fluctuation. 📊
From a trend perspective, bulls remain dominant, with gold prices remaining above the mid-range. A pullback presents an opportunity.🌈 Next, if gold stabilizes at 3375-3380, the bullish momentum will be further released, and it is expected to touch 3400-3410 and the upper edge pressure of the daily triangle.🚀
Whether it breaks upward or not will determine how far the bullish counterattack can go. If an effective breakthrough can be achieved, the upward space will be fully opened and is expected to set new highs.📊
In terms of operation, the main strategy is to go long during the day. You can consider going long based on the support of 3370-3355, with the target at 3385-3400.🏅

Gold Holds Firm as USD Weakens📊 Market Moves
Gold remains stable around $3,384–3,385/oz as the US dollar weakens, driven by concerns over Fed independence — especially President Trump’s threats to fire Fed Governor Lisa Cook — boosting safe-haven demand.
📉 Technical Analysis
• Key Resistance: $3,400, followed by $3,435
• Nearest Support: $3,350, then $3,324 (100-day SMA)
• EMA/SMA: A bullish cross is forming as the 21-day SMA moves above the 50-day SMA → short-term uptrend intact
• RSI & Momentum: RSI (14) at ~54, staying above 50 → buyers still dominant
📌 Outlook
Gold is likely to edge higher in the short term if the USD remains weak and dovish Fed signals strengthen.
💡 Suggested Trading Strategy
🔻 SELL XAU/USD : $3,396–3,399
🎯 TP: 40/80/200 pips
🛑 SL: $3,403
🔺 BUY XAU/USD : $3,350–3,353
🎯 TP: 40/80/200 pips
🛑 SL: $3,347

Plan XAU day: August 27, 2025📉Related Information:!!!
✨ Latest Developments:
Trump unexpectedly announced the dismissal of Federal Reserve Governor Lisa Cook, sparking concerns over the Fed’s independence.
This move has sharply increased safe-haven demand, pushing gold to a two-week high around $3,393/oz.
The market is now pricing in an 87% probability of a Fed rate cut in September, with the USD weakening and capital flowing out of risk assets.
📉personal opinion:!!!
📊 H1 Technical Analysis:
Price has just broken out to the 3375–3373 to gain liquidity and continue the downtrend
📉Important price zone to consider : !!!
Resistance zone point: 3375 zone
Sustainable trading to beat the market

Gold Trade Set Up Aug 27 2025OANDA:XAUUSD
www.tradingview.com
In asai session gold swept PDH and in london session gold made LH/LL so for sells i will want to test LH and close below then make internal structure to go lower towards SSL. But if price closes above LH i will look for a continuation higher to BSL

Watch Resistance at 3391–3398, Avoid Chasing HighsGold rebounded strongly from 3352 support today, breaking through the 3358–3366 resistance and rallying to 3386 before consolidating. During this phase, multiple tests of the 3368 support held firm, and price has now returned above 3380, keeping the overall bias bullish.
⚠️ However, caution is warranted: resistance is not only near 3386 but also at the 3391–3398 zone, where fresh selling pressure is likely. The upside looks limited, making blind chasing risky.
📌 Suggestion: Focus on sell opportunities around resistance. For larger accounts with proper position sizing, chasing a short-term rally may be manageable; but for smaller accounts, chasing highs carries significant risk and is not recommended.
These are my personal views for reference only. Please evaluate carefully based on your own situation. If you’d like more tailored guidance, feel free to reach out.

GOLD BUY SETUP Hello Everyone!
Lets Take A Buy Trade Of XAUUSD
Buy Gold @3374
Stoploss / 3369
TP / @3378, 3385
Comment Your Opinion & Follow Us For More Trades

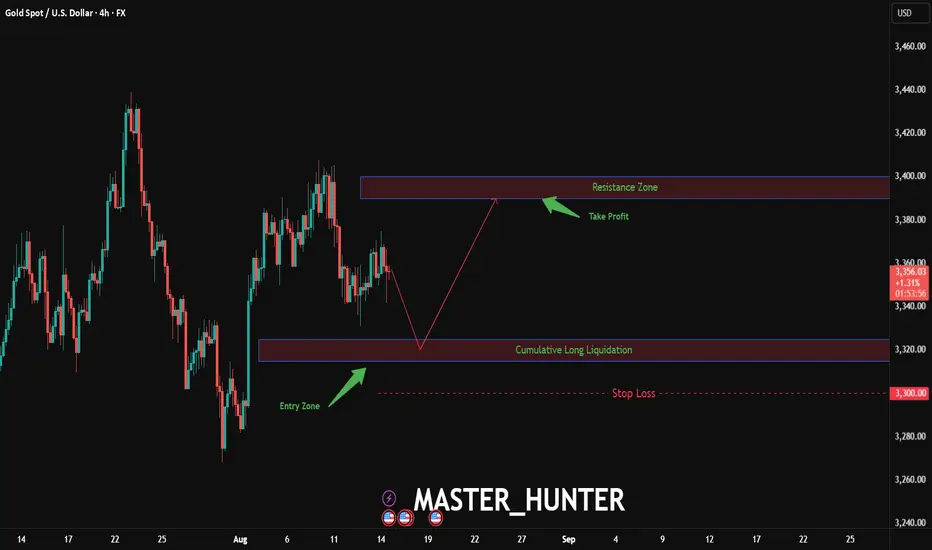
Gold Surge to 3400 in Sight? FX:XAUUSD is gearing up for a potential bullish run on the 4-hour chart, with an entry zone between 3315-3325 near a key support level and rising trendline.
Targets at 3390-3400 align with the next resistance zone , offering a strong upside move. Set a stop loss below 3300 on a daily close to manage risk effectively.
Following the previous analysis , it’s wise to risk-free your gold position and wait for this new entry point.
A break above 3330 with solid volume could trigger this surge, fueled by USD weakness and gold demand. Keep an eye on upcoming economic data as a catalyst.
Ready to ride this gold wave? Share your thoughts below!
#XAUUSD #GoldTrading #ForexSignals #TechnicalAnalysis #TradingView #DayTrading #MarketAnalysis
Uptrend is back, ready to BUY✏️As analyzed, the increase in gold price met some selling pressure around 3378. The formation of the gold trend On Friday, a new structure of Gold was re-established. The market tends to be easy to trade at the moment. The uptrend is followed by the main candle of the h4 frame. Waiting for some buyers to take profit to get good prices at the support zones to buy to the resistance of 3400.
📉 Key Levels
BUY Trigger 3359 Strong support zone
BUY trigger Rejection of the price zone 3345
Leave your comments on the idea. I am happy to read your views.

Gold (XAU/USD) 27 August 2025Gold continues to trade in a well-defined structure, with buyers defending higher-lows while sellers attempt to cap upside momentum near the $3400 handle. Today’s analysis blends the Daily → 4H → 1H confluences to outline execution-ready trading zones with clear invalidation and profit objectives.
🔵 Demand Zones – Where Buyers Are Positioned
📍 Primary Buy Zone: $3368 – $3373
This zone carries the strongest institutional weight for the day:
Daily higher-low structure remains intact above $3365.
4H bullish order block + fresh BOS confirmation.
ICT’s Optimal Trade Entry discount (0.618–0.705 retracement).
RSI bullish divergence on 1H; MACD slope turning positive.
Strong absorption wick confirmed at $3370 on the last sweep.
📌 Trade Plan:
Entry: $3368 – $3373
SL: Below $3360
Targets: $3395 → $3410
📍 Secondary Buy Zone: $3350 – $3355
A deeper liquidity-driven fallback demand level:
Untested 4H demand block from breakout leg.
Daily demand base aligning with sell-side liquidity resting below $3355.
MACD crossover and ATR volatility expansion on 1H support demand.
📌 Trade Plan:
Entry: $3350 – $3355
SL: Below $3345
Targets: $3380 → $3400
🔴 Supply Zones – Where Sellers Are Positioned
📍 Primary Sell Zone: $3402 – $3408
The first line of resistance for intraday traders:
4H lower-high structure aligning with Daily resistance.
Fresh bearish order block and FVG imbalance inside zone.
RSI divergence (bearish) on both 4H & 1H timeframes.
Thin volume node above $3400 → prone to rejection.
📌 Trade Plan:
Entry: $3402 – $3408
SL: Above $3415
Targets: $3388 → $3370
📍 Secondary Sell Zone: $3420 – $3426
A liquidity sweep zone with higher timeframe supply:
Daily supply block remains unmitigated.
Buy-side liquidity pool resting above $3420.
ATR extension = capped intraday volatility.
VWAP overextension favors mean reversion.
📌 Trade Plan:
Entry: $3420 – $3426
SL: Above $3435
Targets: $3400 → $3385
🟡 Executive Summary – The Golden Zone
Today’s Golden Zone is the Primary Buy Zone ($3368 – $3373).
It aligns across Daily (higher-low support), 4H (fresh bullish OB), and 1H (execution refinement). Backed by 6+ confluences, this zone offers the highest-probability continuation trade, targeting the $3410 region.
✅ Bias: Maintain bullish stance above $3365. Look for dip buys around $3368–$3373, while fading exhaustion only at defined sell zones above $3402.

Gold (XAUUSD) Set to Hit Resistance | Sell on Rise SetupGold (XAUUSD) is approaching a critical resistance zone between 3492 and 3494, where sellers have previously stepped in to push prices lower. We anticipate a similar reaction this time, presenting an opportunity to enter a short position on any upward move into this prime supply area.
🔻 Short Trade Setup – Fade the Rally
Entry: Sell Gold (XAUUSD) at 3392
Add-On: Sell more Gold (XAUUSD) if price rises to 3399
Targets: Refer to chart for detailed target zones
Invalidation: If daily closes above 3406, consider the setup invalid
📉 Risk-Reward Profile
This setup offers an attractive risk-reward ratio, particularly for short-term traders looking to capitalize on a potential rejection at resistance. Maintain tight stops and disciplined position sizing to manage risk effectively.
Gold (XAUUSD) has enjoyed a strong rally, but the odds now appear to favor a pullback. Watch price action and momentum closely within the resistance zone for confirmation.
👍 If you find this idea useful, please like and share your thoughts in the comments. Let’s build a community of sharp traders sharing insights!
🔔 Follow for more high-probability trade setups and market analysis.
Happy Trading,
– The InvestPro Team
