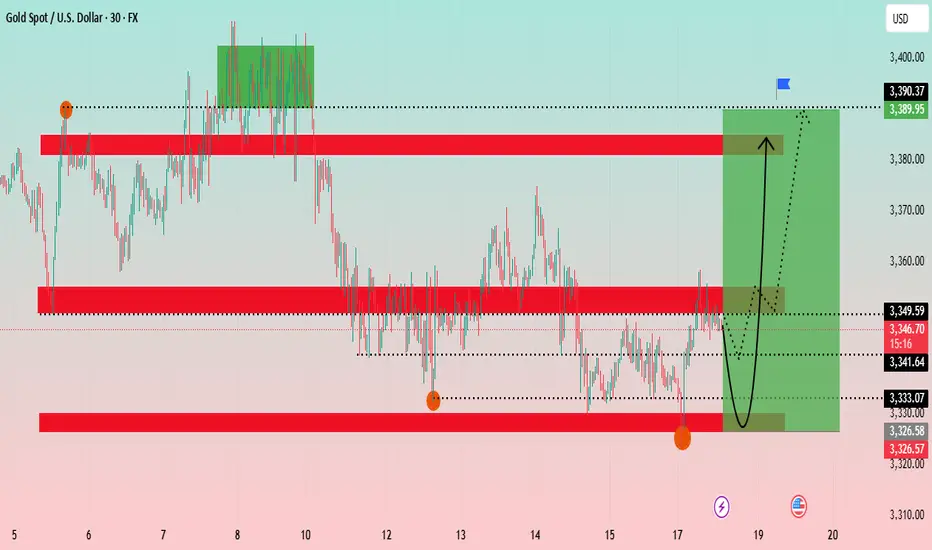
Gold and Bitcoin Technical Analysis: Navigating Key Support ?The Gold chart shows a 30-minute timeframe analysis, highlighting recent price consolidation and potential future trends. The analysis suggests a potential V-shape recovery for gold.
Key Levels: The price is currently at a critical juncture, having tested a support zone around 3,326 - 3,333 USD. This zone has proven to be a strong base. Above it, a significant resistance zone is identified between 3,349 - 3,353 USD. Further up, another major resistance is at approximately 3,389 USD.
Price Action: The price has recently experienced a sharp decline and is now in a consolidation phase. The chart projects a potential bounce from the current levels, indicated by the black curved arrow, with the target being the upper resistance zone around 3,389 USD. The green shaded box illustrates the potential upward movement from the current position.
Conclusion: Gold appears to be at a key support level and could be poised for a rally if it successfully breaks above the immediate resistance zone.
Bitcoin (BTC/USDT) 4-Hour Chart Analysis
The Bitcoin chart shows a 4-hour timeframe analysis, focusing on a short-term uptrend channel.
Key Levels: The price is trading within an ascending channel. A significant support zone is identified between 112,000 - 114,000 USDT. A "weak supply zone" is marked around 118,000 USDT, which is currently acting as support. A major resistance is at approximately 124,564 USDT.
Price Action: After a strong push towards the channel's upper boundary, the price has pulled back and is now retesting the "weak supply zone." The blue and red arrows project two possible scenarios: a bounce back up towards the channel's high, or a deeper retracement towards the channel's lower trendline. The price movement appears to be following the blue projected path.
Indicators: The Ichimoku cloud and RSI strategy are used to confirm the trend and identify entry/exit points. The price is above the Ichimoku cloud, indicating a bullish trend.
Conclusion: Bitcoin is at a pivotal point within its uptrend channel. Its ability to hold the 118,000 USDT level will be crucial for a potential re-test of the 124,564 USDT resistance.
Xauusdsignal
XAUUSD – The Calm Before the Storm (D1 Weekly Plan)🔥 Market Pulse
Last week closed with a powerful bullish D1 candle, fueled by FED’s policy hints & Trump’s latest remarks.
This wasn’t just news-driven – it was a liquidity shift, a signal that the next big directional play is loading.
⚔️ Key Battle Zones (MMFLOW View)
End Game Demand Zone (3273) → The last stronghold for buyers.
Power Reaction Zone (3316 – 3340) → First defense line where bulls are likely to step in hard.
Key Mid Zone (3357 – 3372) → The “gateway” level that decides if momentum will sustain.
Power Reaction Zone (3399) → Bears will strike back here.
End Game Supply Zone (3435) → The final battlefield – where the big game ends.
📈 Scenarios for the Week Ahead
Primary Plan (Bullish bias):
Gold may dip into 3316 – 3340 before resuming its upward leg.
Holding this zone opens the path to 3399 → 3435.
Alternative Plan (Risk case):
A break below 3316 could drag price back to 3273 before any bigger move.
🎯 Trading Approach
Buy on dips inside reaction zones.
Targets: 3399 – 3435.
Protective stop: Below 3273.
🚨 Final Takeaway:
Gold is entering a critical phase – this isn’t just another bounce, it could be the start of a medium-term breakout cycle.
Bulls have the upper hand, but both sides are preparing for the showdown. Stay ready for a volatility spike.

XAUUSD – US Session Weekly Close Update - FED NEWS📰 Macro Outlook
The Federal Reserve remains firm on its 2% inflation target while keeping unemployment low.
The US labor market is showing signs of weakness: job supply stagnates, demand falls → higher unemployment risk.
New tariffs could push inflation higher while also slowing down economic growth.
Fed gradually moves away from FAIT, focusing back on a strict 2% inflation goal.
Powell didn’t promise rate cuts, but hinted at possible policy easing in September if economic conditions align.
🔑 Key Technical Levels
Buy Retest Zone: 3343 – 3345
Mid-term Resistance: 3377 – 3380
Target Buy Zone: 3396 – 3400
✅ Primary Scenario (Bullish Bias)
After a strong breakout from the downtrend, price is likely to retest 3343 – 3345 to build momentum.
Holding above this zone opens the path to 3377 and potentially 3396 – 3400.
🔻 Alternative Scenario
A clean break below 3340 with an H1 close could push price lower toward 3325 – 3320 before a possible recovery.
🎯 Trading Plan for the US Session
BUY on retest 3343 – 3345
SL: below 3338
TP: 3377 → 3396 → 3400
Short-term SELL only if strong rejection appears around 3396 – 3400.
⚡ As liquidity thins out toward the weekend, it’s safer to follow the bullish momentum, scale positions wisely, and avoid chasing price near key resistances.

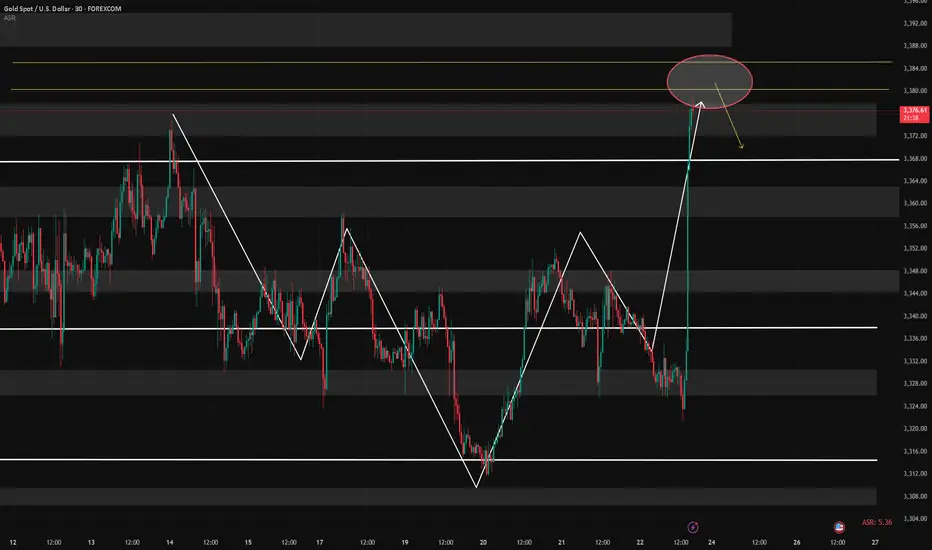
Rate Cut Expectations Boost Gold — Caution on HighsFed Chair Powell noted that shifting economic risks strengthen the case for rate cuts, signaling potential support for a 25bp cut at the September meeting. In response, gold bulls surged, breaking through the 3358–3366 resistance and reaching around 3378.
⚠️ Caution: After sharp rallies, pullbacks are common. Avoid blind chasing — if you do, keep positions light and be ready to close quickly.
📌 My outlook: I’ve started entering sell positions, with key supports to watch at 3366–3358–3352 during pullbacks.
Importantly, this rally has shifted the 1D structure; holding above 3350 could open the door for a bullish move toward the 3400 level.
Gold Analysis – Slight Bearish Bias After Failing at 3350Yesterday I wrote that after the false break and the bullish daily engulfing, Gold could reverse to the upside and the correction that started from the 3400 zone might have been finished.
With this idea in mind, I went long, and the entry turned out to be a real sniper one as Gold started to rise strongly exactly after my entry, reaching once more the 3350 zone.
Here, however, price action turned “boiling” and, in the end, bulls couldn’t push through decisively.
After another attempt to conquer 3350 at the beginning of the Asian session, Gold failed again. During the night (my night), I decided to close my trade with +120 pips profit. It was not the outcome I expected, but still a positive one.
Looking back, this decision seems correct so far since price is now back around my entry level from yesterday.
________________________________________
Where Do We Go From Here?
So far, the week has no resolution. Neither bulls nor bears are in full control.
However, after the repeated failure to break 3350, my outlook leans slightly bearish at this moment.
• Plan: I will look to sell rallies during the day if I can find a good risk:reward setup.
• Target: 3280 is the bearish objective.
• Invalidation: If bulls finally manage to resolve the 3350 level, this outlook is negated.
________________________________________
Final Note:
Gold has become very unpredictable these days. What is true at the time of posting could change quickly during the session. That’s why I update my analyses during the day.
👉 If you want to be notified of these updates, don’t forget to like this idea.
💬 And if you have questions, feel free to use the comment section — I will try to respond to all.
🚀
Disclosure: I am part of TradeNation's Influencer program and receive a monthly fee for using their TradingView charts in my analyses and educational articles.

22/8/68 : XAUUSD ( US. Session )Resistance
3350-3355
3340-3345
3334
Support
3323
3312-3317
3302-3307

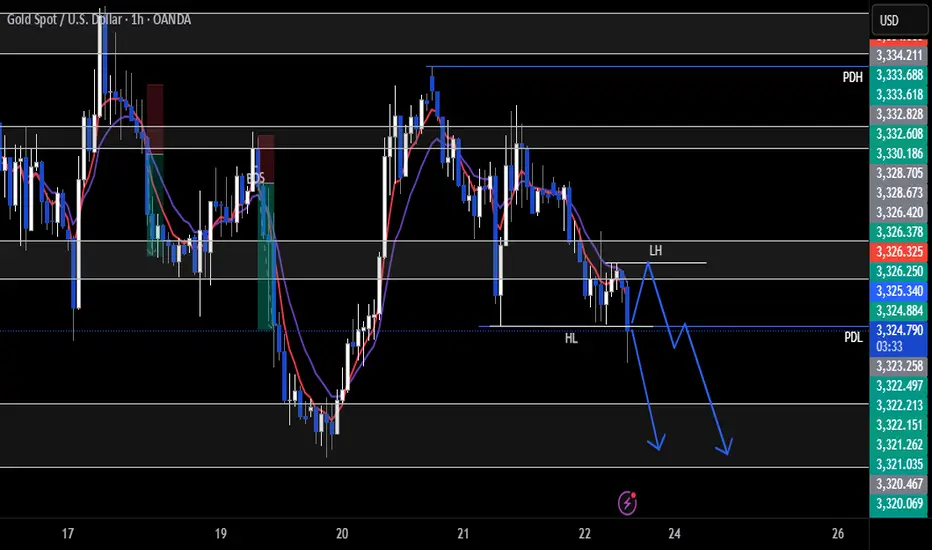
Gold Trade Set Up Aug 22 2025www.tradingview.com
OANDA:XAUUSD
Gold Trade Set Up: Price has created LH and is now testing recent HL and PDL , when we get a close under, i will be looking for sells to the next zone and swing low. But if price fails to close below HL at 9 i will wait for internal liquidity to be taken on the 15m-5m before looking for sells

XAU/USD Price Action Zones & Trade Setup (Aug 20, 2025)Analysis:
The market recently made a CHoCH (Change of Character), signaling a possible bearish structure.
First Selling Zone (3340 – 3350): Strong resistance area where sellers may push price down.
Second Selling Zone (3350 – 3360): A deeper liquidity grab area for confirmation shorts.
First Buying Area (3308 – 3320): Demand zone where buyers might step in for a short-term bounce.
Second Buying Area (3270 – 3280): Stronger demand, ideal for swing buy opportunities if price dips further.
Price is currently around 3323, hovering near equilibrium, likely to retest selling zones before dropping to buying areas.
📈 Trade Plan:
Sell Entries
🔹 First Short: Around 3340 – 3350 (First Selling Zone).
🔹 Second Short (confirmation): Around 3350 – 3360 (Second Selling Zone).
🎯 Targets:
TP1: 3320 (First Buying Area)
TP2: 3280 (Second Buying Area)
🛑 Stop Loss: Above 3365
Buy Entries
🔹 First Buy: Around 3310 – 3320 (First Buying Area) for a small bounce.
🔹 Second Buy (stronger): Around 3270 – 3280 (Second Buying Area).
🎯 Targets:
TP1: 3340 (back to resistance)
TP2: 3355 (liquidity above first selling zone)
🛑 Stop Loss: Below 3260

XAUUSD Trade Idea 2025/08/20Gold has been ranging between 3287-3393 for a long time.
Price recently has shown a reaction at Fib 0.618 and creating a new HH, now it's time wait for a new HL to confirm a market structure shift in lower tf. There will be a potential Long setup if it retest the recent support area around 3330, and targeting the range high.

22/8/68 : XAUUSD ( Europe / London Session )Using it from Europe Session until 7.00PM , I'll new analysis and update at 8.00PM
Resistance
3348-3353
3338-3343
3333
Support
3323
3312-3317
3302-3307

XAUUSD – Gold in Tight Consolidation | Weekend Trading PlanGold is currently showing the classic sequence: accumulation – breakout – consolidation again. Price is moving within a narrowing triangle pattern, preparing for the next explosive move.
From both a technical perspective and the macro–geopolitical backdrop, Gold is hesitating to choose a clear direction in the short term. But remember: the tighter the range, the stronger the breakout.
👉 Strategy: Wait for the breakout, then follow the direction with clear key levels for reactions and take-profit setups.
🔑 Key Levels
Resistance: 3337 – 3343 – 3350 – 3356 – 3365
Support: 3325 – 3320 – 3314
📌 Scenario 1 – Buy Setup
Buy Zone: 3316 – 3314
SL: 3309
TP: 3320 – 3325 – 3330 – 3335 – 3340 – 3345 – 3350 – 3360 – 3370
📌 Scenario 2 – Sell Setup
Sell Scalp: 3348 – 3350
SL: 3355
TP: 3344 – 3340 – 3335 – 3330
Sell Zone (Main Reaction): 3365 – 3367
SL: 3372
TP: 3360 – 3355 – 3350 – 3345 – 3340
🎯 MMFLOW Notes
Price compression = incoming volatility.
Always prepare two scenarios when trading narrow ranges.
Patience is profit – wait for market confirmation at key levels.

Gold (XAU/USD) Analysis - 22 August 2025Gold continues to trade within a high-volatility range, and today’s structure provides us with very clear execution zones validated across the Daily, 4H, and 1H timeframes. By blending price action, order flow, and institutional concepts, we can refine both the buy and sell areas that carry the highest probability of delivering asymmetric returns.
Macro Context (Daily)
The daily chart maintains a bullish undertone as higher-lows remain intact, and price continues to defend key demand blocks. That said, the upper range resistance around the $3360–$3380 area has capped recent rallies, leaving the market positioned between a strong daily demand base and significant supply overhead.
Swing Structure (4H)
On the 4H, gold is consolidating between a fresh demand block at $3318–$3324 and a supply block at $3356–$3362. This consolidation aligns perfectly with premium/discount zones of the current 4H range, giving us clarity on where institutional flows are likely to engage.
Execution Refinement (1H)
The 1H chart adds precision:
A bullish FVG and demand overlap sit at $3320, creating inducement for long entries.
Above, clear liquidity is resting just beyond $3355 and again near $3380, prime zones for potential stop-runs and reversals.
Momentum indicators (RSI/MACD) show hidden bullish divergence at demand and early exhaustion at supply — adding weight to both sides of the range.
Execution Zones
Primary Buy Zone (Golden Zone) → $3318 – $3324
Entry: $3322 | SL: $3312 | TP1: $3345 | TP2: $3360
Confluence: Daily demand OB + 4H discount zone + 1H FVG + RSI divergence.
Secondary Buy Zone → $3302 – $3308
Entry: $3306 | SL: $3296 | TP1: $3328 | TP2: $3340
Confluence: Deep retracement into 61.8% Fib + untapped 4H OB + liquidity sweep potential.
Primary Sell Zone → $3356 – $3362
Entry: $3359 | SL: $3369 | TP1: $3342 | TP2: $3325
Confluence: Daily resistance + 4H supply OB + premium zone + liquidity inducement above $3355.
Secondary Sell Zone → $3378 – $3384
Entry: $3381 | SL: $3391 | TP1: $3360 | TP2: $3335
Confluence: Major untested daily supply + 4H imbalance + stop-run liquidity.
Executive Summary
The clearest asymmetric opportunity lies in the Primary Buy Zone at $3318–$3324, which aligns across Daily, 4H, and 1H with multiple layers of confluence. This zone provides tight risk control with substantial upside toward $3360.
Until we see a decisive break of either the $3300 handle or the $3380 resistance, expect gold to remain range-bound with sharp liquidity grabs at both extremes. Institutional order flow favors a buy-the-dip bias within demand zones, while rallies into supply should be approached with tactical shorts.
Golden Zone = Buy $3318 – $3324
(best confluence: demand OB + FVG + RSI divergence + structural HL defense)

XAUUSD – Bullish Outlook Confirmed1. Yesterday’s Context
In my yesterday’s analysis, I mentioned that although Gold had broken below the 3330 support, it was most probably a false break.
Yesterday’s price action confirmed this view: Gold pushed back above the broken level, accelerated higher, and even broke above the falling wedge trendline, reaching a high around 3352. On top of that, the daily chart closed with a strong bullish engulfing pattern.
________________________________________
2. The Key Question
Is this the start of a larger bullish continuation?
________________________________________
3. Why the Setup Looks Bullish
• False break below 3330 quickly reversed.
• Break above the falling wedge trendline = strong bullish signal.
• Daily bullish engulfing confirms momentum shift.
• Technical structure now favors continuation to the upside.
________________________________________
4. Trading Plan
At the time of writing, Gold is in a normal correction after yesterday’s strong rally.
• I remain bullish.
• I am looking to buy dips into support zones.
• Target: around 3380 as the next upside level of interest.
________________________________________
5. Final Note 🚀
The outlook remains unchanged: the bias is bullish, and yesterday’s breakout gives conviction that buying dips is the right strategy.
Disclosure: I am part of TradeNation's Influencer program and receive a monthly fee for using their TradingView charts in my analyses and educational articles.

8/21: Sell High and Buy Low Within the 3358–3332 RangeGood morning, everyone!
Gold rallied strongly yesterday. On the 4H chart, bulls still show upward momentum, but price has now entered the key 3352–3358 resistance zone. On the 30M chart, divergence signals are emerging, suggesting that the higher gold climbs, the greater the risk of a pullback.
During a retracement, watch support at 3343–3337–3332. In the short term, consider trading within the 3358–3332 range by selling near resistance and buying near support, while closely monitoring support/resistance flips. If bulls sustain momentum and break above 3358, the 3363–3378 zone offers a relatively safer area to look for short setups.

XAUUSD: Channel Ride to the Top or Fakeout Incoming?Gold is moving inside an uptrend channel, building momentum after bouncing from support. Right now, price is testing the key zone 3344 – 3348 – this is where the market will decide its next move.
📊 MMFLOW Outlook
✅ Scenario 1: Trend continuation (main bias)
Holding above 3344 – 3348 keeps the bullish structure intact.
A clean breakout over 3348.7 opens the path to:
→ Target 1: 3361.2
→ Target 2: 3369.8 (top of the channel)
⚠️ Scenario 2: Deeper retest before the move
If price rejects 3348 – 3351, a dip back to 3334 is likely.
Buyers may step in here to reload positions and push price higher.
A break below 3334 would weaken the bullish setup short-term.
📌 Key Levels (NY Session):
Support: 3334 | 3344 – 3348
Resistance: 3361.2 | 3369.8
✨ MMFLOW Note:
👉 Bias stays bullish, but patience at liquidity zones is key.
👉 Follow the flow – manage risk before the market makes the move.
