XAUUSD/GOLD SELL LIMIT PROJECTION 27.10.25Pattern Context
There’s a descending triangle or M-pattern that has been broken to the downside.
Labels such as “BREAKED M PATTERN NECKLINE HERE” and “BREAKED TRIANGLE PATTERN” indicate bearish structure.
Trade Setup
The chart projects a sell limit order in the region around 4,062–4,083 (highlighted red zone).
Stop loss is above the recent high — around 4,083.185.
Entry appears to be at the retest zone near 4,062.189 (“BREAKER ZONE RETEST & SELL”).
The target (take-profit area) points toward temporary support at approximately 4,031.150, suggesting a bearish continuation.
Trend Lines
A broken uptrend line and triangle breakout support the short bias.
The blue uptrend line and black triangle structure confirm the confluence zone where the retest and rejection may occur.
Summary of Bias
Direction: Bearish (Sell setup).
Confirmation: Triangle & M-pattern breakdown, retest expected.
Risk Management: Stop above 4,083; target near 4,031 (risk-reward ratio ≈ 1:2 depending on entry).
Xauusdsignal

Gold Rebound SetupGold (XAU/USD) is testing the support trend line around 4030. If it holds, price may rebound toward resistance levels at 4160 and 4236, with a potential target near 4370. A break below the trend line could indicate further downside pressure.

GOLD (XAU/USD): THE FED & THE FINAL DIP – GET READY TO SHORT!1. MACRO OVERVIEW SUMMARY
Headwinds (Short-term): The agreed-upon US-China trade framework reduces tariff fears, putting near-term selling pressure on Gold.
Tailwinds (Mid-term): Weak CPI data (3% inflation) solidifies expectations for Fed rate cuts (weakening the USD) + Escalating Russia-Ukraine Tensions.
The Decisive Event: The FOMC decision on Wednesday will serve as the ultimate compass for Gold's next major move.
2. TECHNICAL ANALYSIS: STRUCTURE & TARGETS
Current Structure: Following the strong bullish impulse, Gold is in a major corrective phase. The recent price structure was broken, confirming that the short-term trend has shifted to bearish.
Anticipated Scenario: Gold has likely completed its retracement and is expected to execute the final drop to conclude the correction process before a potential reversal.
The Magnet (Target): The critical Value Gap on the daily timeframe (around $3,880 – $3,920) is the ultimate destination this final move is likely heading for.
WAITING FOR ENTRY: Gold is anticipated to rally slightly to retest the recently broken structure area before continuing its descent.
3. TRADING STRATEGY (BEARISH BIAS)
We favor a SHORT position, aligning with the final corrective down-move:
Ideal Entry Zone: $4,080 – $4,100 (Retest of the broken structure).
Take Profit (TP1): $3,970 (Nearest Demand/Support Zone).
Take Profit (TP2): $3,880 (Final Target at the major Daily Value Gap).
Stop Loss (SL): $4,135 (Above the key Supply Zone).
Crucial Note: Maintain strict risk management ahead of Wednesday's FOMC. This short move could finalize the major correction!
Where do you think this final drop will end? Comment below!
#Gold #XAUUSD #FOMC #Trading #TradePlan

XAUUSD 4H Short Setup: Selling the FVG RetraceKey Observations:
Recent Structure: The price has experienced a strong move down (impulse leg) followed by a small retracement and then further downside movement. The overall momentum is currently bearish.
Fair Value Gap FVG: The key focus is the Fair Value Gap FVG, marked by the blue/gray box. This is an area of price inefficiency left behind during the strong bearish move. It typically acts as a target for price to retrace to before the dominant trend continues.
Setup Rationale: The analysis suggests the current price movement (around 4,064.9 will see a retracement higher (green arrow up) to fill the FVG and potentially touch the liquidity zone marked by the red box (often representing an optimal entry or order block within the FVG.
Trade Projection: After reaching this inefficiency zone ($\sim\text{4,085}$ to $\sim\text{4,105}$), the projection is for a strong bearish continuation (green arrow down), aiming for the downside target in the green shaded area 4,045.
Conclusion:This setup anticipates a bounce into resistance FVG zone before a continuation of the selling pressure. The core strategy is selling a retracement in a short-term bearish market.

GOLD HIGH PROBABILITY SETUPS SOON!!!🚨 XAUUSD HIGH PROBABILITY BUY SETUP 🚨
* Here We Can See Clearly The Next Potential Moves For GOLD Coming Hours/Days.
* Keep Your Eyes Close On Your Trading Positions.
* Happy PIP Hunting Traders.
FXKILLA.

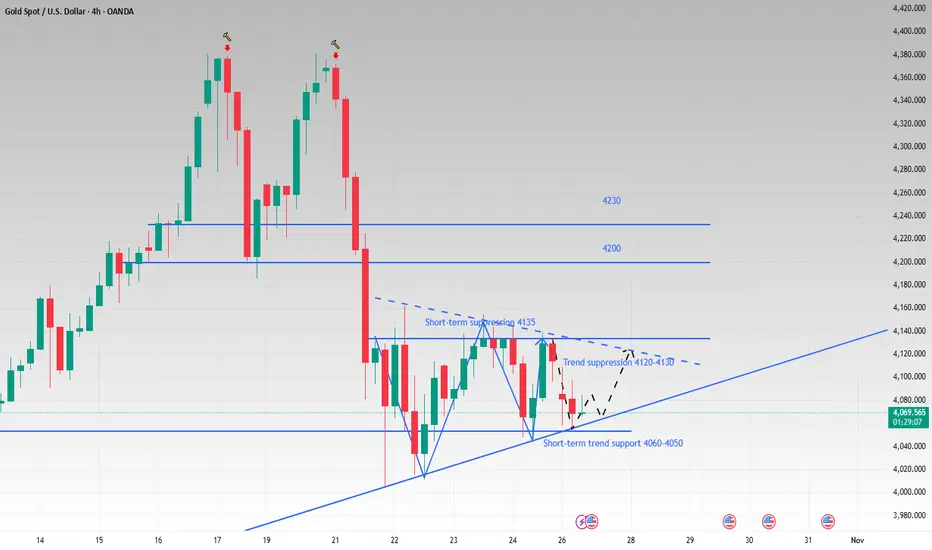
The triangle pattern breaks and looks at the directionLast week we repeatedly emphasized the importance of paying attention to the rising trend line of the 4H cycle. Until the price falls below this trend line, we will maintain our bullish stance. Although news of easing trade tensions between China and the United States over the weekend has brought a slight cooling to the market's tense mood, this has only temporarily suspended the bullish counterattack. Whether a real and effective consensus can be reached still requires attention to the APEC summit at the end of the month.
At the same time, the Federal Reserve's interest rate cut this week is almost a foregone conclusion, which has provided some support for the rise in gold prices. This has also contributed to the current relatively flat trend in gold prices, without as much fluctuation as last week. In addition to the rising trend line that we have been paying attention to, there is also a small downward trend line in the 4H chart, which makes the current trend fall into a triangle consolidation range.
The short-term support below is 4060-4050, and the trend suppression above is 4120-4130. Before the triangle pattern breaks to determine the future trading direction, we can sell high and buy low around this range.
The current hourly moving average is arranged downward, and it is expected to test the lower support again. If it falls back to the lower support and does not break, we can consider going long on gold.
XAUUSD – Gold Trapped in Uncertainty Before the FOMC Market Overview:
Gold remains range-bound as US–China trade optimism tempers safe-haven demand, while expectations for further Fed rate cuts continue to weigh on the USD and cushion downside pressure.
The market is hesitant ahead of the two-day FOMC meeting this week, as traders await clear policy guidance before taking larger directional bets.
In short — macro tone is mixed:
Trade headlines reduce fear.
Fed expectations support gold.
Yet the chart shows indecision — a compression phase before expansion.
Technical Outlook (H1)
On the chart, gold continues to oscillate inside a tightening triangle, holding above the 4,050–4,060 Support Trendline (OBS BUY ZONE).
The liquidity structure shows buy-side absorption near the lows, while sellers remain active around the 4,186–4,260 resistance zones.
If gold maintains stability above 4,050, buyers may attempt to push toward the 4,107 neckline, and possibly test 4,186, before meeting the next supply layer at 4,260.
Conversely, a failure to hold support could expose the 4,002 and 3,930 liquidity pools below.
Key Technical Zones:
Support Trendline / OBS BUY ZONE: 4,058 – 4,050
Neckline / Local Resistance: 4,107 – 4,110
Reaction Zone (Fibo / Supply): 4,186 – 4,260
Deeper Liquidity Zone: 4,002 – 3,930
MMFLOW View – Plan for the Session
At this stage, the market is in accumulation mode.
As long as price stays above 4,050, MMFLOW maintains a neutral-to-bullish bias, focusing on how price reacts near the neckline at 4,107.
The ideal scenario would be:
A short-term pullback to absorb liquidity near 4,050,
Followed by a push toward 4,186,
Then a possible correction before the FOMC outcome.
However, if sellers manage to reclaim 4,050, a drop into 4,002 or even 3,930 could mark the next deep liquidity grab — setting up the base for a larger rally later.
Summary:
Gold remains stuck between macro hesitation and structural compression.
Liquidity is building on both sides — and the breakout direction will likely align with post-FOMC volatility.
🟡 Bias: Neutral-to-Bullish above 4,050.
Watch how the market defends 4,058 and reacts at 4,107–4,186.
📊 What’s your take — will FOMC give gold a reason to break free, or keep it trapped another week?
👉 Follow MMFLOW TRADING for daily structure breakdowns & institutional flow insights.
🟣 Chart: XAUUSD H1 – Smart Money Flow structure showing liquidity sweep, compression triangle, and Fibo confluence zones before the FOMC decision.

Today's gold trading strategyTwo types of short-term signals, focusing on immediate verification
Fed's short-term "dovish signals" catalyze: In the latest remarks by Fed officials, three voting members explicitly stated that "no interest rate hike is needed in November, and we need to observe the cooling trend of employment data", and the CME Fed observation tool shows that the probability of an interest rate hike in November has dropped from 25% to 12%. Historical data shows that in the 3-5 trading days after the cooling of the interest rate expectation, gold typically rises by 1.2%-1.8%, and the US dollar index is under short-term pressure (currently the US dollar index is 94.2, and if it falls below 94, it will further open up the upward space for gold);
Geopolitical conflict "immediate safe-haven impulse": The situation in the Middle East suddenly escalated, Israel launched a ground attack on the Gaza Strip, and the Houthi forces announced "expanding the attack range on Red Sea shipping", the spot price of London gold jumped by 12 US dollars on the same day, and safe-haven funds flowed into gold ETFs (such as SPDR) for 280 million US dollars in a single day. Although the demand for safe-haven protection from such sudden geopolitical events is not long-lasting, it will form a short-term upward momentum of 3-5 trading days;
Today's gold trading strategy
xauusd @ buy4050-4060
TP:4080-4100-4150
SL:4030

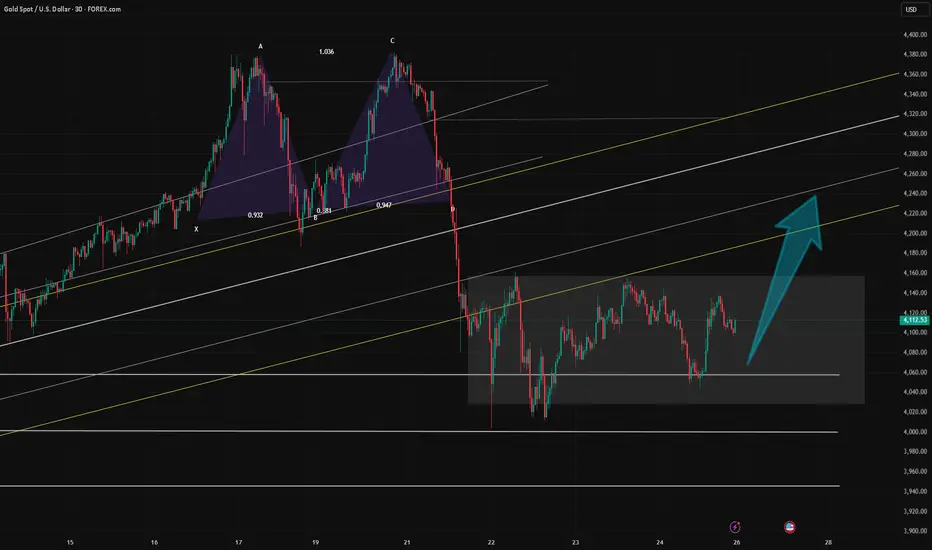
Plan |Gold Gradually Accumulating, Preparing for an Upward Wave?🔍 Market Context
After reaching the historical peak ATH GOLD 4,371 USD , gold underwent a deep correction, breaking the short-term bullish structure (BoS) and retesting the OB Bearish zone above .
However, since the price returned to the 4,040 – 4,060 USD area, the market has shown clear signs of liquidity absorption ($$$) and maintained an internal upward trendline, indicating that buying momentum is returning.
The current structure suggests gold is in a re-accumulation phase before forming a medium-term recovery wave towards the 4,185 → 4,243 USD zone.
Buyers hold the advantage as long as the price does not break the main support trendline.
💎 Key Technical Structure
Support Zone: 4,040 – 4,060 USD → a strong support zone confluencing with the trendline, where institutional buying previously appeared.
Support Trendline: connecting the series of higher lows from 15/10 → short-term trend remains bullish.
Liquidity Zone $$$: 4,060 – 4,080 → supply absorption zone, confirming its role as a “price base”.
Resistance Zone: 4,149 – 4,185 → the first resistance zone to break to confirm the recovery momentum.
Target FVG / Supply Zone: 4,243 – 4,250 → potential profit-taking area or reversal consideration point.
Current structure:
→ Short-term: bullish corrective move.
→ Medium-term: potential for forming an extended recovery wave if holding above 4,040 USD.
📈 Trading Scenarios
1️⃣ BUY Setup – Retest Trendline / Liquidity Zone 4,060 USD
Entry: 4,060 – 4,070
SL: 4,035
TP1: 4,149
TP2: 4,185
TP3: 4,243
✅ Condition:
Price hits the trendline or liquidity zone 4,060 and shows a bullish reversal signal (rejection / bullish engulfing).
➡️ This is a high-probability setup, confluencing trendline structure + liquidity zone support, often where large buyers re-enter the market.
2️⃣ BUY Setup – Break & Retest resistance zone 4,149 USD
Entry: 4,149 – 4,155
SL: 4,130
TP1: 4,185
TP2: 4,243
✅ Condition:
Wait for the price to break the 4,149 resistance zone with strong volume, then lightly retest without closing below 4,130.
➡️ Trend-following setup – confirms the return of buying momentum and extends the target to the FVG zone 4,243 USD.
3️⃣ SELL Setup (Scalp reaction) – FVG 4,243 USD
Entry: 4,240 – 4,245
SL: 4,255
TP: 4,185 → 4,150
✅ Condition:
Only execute if there is a strong reaction at FVG 4,243 without a continuation break signal.
➡️ Short-term technical sell – leveraging the supply zone reaction, not holding the position long.
⚠️ Risk Management
Prioritize trading in the buy direction, avoid selling against the main trend.
If H2 closes below 4,035 → bullish scenario invalidated, wait for a new structure.
Do not FOMO buy in the mid-range (4,090–4,130).
Keep moderate volume, move SL to breakeven when price surpasses 4,149.
💬 Conclusion
Gold is in a gradually ascending accumulation phase after a strong decline.
As long as the price holds the trendline and support zone 4,040 – 4,060 USD, gold is likely to rebound following the liquidity + breakout retest model, with the main target being 4,185 → 4,243 USD .
If it breaks through 4,243 USD, the market could trigger a stronger rally towards 4,300 – 4,340 USD .
👉 Reasonable Strategy:
Buy 4,060–4,070 → TP 4,185 / 4,243 USD
Add Buy when breaking 4,149 USD with volume confirmation.
Technical Sell 4,243 USD if there is no signal to break higher.
🔥 “As long as 4,040 holds, gold remains in accumulation — patience will pay.”
⏰ Timeframe: 2H
📅 Update: 27/10/2025
✍️ Analysis by: Captain Vincent

Gold Price Outlook – Trade Setup (XAU/USD)📊 Technical Structure
OANDA:XAUUSD Gold (XAU/USD) is consolidating within a symmetrical triangle formation. The resistance zone lies between $4,104 – $4,113, while the support zone is marked at $4,050 – $4,055. The price has repeatedly tested both zones, suggesting market indecision. A breakout from this tightening structure could dictate the next directional move.
📌 Trade Setup
Entry: $4,061 (near trendline support)
Stop Loss: $4,050 (below support zone)
Take Profit: $4,113 (resistance)
Risk–Reward (R:R): ≈ 1 : 4.36
🌍 Macro Background
Renewed optimism surrounding US-China trade talks has reduced safe-haven demand, leading to gold’s decline near $4,065 earlier today. US Treasury Secretary Bessent confirmed that both sides reached a framework for discussion, with China expected to delay its rare earth policy by one year. At the same time, markets are nearly certain the Federal Reserve will deliver a 25 bps rate cut at the October FOMC meeting, with another cut possible in December. While trade optimism weighs on gold, rate-cut expectations continue to provide a safety net for the metal.
🔑 Key Technical Levels
Resistance: $4,104 / $4,113
Support: $4,055 / $4,061
Upside Target (if breakout): $4,130 – $4,150
📋 Trade Summary
Gold is trapped in a tightening triangle between $4,055 and $4,113. Traders may look for long entries on dips near $4,061 with targets at $4,113, aligning with Fed rate-cut expectations. However, renewed US-China optimism caps the upside. A decisive break below $4,050 would invalidate the bullish outlook and open the door toward $4,020.
⚠️ Disclaimer
This analysis is for reference only and does not constitute trading advice. Trading involves significant risk, and proper risk management is essential.

Gold is weak. Short-term short selling is recommended.Spot gold rebounded on Friday, paring intraday losses after weaker-than-expected US Consumer Price Index (CPI) data, closing above 4,100. However, it remained in a negative trend for the week, ending the previous nine-week winning streak. The weak inflation data reinforced market expectations of a 25 basis point interest rate cut by the Federal Reserve at its October 29-30 monetary policy meeting. Market sentiment improved on hopes of a easing of the Sino-US trade standoff. The White House confirmed on Thursday that US President Trump will meet with the President of Korea on the sidelines of the APEC summit in South Korea on October 30, a development that could help ease recent trade tensions.
Technically, gold is showing initial signs of consolidation after a strong rebound. The short-term outlook has turned bearish, as gold prices are currently trading below the 21-, 50-, and 100-period simple moving averages (SMAs) on the 4-hour chart, suggesting fading bullish momentum. From a wave perspective, the 4-hour chart shows an ABC corrective wave pattern, with 4380 as the starting point for wave A. Currently, gold is in the stage of confirming the high point of a wave B rebound, with a high probability of a subsequent wave C decline.
On the 1-hour chart, after forming a double top at 4380 this week and then retreating, the overall market is currently in a consolidation phase with a more bearish outlook. Resistance lies above 4160-4185, while support lies below 4004. Range-bound trading is expected next Monday. If there is risk-averse news over the weekend or if 4160 is broken directly, the weak trend can be reversed.

XAU/USD: Wave 5 is already starting or the bulls' last hope?XAU/USD: Wave 5 is already starting or the bulls' last hope?
📈 Weekly Scenarios
Bullish scenario: Price holds above ~$4,056-4,000, breaks through ~$4,267 → start of waves (5) up → target ~$4,380-4,455+.
Consolidation: Price moves between ~$4,000 and ~$4,267, forming a base before the next major move.
Bearish scenario: Break of support at ~$4,000 with volume confirmation → start of correction → target ~$3,820-3,943.
✅ Conclusion
On the weekly timeframe, gold is at a key milestone: either a strong profitable rally (wave 5) begins, or a correction reverses.
Main signals: holding above ~$4,000 and breaking through ~$4,267 is the way to the upside; a break below ~$4,000 is a signal for caution.

XAU/USD | Day Trade Bullish Map – Can Gold Reach 3800 This Week?🏆 XAU/USD | Metal Market Wealth Strategy Map (Day Trade) 🥇
🎯 Plan: Bullish Wealth Heist
The thief’s map is drawn — and today, the gold vault is our target.
🔑 Strategy Style (Thief Layering Method):
Instead of a single-entry, this plan uses layered limit orders (multiple entry levels). Think of it as planting “buy traps” across the chart to secure the best loot.
📥 Entry Layers (Buy Limits):
3660 💰
3670 💰
3680 💰
3690 💰
3700 💰
(⚡ Add more layers if your style allows — the thief never comes with just one key!)
🛑 Stop Loss (Escape Door):
SL @ 3630 (⚠️ Reminder: This is MY thief escape hatch. You’re free to place your own exit plan depending on risk appetite.)
🎯 Target (Loot Point):
TP @ 3800 (near strong resistance, overbought zone & police patrol 🚨)
— Remember: take profits where you feel safe. The thief escapes when the bag is full!
📊 Thief’s Key Notes
This is a layering strategy, designed for dynamic entries & better position cost-averaging.
XAU/USD often reacts strongly around resistance bands — watch for liquidity hunts before the move.
Don’t marry the trade — grab profit, exit quick, and live to raid another day.
🔗 Related Pairs to Watch (Correlation Check)
OANDA:XAGUSD (Silver): Moves in sync with Gold, but can be more volatile.
TVC:DXY (US Dollar Index): Inverse correlation — if USD weakens, gold often rallies.
FX:EURUSD : Another inverse play against USD, gold strength may reflect here.
SP:SPX / PEPPERSTONE:NAS100 : Risk sentiment cousins — equity weakness often boosts gold.
✨ “If you find value in my analysis, a 👍 and 🚀 boost is much appreciated — it helps me share more setups with the community!”
⚠️ Disclaimer: This is a Thief Style Strategy, shared for educational & fun purposes only. Not financial advice — trade at your own risk.
#XAUUSD #Gold #Forex #DayTrading #TradingStrategy #ThiefTrader #FXCorrelation #Metals #Scalping #TradingView

XAU/USD Technical Setup ‖ Bullish Momentum or Smart Trap?🏆 XAU/USD: The Golden Heist Blueprint | Swing & Scalp Strategy 💰
📊 Market Overview
Asset: XAU/USD (Gold vs U.S. Dollar)
Market: Precious Metals
Strategy Type: Dual Setup - Swing Trading (Bullish) & Day Trading/Scalping (Bearish)
Risk Level: High Volatility Zone ⚠️
🎯 The Master Plan
🚀 Bullish Scenario: "To The Moon" Setup
Breakout Level: $4,400.00
Action: Direct long entry on confirmed breakout above resistance
Logic: Clean break = institutional momentum shift
🔻 Bearish Scenario: Scalping/Day Trade Setup
Breakdown Level: $4,050.00
Action: Short positions on confirmed break below support
⚠️ Trap Alert: Any pullback above $4,050.00 post-breakdown = potential smart money trap. Watch for false breakouts!
🛡️ Risk Management Zone
Stop Loss (Pullback Buy Plan): $3,950.00
⚠️ Disclaimer: This SL is based on my analysis for the bullish pullback scenario. You're the captain of your own ship! Adjust stops according to your risk tolerance, account size, and trading style. Never risk more than you can afford to lose.
🎖️ Profit Targets
Buy Side Target: $4,600.00
Exit Strategy Notes:
Strong resistance confluence at this level
Overbought conditions likely
Potential trap zone for late entries
Recommendation: Scale out profits gradually rather than waiting for the full target
Sell Side Target: $4,050.00
Exit Strategy Notes:
Major support level - expect bounces
High probability of liquidity grab at this zone
Consider partial profit taking before reaching full target
Recommendation: Trail stops as price moves in your favor
⚠️ Disclaimer: These targets are MY analysis, not financial advice. Take profits when YOUR strategy signals, not mine. Trail stops, scale out, or exit based on YOUR plan. Your money, your rules! 💪
🔗 Related Markets to Watch
Correlated Assets:
DXY (U.S. Dollar Index): Inverse correlation - Dollar strength = Gold weakness
GC (Gold Futures): Direct correlation - Institutional positioning indicator
XAUEUR (Gold vs Euro): Alternative safe-haven flow gauge
US10Y (10-Year Treasury Yield): Inverse correlation - Rising yields pressure Gold
BTCUSD (Bitcoin): Risk-on/risk-off sentiment indicator
Key Fundamental Drivers:
Fed monetary policy & interest rate decisions
Inflation data (CPI/PCE reports)
Geopolitical tensions (safe-haven demand)
Real yields & opportunity cost
🔑 Key Technical Points
✅ Breakout Confirmation: Wait for candle close above/below key levels
✅ Volume Analysis: High volume breakouts = higher probability
✅ Smart Money Traps: Watch for failed breakouts and liquidity grabs
✅ Risk-Reward Ratio: Calculate before entry - minimum 1:2 recommended
✅ Market Structure: Respect higher timeframe trends
🎭 Trading Psychology Reminder
This strategy has a playful "heist" theme for entertainment, but make no mistake — treat your capital with serious respect. The market doesn't care about our plans. Adapt, manage risk, and preserve capital above all else.
Remember:
No setup is guaranteed
Always use stop losses
Never risk your rent money
Emotions are the enemy
The market pays patient traders
✨ If you find value in my analysis, a 👍 and 🚀 boost is much appreciated — it helps me share more setups with the community!
#XAUUSD #Gold #GoldTrading #ForexTrading #SwingTrading #DayTrading #Scalping #TechnicalAnalysis #PreciousMetals #TradingStrategy #RiskManagement #Forex #GoldAnalysis #TradingIdeas #MarketAnalysis #PriceAction #Breakout #SupportAndResistance #TradingView #ForexSignals
Happy trading, and may the pips be ever in your favor! 🎯💎

Gold: Building a bottom, but caution remainsWeekend Greetings!
Over the past week, gold has been consolidating within the 4160–4000 range. Technically, this range suggests a short-term bottoming phase. However, given that prices recently reached new highs and have since formed a double-top pattern, it’s still too early to confirm a bottom. In the upcoming sessions, traders should remain cautious, avoid chasing highs, and be alert for potential bull traps or a fifth-wave decline, as mentioned last week.
On the 4H chart, higher lows are being established, and Friday’s close was above both the MA5 and MA20, with the MACD maintaining a bullish configuration. The MA60 and MA30 are currently positioned around 4180 and 4163, respectively, serving as key resistance zones. If gold can hold above these levels, there’s a good chance it will approach or even reclaim the 4300 level.
On the daily chart, gold remains supported by the MA20, with long lower wicks indicating active bullish participation, which favors further upside. However, the MA5 and MA10, located around 4154 and 4188, still act as short-term resistance. For a stronger bullish confirmation, the price needs to stabilize above 4160, ideally holding firm above 4180.
On the 30M/1H charts, moving averages are closely aligned, showing short-term consolidation. Notably, the last three candles on the 30M chart form a Morning Star pattern, a typical bullish signal. If this formation remains intact after the market opens, prices are likely to move higher.
From a fundamental perspective, no bearish news emerged over the weekend. Unless unexpected developments occur before the market opens, the technical outlook favors an upward move during Monday’s session.
XAUUSD Analysis todayHello traders, this is a complete multiple timeframe analysis of this pair. We see could find significant trading opportunities as per analysis upon price action confirmation we may take this trade. Smash the like button if you find value in this analysis and drop a comment if you have any questions or let me know which pair to cover in my next analysis.

XAUUSD: Structure Broken! Can the Fed Rate Cut Save Gold?Gold has just completed its first losing week in 10, after a historic rally. Following the record peak of $4,381.21, Gold experienced a sharp correction driven by profit-taking and easing US-China trade tensions. However, weaker-than-expected US CPI data has strongly reinforced expectations for an upcoming Fed rate cut, creating a significant market conflict.
I. MARKET CONTEXT ANALYSIS (H4)
Structure: The prior bullish structure has been broken, shifting the bias to bearish in the short term.
Liquidity: Market forces are now targeting key stop-loss zones to collect liquidity before the next major move.
Strategy: We look to Sell when price pulls back to the Supply Zone (Premium) and Buy when price sweeps liquidity into the strong Demand Zone.
II. DETAILED TRADING PLAN
1. SELL Scenario 📉 (At Supply Zones)
Trade 1:
Entry: $4,202 - $4,204
SL: $4,212
TP: $4,194 / $4,184 / $4,174 / $4,164
Trade 2:
Entry: $4,252 - $4,256
SL: $4,272
TP: $4,236 / $4,216 / $4,196 / $4,176
2. BUY Scenario 📈 (At Demand Zones)
Trade 1:
Entry: $4,158 - $4,161
SL: $4,151
TP: $4,168 / $4,178 / $4,188 / $4,198
Trade 2 (Critical):
Entry: $3,966 - $3,969 (Strong Demand Zone, post-liquidity sweep)
SL: $3,949
TP: $3,989 / $4,009 / $4,029 / $4,049
III. RISK MANAGEMENT NOTE
Capital: Always limit risk to ≤ 1% of capital per trade.
Confirmation: Prioritize waiting for reversal confirmation on lower timeframes (M15/M5) to optimize Risk/Reward ratio.
This is the decisive moment! Trade safe and good luck!
#XAUUSD #Gold #GoldAnalysis #Forex #Trading #Fed #Inflation

Trading strategy for gold next weekThe callback is in place and the rebound pattern has been established.
The key support has precisely stabilized: Over the past two trading days, the gold price dropped to a minimum of $4085 before quickly rebounding. This position precisely coincides with the 0.618 retracement point of the previous upward trend. The technical support is quite strong. From the time chart, there have been multiple "bottoming and rebounding" trends in the $4085 - $4100 range, indicating that the buying pressure at the lower levels is strong and the short-term selling pressure has been largely released.
The rebound trend has initially formed: Currently, the gold price has closed higher for two consecutive trading days and has broken through the short-term resistance level of $4100, forming a "two consecutive up days" trend. During the rebound process, the trading volume gradually increased, especially when breaking through $4100, the trading volume was 30% higher than that of the same period the previous day, indicating that the long-term funds have actively entered the market, and the short-term rebound trend has been initially established.
Trading strategy for gold next week
xauusd @ buy4060-4080
TP:4110-4130-4200

Review of Gold's Performance This Week📝This week, the gold market experienced severe volatility, showing an overall trend of a sharp decline followed by a volatile rebound. The details are as follows:
📈Price Movement:
On Monday, gold prices fluctuated between 4,218.32 and 4,354.88.
On Tuesday, gold plummeted by 6.3% at one point, marking the largest single-day drop since April 2013.
On Wednesday, it continued to fall, hitting a low of 4,003.43.
On Thursday, gold fluctuated within the range of 4,065.47 to 4,154.52.
On Friday, gold prices fell again, dropping below 4,060 at one stage with an intraday decline of over 1%, and finally closed at 4,110.55.
💡Influencing Factors:
✔The main reasons for the sharp volatility in gold prices this week include the following:
After a rapid rise in early stages, gold was in an overbought state, creating technical correction pressure. Meanwhile, investors had a strong sentiment to take profits, leading to a large number of sell-offs.
✔In addition, the cooling of risk aversion, the strengthening of the U.S. dollar, and the fact that Federal Reserve officials entered a blackout period ahead of the interest rate decision that are resulting in a lack of remarks supporting interest rate cuts in the market also reduced the appeal of gold.
✔However, factors such as the ongoing U.S. government shutdown, geopolitical tensions, and market expectations for further interest rate cuts by the Federal Reserve provided certain support for gold prices.
💎Outlook for the Future:
From a technical perspective:
If gold breaks through 4,161, it may pave the way for a test of 4,200. If it continues to rise, traders may push gold prices above 4,250, or even target 4,300 and higher record highs.
But if gold falls below 4,040, the next target will be the October 22 low of 4,004.

technical analysis for Gold (XAU/USD) based on your provided chaPrice: Around $4,112.53
Timeframe: 30-minute
Trend Structure: Gold is trading within a rising channel, suggesting short-term bullish momentum after rebounding from a support level.
🧭 Key Technical Zones
Support Level: $4,060 – $4,080
→ This zone has held price multiple times and aligns with the channel’s lower boundary.
Immediate Resistance: $4,125
→ Minor horizontal resistance, currently being retested.
Mid-term Resistance: $4,175 – $4,200
→ The upper boundary of the short-term consolidation range.
Main Target Zone: $4,381
→ Marked as the projected bullish target; aligns with the top of the ascending channel.
📊 Pattern & Projections
The chart shows a bullish continuation setup (possibly a flag or channel breakout in progress).
Price recently bounced from support and is respecting the ascending trendline, hinting at a possible push toward higher resistance levels.
A break above $4,125 could trigger momentum toward $4,175, then $4,225, and finally the target at $4,381.
⚠️ Risk Management
Invalidation: A close below $4,075 (support zone) would invalidate the bullish scenario and could push price back toward $4,025 – $4,000.
Stop-Loss (for buyers): Below $4,070.
Take-Profit Levels:
1️⃣ $4,175
2️⃣ $4,225
3️⃣ $4,381
🟢 Summary Signal
Bias: Bullish
Entry Zone: Around $4,100 – $4,115 (after confirmation of support hold)
Target: $4,381
Stop-Loss: $4,070 NASDAQ:TSLA NASDAQ:AAPL CME_MINI:NQ1! CME_MINI:ES1! COMEX:GC1! CBOT_MINI:YM1! COMEX_MINI:MGC1! NYMEX:CL1! COMEX:SI1! CME_MINI:RTY1! CBOT_MINI:MYM1!

Trading strategy for gold next weekThe low-level support has been verified through practical operations, and the rebound momentum is beginning to show.
Strong support is clearly effective: In the past three trading days, the spot price of gold in London dropped to the lowest level of 4044.07 US dollars and then rebounded rapidly. This position has formed a short-term "iron bottom". Although the current price has experienced a correction, it has always remained above the 4100 US dollar threshold, and the trading volume during the correction process did not significantly increase, indicating that the short selling pressure is limited and the buying pressure at the lower level is strong.
The rebound signal is beginning to emerge: After the release of the September CPI data, the gold price briefly rose by 30 US dollars. Although it subsequently fell back, it has broken the previous continuous decline trend. From the time chart, the 4100-4110 US dollar range has repeatedly shown a "bottoming out and rebounding" trend, with obvious short-term stabilization characteristics, and the rebound momentum is accumulating.
Trading strategy for gold next week
xauusd @ buy4060-4080
TP:4110-4130-4200

Gold at a Critical Crossroads: Surge to $4700 or Drop to $3500?If the price breaks through the yellow zone, it could reach the red zone range. And if it doesn't cross the yellow zone, there's a chance it could head toward the 4700 range

Last trading day. Watch for resistance levels.After the CPI data was released as expected, while the results appear bullish for gold, the market reaction was muted, and the price rebound was relatively weak. This is likely because the current gains may have already overdrawn all positive expectations, and the market needs a period of cooling off.
On the 4-hour chart, gold prices rose on the data, returning to a range of fluctuations. The moving averages are showing a relatively flat trend. The 5-, 10-, and 20-minute moving averages intersect with the middle Bollinger Band in the 4100-4110 range, which also represents a significant short-term support level. The 30-minute moving average is nearing its intersection with the upper Bollinger Band in the 4170-4180 range.
Based on technical indicators, watch for resistance at 4160 in the short term, with a breakout at 4180. Focus on support at 4100-4110 below.
Quaid believes that as the last trading day of the week, the price may also fluctuate slightly around 4130. But if it suddenly starts to break upward, then we need to pay attention to the suppression situation above. When the price first hits around 4160 and fails to break upward effectively, short sell with a light position at this position and make a profit of 30-40 points.
A happy weekend is coming, Quaid hopes everyone reaches their profit targets this week.
