XAUUSD | Gold to drop 2000PIPS, where is the best sell zone?🔍 Market Context
After breaking the medium-term uptrend structure at the main Trendline , gold has formed a clear sequence of Lower High – Equal Low (EqL) , indicating a phase shift from bullish to bearish.
Currently, the price is fluctuating around the 3,960–3,970 USD zone – this is a temporary liquidity accumulation area before heading up to retest the resistance at 4,015–4,050 USD , which was previously a Demand Zone now turned into a Supply Zone .
If a strong bearish reaction occurs here, it is highly likely that the price will extend its decline towards the Order Block 3,945–3,960 USD zone, or even deeper to the Premium Zone 3,884 USD .
💎 Key Technical Structure
Main Trendline: broken, confirming a structure change (ChoCH).
Resistance Zone: 4,010–4,015 → quick reaction resistance.
Supply Zone: 4,043–4,060 → strong technical pullback zone.
Premium Zone: 3,884–3,900 → discount zone, potential temporary bottom.
📈 Trading Scenarios
1️⃣ SELL Zone 1 – Scalp Reaction at Resistance Zone
Entry: 4,010 – 4,015
SL: 4,025
Take Profit : 4,005 - 3,995 - 3,975 - 3,965 - Open
➡️ Quick scalp reaction at nearby resistance – suitable for London/NY session trading.
2️⃣ SELL Zone 2 – Major Retest at Supply Zone
Entry: 4,043 – 4,060
SL: 4,065
Take Profit : 4,050 - 4,040 - 4,030 - 4,020 - 4,010/Open
➡️ Main setup – retest of supply zone confluencing with broken trendline, high probability if strong rejection on H1/H4.
3️⃣ SELL Continuation – Break & Retest below 3,945 USD
Entry: 3,945 – 3,950
SL: 3,965
TP: 3,884
➡️ Setup breaks EqL bottom confirming downtrend continuation, targeting Premium Zone.
4️⃣ BUY Setup – Reversal at Premium Zone 3,900 USD
Entry: 3,900
SL: 3,880
TP1: 3,910 - 3,920 - 3,930 - 3,940 - 3,950/Open
✅ Condition:
Only buy when a strong reaction candle appears (long-tail rejection / ChoCH bullish on M15–H1).
➡️ This is the final discount zone before major capital can return to the market – technical reversal setup, low risk / high reward.
⚠️ Risk Management
Prioritize SELL at supply zones, BUY at Premium – avoid trading mid-range.
Reduce volume in scalp setup (Sell 1).
If price closes above 4,070 → short-term downtrend is invalidated.
💬 Conclusion
Gold remains under short-term bearish pressure, however, the 3,884–3,900 USD zone could act as strong support.
The suitable strategy is to capitalize on the two resistance zones for Selling and observe technical Buying at the Premium bottom.
👉 Comprehensive Strategy:
Sell 4,010–4,015 | SL 4,025 | TP 4,005 → 3,965 🎯
Sell 4,043–4,060 | SL 4,065 | TP 4,050 → 4,010 🎯
Buy 3,900 | SL 3,880 | TP 3,910 → 3,950 🎯
🔥 “Trade with patience, react at precision zones — that’s how consistency is built.”
⏰ Timeframe: 1H
📅 Update: 28/10/2025
✍️ Analysis by: Captain Vincent
Xauusdsignal

Gold Price Outlook – Trade Setup (XAU/USD)📊 Technical Structure
Gold price (XAU/USD) is trading near $3,965, with the upside capped at the $3,981–$3,990 resistance zone. The chart shows a recent rejection at resistance and sellers stepping in. Unless bulls break above $3,990, the bias remains bearish with a retest of $3,923–$3,915 support zone likely.
🎯 Trade Setup
Entry: $3,81–$3,989 (near resistance)
Stop Loss: $3,993
Take Profit: $3,930 / $3,915
Risk-Reward Ratio: ≈ 1 : 4.53
🌐 Macro Background
Gold is under renewed pressure as US–China trade optimism undermines safe-haven demand. U.S. President Trump said a trade deal with China could be finalized this week, which boosted market sentiment. As Kitco’s senior analyst Jim Wyckoff noted: “The U.S.-China trade tensions have really diminished, with a possible trade deal later this week after a summit meeting between Presidents Xi and Trump. That’s bearish for safe-haven metals.” 【FXStreet】
On the monetary policy side, the Federal Reserve is expected to cut interest rates by 25 bps, lowering the Fed Funds Rate to 3.75%–4.00%. CME’s FedWatch tool shows markets have priced in nearly a 100% probability of this move, with further easing expected in December. While this provides some support to gold, trade optimism currently outweighs Fed dovishness.
🔑 Key Technical Levels
Resistance: $3,981 – $3,990
Support: $3,923 – $3,915
Psychological Level: $4,000
📌 Trade Summary
Gold remains capped below $3,990 and is at risk of further declines toward $3,930–$3,915. Short positions near resistance are favoured, unless Fed surprises with a deeper cut or US–China trade talks collapse, which could flip sentiment.
⚠️ Disclaimer
This analysis is for reference only and does not constitute trading advice. Trading involves significant risk, and proper risk management is essential.

ElDoradoFx PREMIUM – GOLD ANALYSIS (29/10/2025, ASIA SESSION)Gold (XAUUSD) closed the US session near 3,950 after rejecting from the descending trendline and the intraday 200EMA cap around 3,960–3,970.
The current structure shows a corrective rebound inside a broader bearish leg, with D1 still pointing down but short-term exhaustion visible around 3,885–3,900.
Asia opens with minor consolidation below resistance, setting the stage for either a continuation breakdown or a temporary pullback to 3,970–3,990 before sellers re-enter.
⸻
2. Technical Breakdown
Daily (D1)
• Still in a clear corrective phase after failing to hold 4,100–4,140 resistance.
• Price now hovering above the 100-day EMA at 3,842, which acts as medium-term support.
• RSI at 47 – neutral but with downside pressure.
Bias: Bearish while below 3,996; looking for retracement sell setups.
⸻
1H Chart (H1)
• Price rejected from descending trendline near 3,970–3,980.
• Currently consolidating near 3,950, with structure forming a wedge under the 50EMA and 200EMA.
• MACD histogram turning flat, RSI recovering from 27 → 45 range.
Bias: Neutral-to-bearish; a rebound toward 3,970 may offer short opportunities.
⸻
15M Chart (M15)
• Micro bullish correction from 3,886 → 3,960, now forming lower highs.
• Momentum fading near 200EMA (3,955–3,960).
• RSI oscillating around 50; MACD decreasing – indicating loss of short-term momentum.
View: Expect a liquidity sweep into 3,970–3,985, then potential sell reaction.
⸻
5M Chart (M5)
• Tight consolidation between 3,948–3,960; lower timeframe CHoCH visible.
• EMA stack is compressing, hinting at volatility buildup.
• A clean break below 3,945 could trigger a new push to 3,920/3,900.
Short-Term View: Scalpers may watch for fake-out above 3,960 or breakout below 3,945.
⸻
3. Fibonacci Analysis (Last Swing: 4,019 → 3,886)
• 38.2% = 3,936
• 50% = 3,952
• 61.8% = 3,967
✅ Golden Zone = 3,952 – 3,967 → current price zone (high confluence).
⸻
4. High-Probability Trade Scenarios
🟥 Bearish Continuation (Primary Bias)
• Sell Zone: 3,952 – 3,970 (Fibonacci + 15M EMA confluence)
• Trigger: Bearish engulfing or 5M structure break below 3,945
• 🎯 Targets: 3,925 → 3,905 → 3,886 → 3,860
• 🛑 SL: Above 3,975–3,980
⸻
🟩 Bullish Reversal (Countertrend)
• Buy Zone: 3,910 – 3,920 (intraday demand)
• Trigger: Clear 5M CHoCH + bullish engulfing
• 🎯 Targets: 3,940 → 3,955 → 3,970
• 🛑 SL: Below 3,900
⸻
5. Fundamental Watch
• Asia session quiet — focus remains on USD and US yields after yesterday’s strong data.
• DXY remains elevated near 106.20 → limits upside on gold.
• Traders should anticipate low volatility early, followed by possible retracement during London buildup.
⸻
6. Key Technical Levels
Type Levels (USD)
Resistance 3,952 / 3,970 / 3,985 / 3,996
Support 3,930 / 3,910 / 3,886 / 3,860
Golden Zone 3,952 – 3,967
Break Sell Trigger <3,945
Reversal Trigger >3,970
⸻
7. Analyst Summary
Gold remains trapped below major EMA resistance and inside a corrective wedge.
The Golden Zone (3,952–3,967) aligns perfectly for fresh sell entries if momentum confirms.
Unless bulls reclaim 3,980+, the probability favors continuation toward 3,910 → 3,886.
Preferred Strategy:
Sell retracement from 3,952–3,970 (with confirmation).
If price breaks 3,945 → sell continuation.
Avoid buys unless 3,970 breaks and holds.
⸻
8. Final Bias Summary
Primary Bias: Bearish
Secondary Bias: Countertrend buy only from 3,910 support
High-Probability Zone: 3,952 – 3,967
Breakout Confirmation: Sell below 3,945
Invalidation: Above 3,980
⸻
🥇 ElDoradoFx PREMIUM 3.0 – PERFORMANCE 28/10/2025 💸
📊 Precision entries. Consistent gains.
━━━━━━━━━━━━━━━
🟢 BUY LIMIT +45 PIPS
🟢 BUY +80 PIPS
🟢 BUY +30 PIPS
🟢 BUY +90 PIPS
🟢 BUY +110 PIPS
🔻 SELL +60 PIPS
🟢 BUY +110 PIPS
📱 BTC BUY +600 PIPS
━━━━━━━━━━━━━━━
🏆 GOLD TOTAL: +525 PIPS
🪙 BTCUSD BONUS: +600 PIPS
💰 TOTAL DAILY PROFIT: +1,125 PIPS
📊 8 Signals → 8 Wins | 0 SL
🎯 Accuracy: 100% ✅
━━━━━━━━━━━━━━━
🔥 Flawless day! Every setup hit target with precision — GOLD and BTC both in perfect sync.
👏 Congratulations if you profited! ✅✅✅🚀🚀🚀

GOLD H1 OUTLOOKH1 Gold Looking Bearish Structure
Selling First Zone Of FVG
Sllibg Second Zone Of CISD
Target Old Low / Sell Side Liquidity
Stay Tuned Boost The Post And Follow Us

“Gold Rebounds from Demand Zone — Short-Term Recovery Ahead”Analysis:
Gold (XAU/USD) on the 4-hour chart shows a strong corrective decline after forming an SMC trap near the 4,250–4,300 zone, where liquidity was swept before a sharp selloff. Price has now reached the High Probability POI (Point of Interest) around the 3,850–3,880 region, showing early signs of a bullish reaction.
The recent candle structure indicates buyers are stepping in from this demand zone, confirming a potential short-term reversal. If momentum sustains, the first target zone lies around 3,950–3,980, aligning with minor resistance and previous imbalance fill.
Outlook:
📈 Bias: Bullish correction (short-term)
🧭 Key Support: 3,850 – 3,880
🎯 Target: 3,950 – 3,980
⚠️ Invalidation: Break below 3,840 may reopen bearish continuation toward 3,780

Gold Faces Wave 5 Danger: Prepare for a Sharp Drop AheadAt yesterday’s opening, gold dropped sharply, breaking the bullish structure. Today, the decline continued, and the gap near 3887 was successfully filled before the price rebounded toward the 3975 resistance area. The strong resistance remains around 4000–4018.
On the daily chart, the trend remains downward, with support at 3963 already broken. Although the price is now recovering, upside resistance remains dense. From a structural perspective, the movement now aligns with a five-wave decline pattern, and the market appears to be in wave 4’s rebound phase. Therefore, it’s crucial to monitor the resistance area closely — if the price fails to break and hold above it, be prepared for the onset of wave 5, which could drive prices down to around 3800.
On the weekly chart, there is potential support near 3834, but keep in mind that wave 5 declines are often stronger and faster than wave 3, meaning this support could be broken.
In summary, trade cautiously and make account safety your top priority.

28/10/68 : XAUUSD ( US Session )Using it from US Session until 11.00AM , I'll new analysis and update at 12.00PM
Resistance
3947-3953
3936-3942
3930
Support
3918
3907-3912
3896-3901

#XAUUSD: +6000 Pips Swing Move In Making, Patience Pays!
Gold prices have fallen sharply as the DXY has regained strength. Following the recent significant sell-off, we can anticipate the potential direction of the price. Three key targets can be considered if the price moves in our favour. The first is a nearby target at $4000 which would represent a gain of 1100 pips. Subsequent targets should be determined according to your trading plan.
There are two potential entry points; if the first is invalidated the second should be considered.
We wish you the best of luck and trade safely.
Team Setupsfx 🚀❤️

Gold Trade Set Up Oct 28Gold has is trade well below PDL so im still bearish. I want to see price sweep internal SSL, to then sweep BSL before selling down to external SSL and 4h demand

GOLD (Xauusd) is going DOWN! great sell tradeAs you can see GOLD - Xauusd is in a clear downtrend. The red lines drawn show a downward channel which indicate that GOLD is now moving to the downside... Secondly, Gold has broken a powerful support level (the upper green line)! It is now very likely to head down to the lower green line (next support level). Great time to sell!

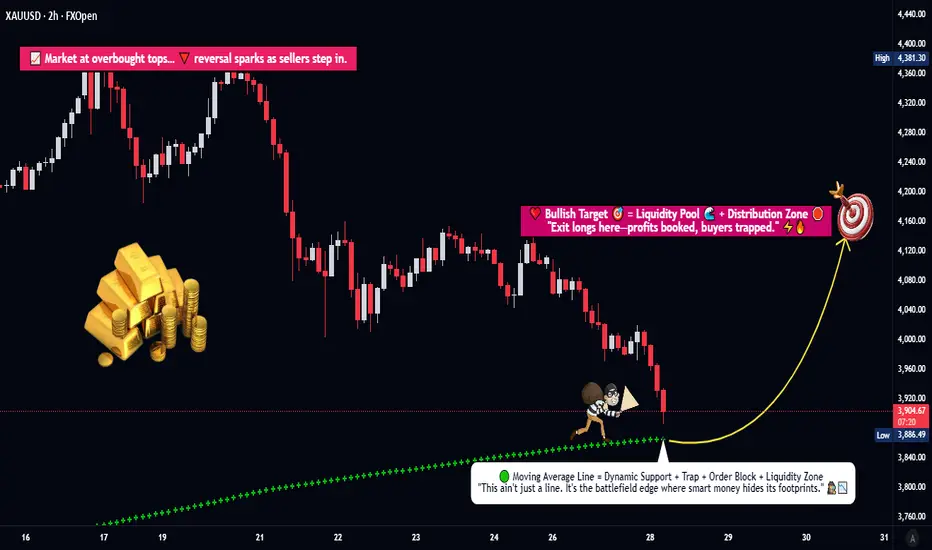
Is This the Start of Gold’s Next Major Upswing?🦸♂️ Title: XAU/USD Heist: The Golden Pullback Play (Swing/Day Trade) 💰
📈 Executive Brief (The "Why")
The shiny rock is pulling back to a key support zone! We're looking for a potential bullish continuation swing. The plan is to catch the dip as it retests a dynamic support level, aiming for a ride back up to a major resistance area. This is a classic "buy the dip" setup in a structurally strong asset.
🎯 The Trade Plan (The "How")
Asset: XAU/USD (Gold)
Bias: Bullish
Strategy: Pending Order on a Pullback
📍 Entry Zone:
YOU CAN ENTER THE MARKET AT ANY PRICE LEVEL AFTER THE WEIGHTED MOVING AVERAGE PULLBACK @ ~3860.00
(Look for a bullish rejection candle or momentum shift confirming the bounce)
🚨 Stop Loss (The "Escape Route"):
This is thief SL @ ~3760.00
Place your SL after the breakout I mentioned price level. This level is below the recent swing low, invalidating the bullish structure if breached.
🎯 Take Profit (The "Cash Out"):
OUR target @ ~4150.00
This aligns with a strong resistance + overbought + trap is there so kindly escape with profits. We're taking profits before price potentially reverses.
⚖️ Risk & Reward Management (The Fine Print)
Note to the Thief OGs: Dear Ladies & Gentleman, I am not recommending to set only my SL & TP. It's your own choice. You can make money, then take money at your own risk. Manage your position size accordingly! The provided levels are a framework, not a financial command.
🌍 Related Pairs to Watch (The Intel)
TVC:DXY (U.S. Dollar Index): Gold's arch-nemesis! 👊 A weaker DXY often means a stronger Gold price. Watch this for correlation cues.
$EUR/USD: The biggest component of the DXY. A strong Euro often pressures the Dollar, which can boost Gold.
$XAG/USD (Silver): Gold's volatile cousin. Often moves in the same direction but with more amplitude.
AMEX:GLD / AMEX:IAU : Gold ETF proxies; they track the physical metal's price.
Key Correlation Point: Gold is typically inversely correlated with the U.S. Dollar. Keep one eye on the Dollar Index for confirmation of your Gold trade's direction.
✨ Community Boost
“If you find value in my analysis, a 👍 and 🚀 boost is much appreciated — it helps me share more setups with the community!”
#Gold #XAUUSD #Trading #SwingTrading #TechnicalAnalysis #Finance #Pullback #WMA #DXY #Forex
ElDoradoFx PREMIUM – GOLD ANALYSIS (28/10/2025, LONDON SESSIONGold extended its bearish continuation during Asia, breaking below 3,940, confirming dominance of sellers. London opens with price sitting near 3,935–3,940, still within the bearish structure that began at 4,106.
Momentum is strongly negative, with EMAs (50/100/200) aligned downward and RSI below 40 across all intraday frames. The market remains inside a descending channel — each recovery is being sold aggressively.
⸻
2️⃣ Technical Breakdown
🔹 Daily (D1)
• Fourth consecutive bearish candle confirms strong downside momentum.
• RSI (46) still neutral but leaning bearish; MACD histogram fully red.
• Price approaching potential higher-timeframe support near 3,900–3,880.
Bias: Bearish correction still in play until 3,880 or D1 reversal candle appears.
🔸 H1
• Structure: clean lower highs (4,106 → 4,048 → 3,997) and lower lows (3,971 → 3,935).
• RSI (27) deeply oversold, signaling possible micro bounce but no reversal yet.
• 100/200 EMA above at 3,990–4,040 acting as strong resistance.
Bias: Bearish below 4,000, corrective pullback likely capped at 3,995–4,010.
🔹 M15
• Extended downtrend channel remains active.
• Every minor pullback rejected under 3,950–3,960.
• MACD shows no bullish divergence yet; sellers still in control.
Bias: Sell pullbacks near resistance levels.
🔹 M5
• Micro CHoCH confirmed lower highs.
• RSI near 30 with weak attempt to rebound.
• Short-term liquidity zone forming 3,930–3,940, potential area for retest before continuation.
Bias: Bearish to neutral; short rallies only if confirmed rejection on M5–M15.
⸻
3️⃣ Fibonacci Analysis (Golden Zone)
Last H1 swing: High 4,106 → Low 3,935
• 🔸 38.2% → 3,990
• 🔸 50% → 4,009
• 🔸 61.8% → 4,028
✅ Golden Zone = 3,990 – 4,028
This zone aligns with the H1 supply area and EMA confluence, making it the optimal retracement level to rejoin the bearish trend.
⸻
4️⃣ High-Probability Trade Scenarios
📉 SELL SCENARIO (High Probability)
• Entry: 3,990 – 4,028 (Golden Zone)
• Stop-Loss: 4,035 – 4,045
• Targets: 3,955 → 3,935 → 3,910 → 3,885
• Confluence: EMA cluster, Fib 61.8%, trendline resistance
• Bias: Strong short continuation if rejection occurs inside Golden Zone
⸻
⚡ BREAKDOWN SELL
• Trigger: Clean H1 candle close below 3,930
• Entry: 3,928 – 3,935 on retest
• Stop-Loss: Above 3,945
• Targets: 3,912 → 3,900 → 3,885
• Bias: Follows continuation of bearish momentum below weak low.
⸻
🟢 COUNTERTREND BUY (Low Probability)
• Trigger: Bullish BOS + strong engulfing candle above 3,960
• Entry: 3,960 – 3,965
• Stop-Loss: 3,940
• Targets: 3,985 → 3,995 → 4,009
• Bias: Only if London forms a liquidity sweep under 3,930 with strong reclaim.
⸻
5️⃣ Fundamental Watch
• No major Asia data; London expected to move with USD Index (DXY) flows.
• DXY above 106 favors continued gold weakness.
• Traders monitoring US GDP & PCE later this week, meaning liquidity could tighten today.
• Expect volatility spikes near London–NY overlap as large players position early.
⸻
6️⃣ Key Technical Levels
Type Price Levels
Resistance 3,960 / 3,975 / 3,990 / 4,009 / 4,028
Support 3,935 / 3,924 / 3,910 / 3,885 / 3,872
Golden Zone 3,990 – 4,028
Breakdown Trigger < 3,930
Bullish Reclaim Trigger > 3,965
⸻
7️⃣ Analyst Summary
The bearish structure remains dominant across all timeframes. Momentum favors continuation toward 3,910–3,885, with the best entry region at 3,990–4,028 Golden Zone.
If London opens with liquidity sweeps below 3,930, wait for a quick retracement to sell at premium pricing.
Only strong reclaim above 3,965 could trigger a short-term intraday recovery to 3,990–4,009 before sellers step in again.
⸻
8️⃣ Final Bias Summary
📉 Primary Bias: Bearish – Sell rallies into 3,990–4,028
📈 Secondary Bias: Bullish only above 3,965 (confirmed reclaim)
🎯 Targets: 3,955 → 3,935 → 3,910 → 3,885
✨ Golden Zone: 3,990 – 4,028
🛑 Invalidation: H1 close above 4,045
⸻
— ElDoradoFx PREMIUM 2.0 Team 🚀
⸻

GOLD (XAU/USD): SHORT SETUP — RIDING THE FINAL BEAR LEG!1. MACRO VIEW: THE FED STALEMATE
The Gold market is being pulled in opposing directions:
Bearish Pull (USD Strength): Positive news on the US-China trade deal reduces safe-haven demand.
Bullish Push (Gold Support): Near-certainty of a 25bps Fed rate cut on Wednesday weakens the USD. Plus, escalating US-Russia geopolitical tension maintains risk appetite for Gold.
Bottom Line: While a weaker USD supports Gold, Technical Analysis suggests a deeper correction must complete first.
2. TECHNICALS: STRUCTURE IS DECIDEDLY BEARISH
Trend Shift: After a strong rally, Gold has broken major support structure, confirming a Bearish Shift in the short-term trend.
Scenario: We anticipate a technical pullback (Pullback) to retest the new resistance level. Once the retest is complete, selling pressure should resume to finish the corrective move.
3. 💡 TRADE STRATEGY (THE SHORT)
We are primarily SELLING (SHORT), positioning for the completion of the corrective cycle:
Ideal Entry Zone (Entry): 3,949.849 (Retesting the broken prior Support, now Resistance)
Take Profit (TP1): 3,929.793
Take Profit (TP2): 3,878.287 – 3,811.333 (Major Demand Zone Target)
Stop Loss (SL): Above 3,949.849 (Above Confirmed Resistance)
⚠️ Warning: Wednesday’s FED rate decision will cause extreme volatility. Risk management is paramount!
Where do you think this final drop will bottom out? Let me know below! 👇
#Gold #XAUUSD #FOMC #TradePlan

Gold Price Outlook – Trade Setup (XAU/USD)📊 Technical Structure
OANDA:XAUUSD Gold (XAU/USD) continues to trade under bearish pressure, dropping to the $3,980–3,940 range, marking its lowest in three weeks. The chart highlights:
Resistance Zone: $3,975 – $3,981 (aligns with a descending trendline).
Support Zone: $3,936 – $3,943, with $3,930 as key downside level.
Price action shows lower highs, suggesting sustained bearish momentum. A corrective bounce into the resistance zone could be met with fresh selling interest.
📌 Trade Setup
Entry: $3,975 – $3,981 (near resistance & trendline)
Stop Loss: $3,986
Take Profit 1: $3,945
Take Profit 2: $3,936
Risk/Reward: ≈ 1 : 3.72
🌍 Macro Background
Gold’s decline is largely driven by renewed US–China trade optimism, which has reduced safe-haven demand. As reported, officials from both sides agreed on a trade deal framework ahead of Trump–Xi talks this week, pressuring gold prices despite weaker USD and dovish Fed expectations. Meanwhile, traders remain cautious ahead of the FOMC meeting (Oct 28–29), where markets have priced in a 96% chance of a 25 bps Fed rate cut.
Adding to the downside pressure, the People’s Bank of China (PBoC) paused gold purchases, while China’s imports fell 17.6% in September, further reducing demand support. However, US Treasury yields remain soft, and JPMorgan projects long-term bullish momentum for gold, forecasting an average $5,055/oz in Q4 2026.
🔑 Key Technical Levels
Resistance: $3,975 / $3,981
Support: $3,943 / $3,936
Breakdown Target: $3,900
📋 Trade Summary
Gold remains under pressure, trading below $4,000 with bearish momentum intact. Short-term rallies toward resistance offer opportunities to sell, targeting the $3,930–3,940 support zone. Market focus shifts to the FOMC decision and US–China talks, which could define gold’s next breakout direction.
⚠️ Disclaimer
This analysis is for reference only and does not constitute trading advice. Trading involves significant risk, and proper risk management is essential.

XAUUSD Crashes 1500 Pips — Key Supports Gone!Gold started the week poorly, dropping around 1500 pips and, more importantly, breaking three key support levels:
• the rising trendline that started back in August,
• the 4020 horizontal support zone,
• and even the psychological 4000 level.
Overnight, the price attempted to reclaim 4000, but failed — currently trading around 3965.
The next immediate support sits at 3945, and even if we see a rebound from here, bulls will need to hold the price firmly above 4000 to have any chance of a reversal.
If this level also fails, the next obvious medium-term target is the 3720–3750 zone.
I m bearish for now, but there isn’t a clean or logical entry point at the current levels — I will wait until a clearer setup forms.

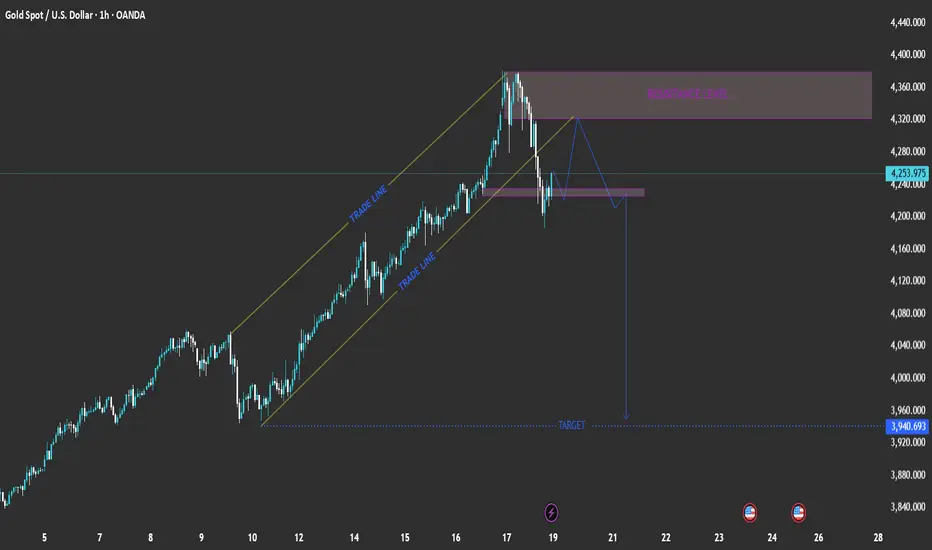
XAU/USD: Channel Breakout → Retest → Downside Target at 3,940EURONEXT:FTI1! EURONEXT:FTI1! EURONEXT:VU8F2026 EURONEXT:VM81! EURONEXT:VV6X2025 EURONEXT:V26X2025 EURONEXT:NS8Z2025 EURONEXT:YG8F2026 Pair: Gold Spot (XAU/USD)
Timeframe: 1-hour
Current Price: 4,253.975
Trend: Recently broke out of an ascending channel (bearish signal)
📉 Chart Breakdown
1. Ascending Channel (Trade Lines)
Price was moving steadily inside a rising channel, indicated by the two parallel yellow “TRADE LINE” levels.
The break below the lower trade line suggests weakening bullish momentum and potential trend reversal.
2. Resistance Level (4,320 – 4,360 zone)
Marked in purple, this zone served as a key resistance.
Price rejected strongly from this area, confirming seller presence.
3. Structure Retest and Potential Move
After the channel break, price retraced back to retest the broken channel support (now resistance).
The projected blue path shows a lower-high formation followed by a new drop, completing a bearish continuation pattern.
4. Target Zone
The projected target is near 3,940.693, aligning with previous structure support.
This level could serve as a profit-taking area for short positions.
📊 Summary of Key Levels
Zone Type Range / Level
4,320 – 4,360 Resistance Strong supply zone
4,220 – 4,240 Retest zone Potential short entry area
3,940 Target Bearish target / demand zone
⚙️ Trading Plan Concept (Hypothetical)
Bias: Bearish
Entry Idea: Wait for rejection from 4,220–4,240 zone.
Stop Loss: Above 4,280 (resistance)
Take Profit: Around 3,940 (target)
Risk/Reward: Approximately 1:3 or better
🧭 Conclusion
The chart suggests that Gold (XAU/USD) might be entering a corrective bearish phase after failing to sustain its bullish channel. A retest of broken structure before another drop aligns with typical market structure behavior.
Gold Bullish Reversal Expected from D-FVG ZoneKey Observations and SMC Components:
D-FVG (Daily Fair Value Gap):
The most important element is the large shaded gray box at the bottom, labeled D-FVG. This indicates an Inefficiency or Fair Value Gap identified on the Daily timeframe, making it a powerful area of demand where institutional buying pressure is expected.
CRT-L and CRT-H:
CRT-L (Current Range Low/Bottom) is placed near the bottom of the D-FVG zone, marking a key support level.
CRT-H (Current Range Top/High) marks the high of the recent drop.
Current Price Action:
The price is currently at $3,974.61 and has been trending down. It is approaching the key support/demand zone (D-FVG).
Projected Move:
The curved line and green arrow indicate the anticipated price action: a continuation of the drop into the D-FVG zone, followed by a strong rejection and a reversal upwards (a rally).
The rally's TARGET is marked by a dotted line, sitting below the CRT-H level (around $4,020 - $4,030).
Trading Bias and Expectation
The overall bias is short-term bullish following the retracement. The analyst expects price to:
Retrace/Consolidate: Drop into the high-probability D-FVG demand zone (around $3,920 to $3,940).
Reverse and Rally: Find strong support in this zone, then reverse and move upwards to hit the intermediate TARGET.

Today's gold trading strategy1.Expectation of loose policy or "fulfillment leads to disappointment": The market's expectation for the Federal Reserve to cut interest rates by 25 basis points in October has largely been absorbed, and there is even an overly optimistic situation. Recently, the retail sales data released in the United States exceeded expectations, indicating that the consumption sector still has resilience. Some Federal Reserve officials also stated that "we need to be cautious of the rapidity of rate cuts triggering an inflation rebound", and it is not ruled out that a signal of "a slower pace of subsequent rate cuts" will be released at the meeting. If the expectation of loose policy is lower than expected, the funds that entered the market due to the expectation of rate cuts may concentrate on exiting, directly suppressing the gold price.
2. Geopolitical risks show signs of easing: A temporary ceasefire has been reached in the Gaza Strip, with both sides beginning to exchange hostages, and the ceasefire period may be extended. The tension in the Middle East has significantly decreased. Although the conflict between Russia and Ukraine has not been resolved, no new major escalation events have occurred recently. Market attention to geopolitical risks has decreased, and the demand for gold as a safe haven has naturally weakened, causing the key factors supporting the gold price to loosen.
Today's gold trading strategy
sell 4000-3990
TP:3980~3970
SL:4010

ElDoradoFx PREMIUM – GOLD ANALYSIS (28/10/2025, ASIA SESSION)Gold closed the US session around 3,982 after extending its sell-off from 4,048, confirming strong bearish continuation from the 4,38x top. The current structure remains heavy, with the H1 100/200 EMA acting as dynamic resistance and repeated rejections near 3,997–4,002.
Momentum indicators across intraday timeframes still favor sellers, but Asia may open with a brief corrective retracement before the next bearish leg toward 3,958–3,945 liquidity zones.
⸻
2️⃣ Technical Breakdown
🔹 Daily (D1)
• Third consecutive bearish daily candle confirming continuation of the mid-term correction.
• Price now trades around 3,982, testing the mid-range zone between 3,880–4,020.
• RSI slipping near 50, signaling room for more downside before oversold conditions.
• MACD histogram remains negative but moderating — corrective phase within broader uptrend.
🧭 Bias: Bearish continuation inside medium-term correction; key support 3,880.
⸻
🔸 1H Chart (H1)
• Structure: Clear lower highs from 4,12x → 4,072 → 4,048 → 3,997.
• Strong break of structure below 3,985 → 3,971 confirms downtrend intact.
• Price remains below all EMAs and the descending trendline.
• RSI ~37 (slightly oversold); MACD momentum still negative.
📉 Intraday Bias: Bearish below 4,021; corrective only if price reclaims that level.
⸻
🔹 15M Chart (M15)
• Descending channel clearly defined; price rejected twice near 3,997–4,002.
• Pullbacks shallow, suggesting weak buyer interest.
• MACD histogram fading after short correction — selling pressure resuming.
⚠️ Short-term Bias: Sell rallies until clean BOS above 4,021.
⸻
🔹 5M Chart (M5)
• Micro downtrend confirmed with CHoCH back to the downside at 3,996.
• Price consolidating near 3,982, forming minor liquidity base pre-Asia open.
• RSI ~36; momentum weak but potential short-term rebound toward 4,000 before next drop.
🔎 Micro Bias: Intraday pullback expected; structure favors new lower high formation near 4,009–4,021.
⸻
3️⃣ Fibonacci Analysis – Golden Zone
Last H1 swing: High 4,048 → Low 3,971
• 38.2% → 3,998
• 50% → 4,009
• 61.8% → 4,021 ✅
✨ Golden Zone = 4,009 – 4,021
This zone aligns with the descending trendline, the H1 EMA cluster, and prior supply rejection — making it the highest-probability short area for continuation.
⸻
4️⃣ High-Probability Trade Scenarios
🟢 Bearish Continuation Setup (Preferred Scenario)
✅ Sell Zone: 4,009 – 4,021 (Golden Zone)
🎯 Targets: 3,985 → 3,971 → 3,958 → 3,945
🛑 Stop-Loss: Above 4,028–4,032
📈 Reasoning: Structural alignment with EMAs, Fib confluence, and trendline resistance.
⸻
⚡ Momentum Breakdown Setup (Continuation Trade)
✅ Sell Trigger: Break & retest below 3,971
🎯 Targets: 3,958 → 3,945 → 3,930 → 3,920
🛑 Stop-Loss: Back above 3,985
📈 Reasoning: Structural breakdown confirmation and liquidity grab continuation.
⸻
⚪ Countertrend Buy Setup (Low Probability)
✅ Buy Trigger: Clean 15M BOS + retest above 4,021
🎯 Targets: 4,034 → 4,048 → 4,072
🛑 Stop-Loss: Below 4,009
📈 Reasoning: Short-term recovery if DXY weakens or liquidity imbalance above 4,02x forms.
⸻
5️⃣ Fundamental Watch
• Asia session quiet: no tier-1 data expected.
• Focus remains on USD index drift and post-US yield sentiment.
• If DXY holds firm above 106, gold downside pressure persists.
• Watch early Shanghai open flows — potential liquidity sweep near 3,971 before NY continuation.
⸻
6️⃣ Key Technical Levels
Type Levels
Resistance 3,997 / 4,009 / 4,021 / 4,034 / 4,048
Support 3,985 / 3,971 / 3,958 / 3,945 / 3,930
Golden Zone 4,009 – 4,021
Break Sell Trigger < 3,971
Break Buy Trigger > 4,021
⸻
7️⃣ Analyst Summary
The market remains structurally bearish across all intraday frames, with strong EMA alignment and trendline rejection confirming continuation bias. Asia session likely sees a corrective bounce into the 4,009–4,021 Golden Zone, where the best-quality short setups align.
Only if buyers reclaim and hold above 4,021 will momentum shift for a potential relief rally toward 4,048/4,072. Otherwise, expect renewed pressure targeting 3,971 → 3,958 → 3,945.
⸻
8️⃣ Final Bias Summary
📉 Primary Bias: Bearish → Sell rallies into 4,009–4,021
📈 Secondary Bias: Bullish only above 4,021 (retested hold)
🎯 Targets: 3,985 → 3,971 → 3,958
✨ Golden Zone: 4,009 – 4,021
🛑 Invalidation: H1 close above 4,032
⸻
🥇 ElDoradoFx PREMIUM 2.0 – PERFORMANCE 27/10/2025 🥇
📅 Smart setups. Steady profits.
━━━━━━━━━━━━━━━
🔻 SELL +220 PIPS
🟢 BUY +145 PIPS
❌ BUY -60 PIPS (SL)
🔻 SELL +210 PIPS
━━━━━━━━━━━━━━━
💰 GOLD TOTAL PIPS WON: +515 PIPS
📊 4 Trades → 3 Wins | 1 SL
🎯 Accuracy: 75%
━━━━━━━━━━━━━━━
🔥 Solid and precise session — trend moves respected technical zones perfectly.
👏 Congratulations if you profited! ✅✅✅🚀🚀🚀

15 minute structure updateThe sellers' target for this time frame has been touched.
In the meantime, the 4051 liquidity level has been built, which will be a return to the liquidity hunt and a pullback to the specified support areas, which will be the selling position for lower targets and liquidity. In the 1-hour time frame, the current bottom has sellers' liquidity, so the sellers will return the price to this bottom.
Analysis link:

XAU/USD DOUBLE TOP FORMATION BEARISH MOVE TARGETTING SUPPORT🧩 Key Observations:
1. Double Top Formation
Two clear peaks around 4160–4180 zone (marked circles).
This confirms strong resistance and a potential reversal zone.
2. Trendline Resistance
A descending trendline from previous highs keeps price suppressed.
Every retest of this line has led to rejection — confirming bearish control.
3. Bearish Structure
Lower highs and lower lows clearly visible → consistent with downtrend.
Recent pullback appears corrective before another potential drop.
4. Projected Move (Arrow Path)
The arrow suggests a short-term retracement to ~4120–4150 zone (trendline + resistance confluence).
Then, a continuation down toward the target zone near 3968–3980.
5. Support & Target Levels
Immediate Support: 4040–4050
Main Target: 3968–3980 (shown on chart)
Major Resistance: 4160–4180

Gold Pullback or Reversal? Key Zone Ahead!As I expected , Gold ( OANDA:XAUUSD ) started to drop thanks to the Double Top Pattern and reached its target at the Support zone($4,011 – $3,981) .
Now, do you think Gold will start dropping again, or will it resume its recent weeks’ uptrend?
Today, I’m going to do a short-term 15-minute analysis of Gold , so stay tuned.
At the moment, Gold is approaching a Resistance zone($4,192 – $4,137) —also a Potential Reversal Zone (PRZ) —and moving within an ascending channel . Overall, the recent moves in Gold over the past couple of days look like a pullback to the previous Support zone($4,192 – $4,137) .
From an Elliott Wave perspective , it seems that Gold , given the momentum of its recent drop, is completing corrective waves, and we should expect another decline .
I expect Gold to start dropping again from the Resistance zone($4,192 – $4,137) and PRZ , and AFTER breaking the lower line of the ascending channel , it could fall at least down to around $4,039(First Target) .
Second Target: Support zone($4,011 – $3,981)
Stop Loss(SL): $4,222
Please respect each other's ideas and express them politely if you agree or disagree.
Gold Analyze (XAUUSD), 15-minute time frame.
Be sure to follow the updated ideas.
Do not forget to put a Stop loss for your positions (For every position you want to open).
Please follow your strategy; this is just my idea, and I will gladly see your ideas in this post.
Please do not forget the ✅ ' like ' ✅ button 🙏😊 & Share it with your friends; thanks, and Trade safe.

GOLD aka XAUUSD is heading to the downside!!Last week XAUUSD (Gold) had a very bearish week! It ended its bullish streak of years and declined to the downside. It only recently broke a very strong support zone (the green trendline) and struggled to break above the resistance zone (red trendline). It should drop all the way down further all the way to the 3833 level.
