Gold
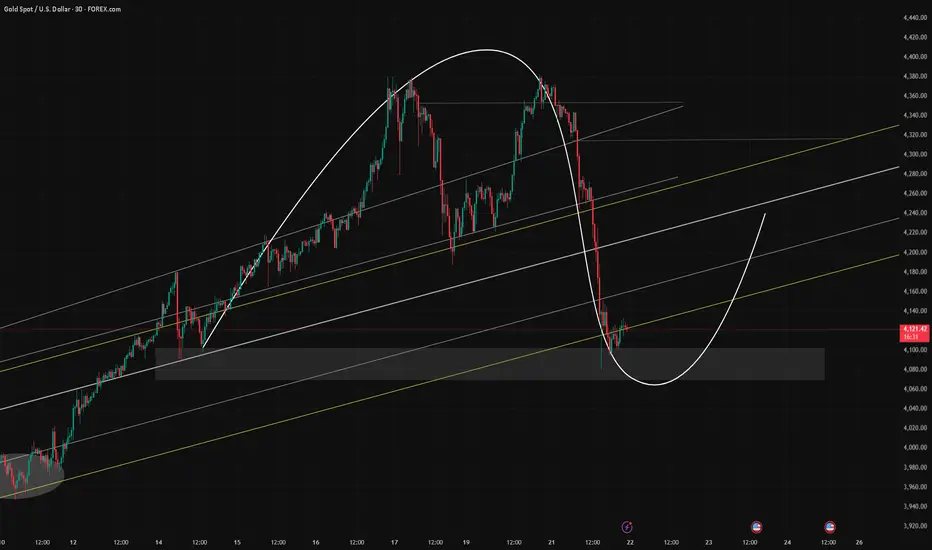
After a strong bullish move, I was expecting a correction.
Now the price has entered the correction phase, and I’m waiting at the marked level on the chart to take a long position if a proper signal appears ✅
Xauusdsignal

Gold: The M-top pattern indicates a downward risk📈Gold’s situation today is quite complex, marked by sharp volatility. Looking at the price trend, after a rare steep drop the previous night, the Gold continued to slide following today’s opening, touching a low of 4004.5. It then staged a short-term rebound of over $100, fluctuating around 4100 and peaking at 4161.It then continued to decline.
📝In terms of influencing factors:
The cooling of safe-haven sentiment is one of the key reasons for Gold’s decline. Europe’s support for Russia-Ukraine ceasefire negotiations, the expected resolution of the U.S. government shutdown crisis, and the easing of Sino-U.S. trade tensions have all led to a significant drop in market demand for safe-haven assets.
📈Gold had risen too sharply in the earlier stage, fueling strong sentiment among investors to take profits at high levels. A large number of sell orders pushed its price down sharply.
Additionally, the strengthening of the U.S. dollar during the day has also exerted certain pressure on gold prices.
📝From a technical perspective:
The Gold closed with a long bearish candlestick on the daily chart, accompanied by a simple M-top formation. This indicates the risk of the market continuing to move downward. The upper resistance zone is between 4150 and 4180, the key lower support level is at the 4000 integer mark, and further downside support lies between 3900 and 3904.
💎Trading Strategy:
Buy 4075 - 4085
SL 4060
TP 4115 - 4125 - 4135
Sell 4150 - 4160
SL 4175
TP 4085 - 4100 - 4115
Daily-updated accurate signals are at your disposal. If you run into any problems while trading, these signals serve as a reliable reference—don’t hesitate to use them! I truly hope they bring you significant assistance

$4,381 WAS THE FAKE TOP? Gold -5.5%: MSS Confirms SELL!XAU/USD In-Depth Analysis: Historic Shock and Structure-Based Selling Opportunity!
1. Fundamental Shock Analysis
Gold's massive 5.5% plunge from its record high of $4,381 was a large-scale profit-taking action following a blistering 60% year-to-date rally. This move was fueled by:
USD Strength: The strengthening US Dollar reduced Gold's appeal.
Market Sentiment: A shift into Risk-On mode, diminishing safe-haven demand.
The Essence: This was a huge Liquidity Sweep, designed to wash out weaker hands before Gold decides its next major trend.
2. Technical Analysis (MSS & Execution)
The price structure has delivered a decisive message: The trend has changed!
MSS Confirmed (Market Structure Shift): The break of the bullish structure occurred at $4,254.549. This level is now a highly critical Supply Zone, acting as the "boundary" for the bears.
Demand Reaction: Gold is currently attempting to hold the Order Block (OB) at $4,077.
Preferred Strategy: SELL based on the confirmed MSS.
Optimal SELL Zone: Wait for a retracement back to the Supply Zone $4,254.549 (Ideal limit entry).
Target (TP): Successive targets are $4,008 (The psychological $4k mark) and the strong support area at $3,944 - $3,904.
Stop Loss (SL): Place above the high at $4,260 (Protecting the MSS point).
Conclusion: Don't be fooled by the bounce. $4,254.549 is the golden entry point for a short trade following the new market structure.
#GOLD #XAUUSD #MSS #Liquidity #SELLSignal #SmartMoneyConcept

ElDoradoFx PREMIUM – GOLD ANALYSIS (22/10/2025, LONDON SESSION)Gold (XAUUSD) is trading around 4,157, rebounding aggressively from the previous sell-off low near 4,004. Buyers have stepped in with conviction, reclaiming short-term structure and driving price back above key intraday levels. London opens with bullish momentum in play, but price is now approaching early resistance zones, where the next directional decision is likely to form.
⸻
🔍 Technical Outlook
Daily Chart (D1)
• Previous daily candle shows a strong lower wick recovery after heavy bearish liquidation.
• Price remains above both 20EMA and 50EMA, suggesting the broader bullish structure is still intact.
• RSI has cooled from overbought but now points upward, indicating renewed bullish pressure.
• MACD remains in positive territory, confirming long-term buyers are still active.
Bias: Bullish corrective rebound, awaiting confirmation for continuation.
⸻
1H Chart (H1)
• Clean bullish CHoCH formed after rejection from 4,004.
• Price is approaching dynamic resistance from 200 EMA (around 4,170).
• RSI at ~46–50, suggesting room for continuation before overbought conditions.
• If price breaks and holds above 4,170, next bullish leg may target 4,200–4,225 liquidity.
Intraday Bias: Bullish toward premium zones unless rejected at 4,170.
⸻
15M Chart (M15)
• Multiple higher lows after bounce confirm controlled bullish momentum.
• RSI around 60, reflecting moderate bullish strength.
• MACD expanding upward → intraday momentum supports continuation into resistance.
• Key minor resistance near 4,160–4,170 may trigger a pullback or consolidation.
Short-term View: In bullish leg, approaching decision zone.
⸻
5M Chart (M5)
• Structure is trending upward, with each dip being bought.
• MACD strongly bullish; histogram rising.
• Any pullback into 4,140–4,135 area may provide minor intraday buy reaction before a deeper decision.
⸻
✨ Fibonacci Golden Zone
Recent impulse leg: Low 4,004 → High 4,160 (current swing)
🔹 38.2% Fib = 4,115
🔹 50% Fib = 4,082
🔹 61.8% Fib = 4,050
✅ Golden Zone = 4,115–4,050, aligning with previous breakout structure and short-term EMA confluence.
➡ If price retraces to this zone and holds, bullish continuation setups may activate.
⸻
🎯 High Probability Scenarios
✅ Bullish Continuation Setup (Preferred if pullback holds)
📍 Buy Zone: 4,115–4,082 (Golden Zone reaction)
✅ Trigger: Bullish engulfing or strong rejection wick
🎯 Targets → 4,150 → 4,170 → 4,200 → 4,225
🛑 SL below 4,050
✅ Break & Retest Buy Setup (Aggressive Momentum Entry)
📍 Buy above 4,170 (Break of EMA confluence)
🎯 Targets → 4,200 → 4,225 → 4,254
🛑 SL below 4,150
⚠️ Bearish Correction Setup (If rejection occurs at premium zone)
📍 Sell if strong rejection at 4,170–4,200
🎯 Targets → 4,140 → 4,115 → 4,082
🛑 SL above 4,209
🔻 Sell Breakout (If bearish momentum resumes)
📍 Sell below 4,050 (Break & Retest)
🎯 Targets → 4,030 → 4,004 → 3,980
🛑 SL above 4,082
⸻
📅 Fundamental Outlook – London Session
• No major European data early session; price action driven by technical flows.
• Focus remains on US data later (unemployment, Fed sentiment).
• DXY cooling slightly after yesterday’s strength, offering support to gold pullback recovery.
• US yields remain elevated — could cap upside unless risk-off intensifies.
⸻
⚠️ Key Levels to Watch
Type Level Description
Resistance 4,170 H1 200 EMA / decision point
Resistance 4,200–4,225 Liquidity target zone
Resistance 4,254 Previous key supply
Support 4,140 Minor intraday support
Support 4,115–4,082 Fibonacci Golden Zone
Support 4,050 Final retracement line
⸻
✅ Summary
Gold is staging a strong recovery rally and remains bullish in early London momentum. A controlled retracement into the Golden Zone (4,115–4,082) would provide an ideal continuation buy opportunity toward 4,170–4,200–4,225. A confirmed break above 4,170 validates continued upside. A strong rejection at 4,170–4,200 may trigger a corrective dip back into the Fib zone.
Session Bias: Bullish, with continuation favored on dips.
Break Confirmation:
• ✅ Buy above 4,170
• ⚠️ Sell below 4,050
Golden Zone: 4,115 – 4,082 – 4,050
⸻
🥇 ElDoradoFx PREMIUM 2.0 – PERFORMANCE 21/10/2025 🥇
📊 GOLD TRADE RESULTS:
🔻 SELL +210 pips
🟢 BUY LIMIT +20 pips
❌ BUY –40 pips (SL)
🟢 BUY +70 pips
🟢 BUY +100 pips
🔻 SELL +210 pips
🟢 BUY +270 pips
---
💰 TOTAL GOLD PIPS WON: ✅ +840 pips
📈 RESULT: 7 Signals → 6 Wins | 1 SL
🎯 ACCURACY: 86%
---
🔥 Solid upward momentum and precision in reversals — swing continuation played out beautifully 📈💎
👏 Congratulations if you profited! ✅✅✅🚀🚀🚀

XAUUSD – Sharp 5% Drop as Traders Take Profit Ahead of US CPIMarket Context:
Gold (XAU/USD) slumped over 5.5% on Tuesday, marking its largest daily decline in months as traders took profits ahead of the upcoming US CPI data (October 24).
The US Dollar Index (DXY) rebounded 0.36% to 98.94, making gold more expensive for foreign buyers.
This correction also coincides with renewed optimism over potential easing of US–China trade tensions, after President Trump confirmed plans to meet Chinese leader Xi Jinping next week.
While this sharp move caught many traders off guard, it appears to be a healthy correction within a broader bullish structure, as investors remain cautious before major data and the upcoming Fed policy meeting next week.
Technical Outlook (M30):
After the heavy selloff from the 4,375 high, gold found near-term support around 4,003 – 4,010, forming a potential accumulation base.
The pair now trades near 4,150, showing early signs of recovery toward key confluence zones.
Key Technical Levels:
OBS Sell Zone: 4,338 – 4,340
CP Zone Down / OBS Sell Zone: 4,259 – 4,260
CP Zone Up / OBS Buy Zone: 4,092 – 4,094
Deep Buy Zone: 4,003 – 4,008
The current structure outlines a 5-wave projection, where price may complete Wave II near 4,092, then advance toward Wave III at 4,259, followed by a correction (Wave IV) and another push toward Wave V near 4,338.
Trading Plan:
🔹 BUY ZONE#1 (Short-Term Recovery)
Entry: 4,092 – 4,094
Stop Loss: 4,080
Take Profit: 4,145 → 4,259 → 4,338
🔹 BUY ZONE #2 (Liquidity Sweep Scenario)
Entry: 4,003 – 4,008
Stop Loss: 3,990
Take Profit: 4,090 → 4,259
🔹 SELL ZONE (Countertrend Reaction)
Entry: 4,259 – 4,260
Stop Loss: 4,272
Take Profit: 4,145 → 4,092
Summary:
The recent 5% correction is viewed as a profit-taking phase ahead of CPI data, not a structural breakdown.
Gold is expected to stabilise above 4,092, with buyers likely stepping in near the OBS Buy Zone.
Focus remains on 4,259 for a short-term reaction and 4,338 as the next potential liquidity target if momentum continues.
📊 What’s your view — is this just a healthy retracement before CPI, or the start of a deeper shift?
👉 Follow MMFLOW TRADING for daily institutional-grade setups and smart money structure updates.

XAUUSD Retracement bullish moveAfter a strong bearish impulse, XAUUSD found support around the lower boundary of the green Fibonacci-based volatility band (approx. $4,093–$4,100). Price shows a potential reversal candle forming just below the midline of the band, suggesting buying pressure.
🎯 Fibonacci Bullish Targets
Target 1 (0.382 Fib) → $4,158 – $4,160
First reaction zone, where price may test the underside of the blue band.
Target 2 (0.618 Fib) → $4,202 – $4,210
Key resistance area and equilibrium zone of the previous structure.
Target 3 (1.000 Fib / Full retracement) → $4,245 – $4,255
Strong supply zone near the upper red band; ideal swing target if momentum continues.

technical analysis for XAU/USD (Gold) based on your chart:Pair: Gold (XAU/USD)
Chart Summary
Current Price: Around $4,140
Trend Lines: A descending trade line shows the overall short-term bearish trend.
Support Zone: Clearly marked between $4,080 – $4,120 (“SUPPORT BUY ZONE”).
Target: The upside target is labeled near $4,383.
Technical Outlook
🔹 Support Zone Reaction
Price recently dipped into the support buy zone, forming a potential bullish reversal wick.
This area is acting as a strong demand zone, attracting buyers around $4,100.
🔹 Downtrend Channel
The pair remains under a downward-sloping trade line, suggesting the short-term market bias is still bearish.
However, a breakout above this trendline could trigger bullish continuation toward the $4,383 target.
🔹 Short-Term Scenario
Bullish Case (Primary Plan):
If gold holds above the support zone ($4,080–$4,120) and breaks the trendline resistance (~$4,200),
→ next target area: $4,300–$4,383.
Confirmation comes with a clear candle close above $4,200.
Bearish Case (Alternative Plan):
If price fails to break the descending trade line and drops below $4,080,
→ possible continuation toward $4,040 – $4,000.
Key Levels
Type Level (USD) Description
🎯 Target 4,383 Major resistance / profit zone
⚔️ Resistance 4,200 Descending trendline zone
🛒 Support Zone 4,080–4,120 Demand / Buy zone
❌ Invalid Below 4,080 Break below = bearish continuation
Summary
📈 Gold (XAU/USD) is currently retesting its support zone, showing early signs of a bullish rebound.
A confirmed breakout above the trendline could lead to a rally toward $4,380.
However, losing support below $4,080 would invalidate the bullish setup and reintroduce downside risk. EURONEXT:IE6X2025 EURONEXT:BE8Z2025 EURONEXT:BXF1! EURONEXT:CU6X2025 EURONEXT:KB6X2025 EURONEXT:PJ6X2025 EURONEXT:PJ8Z2025 EURONEXT:UM6X2025 EURONEXT:UM8Z2025 EURONEXT:AB6X2025 EURONEXT:AB7X2025

Gold Buy Long PostionA Gold (XAU/USD) Buy Long Position involves purchasing the XAU/USD pair with the expectation that the price of Gold (XAU) will rise relative to the US Dollar (USD) over time.1 This is a common strategy for position traders and swing traders.Gold Buy Long Position (XAU/USD) Short NoteCurrent XAU/USD Price ContextApproximate XAU/USD Price: The Gold price is highly dynamic, but recent market data shows it trading around the $4,150 - $4,250 per ounce range (as of the recent search results from October 2025). This price point is near historical highs, indicating a strong long-term bullish trend that is currently undergoing some short-term correction/consolidation.Strategy Summary for Long EntryFundamental Driver (Why Buy): Gold is typically bought as a safe-haven asset during times of economic or geopolitical uncertainty (e.g., wars, high inflation, recession fears).2 A sustained weakening of the US Dollar (USD) or a dovish outlook from the US Federal Reserve (Fed) (e.g., expected interest rate cuts) is also a strong bullish signal for XAU/USD.Technical Trigger (When to Buy):Support/Retracement: Look for the price to pull back to a key historical Support level or a major Fibonacci Retracement level (like 3$50\%$ or 4$61.8\%$) within an existing uptrend.5Confirmation: Enter the trade when a strong bullish candle (e.g., a Pin Bar or Bullish Engulfing) forms at that key support level, confirming buyer defense.Trend Following: Wait for a breakout above a recent minor resistance level (or consolidation range) to confirm the continuation of the main uptrend.6Risk Management:Stop-Loss (SL): Place the Stop-Loss below the confirmation support level or the most recent swing low to protect against an invalidation of the bullish structure.7Take-Profit (TP): Target the most recent swing high or use Fibonacci Extension levels to project higher targets.

Gold – 24 Hours of Chaos: From 4400 to 4000The last 24 hours in Gold trading were absolutely insane. After retesting the 4400 zone all-time high last night, XAUUSD literally collapsed, dropping straight to the 4000 zone in just one day — a 10% move that’s unheard of for gold (at least I haven't seen).
1️⃣ Technical Picture
Once the price broke back below 4200, it confirmed a double top formation, and the selloff accelerated dramatically toward its measured target around 4000 — a level also supported by the ascending trendline that started in late August.
2️⃣ Current Context
At the time of writing, gold already rebounded nearly 1300 pips from the low, which means there’s no attractive level to enter long right now, even though the recovery might continue in the short term.
3️⃣ Key Levels to Watch
• Resistance: 4200 zone – now turned into a major resistance. If the price revisits this level, I’ll be looking for short setups, ideally on intraday spikes.
• Support: 4000 zone – if the price dips again before testing resistance, it could offer long opportunities from this confluence area.
4️⃣ Trading Plan
In short, we’re in a wide range between 4000 and 4200, both levels offering potential trades but in opposite directions. For now, I’ll stay patient and wait for price to get closer to one of these extremes before taking action.
⚠️ Final Note
Volatility is off the charts, so if you decide to trade XAUUSD these days, adjust your stop losses and targets accordingly. This is not the time for tight stops, is time for patience, and flexibility. 🚀

Gold Price Outlook – Trade Setup (XAU/USD)📊 Technical Structure
Gold tumbled below $4,100, finding temporary support around $4,085–$4,093.
The chart shows a descending trendline, keeping short-term momentum bearish.
Immediate resistance lies at $4,142–$4,151, while the support zone is at $4,085–$4,093.
A break above the trendline could trigger a rebound toward resistance, but failure may open the door to deeper losses.
📌 Trade Setup
Entry: $4,093
Stop Loss: $4,080 (below support zone)
Take Profit: $4,150 (resistance retest)
Risk-to-Reward (R:R): ≈ 1 : 4.45
🌍 Macro Background
Gold is pressured by easing US-China trade tensions as both sides prepare for potential tariff negotiations ahead of November 1. This weakens safe-haven flows. At the same time, the steep profit-taking after a nine-week rally adds to selling pressure.
However, risks from the prolonged US government shutdown, concerns over global debt sustainability, and expectations of further Fed rate cuts (October and December) continue to support the medium-term bullish case for gold.
Markets now await US CPI data on Friday (YoY expected at 3.1%), which will be a crucial trigger for USD and gold direction.
🔑 Key Technical Levels
Resistance: $4,142 / $4,151
Support: $4,093 / $4,085
Upside Target (breakout): $4,150–$4,160
Downside Target (failure): $4,070 / $4,050
📋 Trade Summary
Gold faces strong downside momentum but holds above the $4,085 support zone. Short-term strategy favours a rebound trade on a breakout above the descending trendline, targeting $4,150. However, if support fails, the decline could accelerate toward $4,070–$4,050.
⚠️ Disclaimer
This analysis is for reference only and does not constitute trading advice. Trading involves significant risk, and proper risk management is essential.

A game for the brave. Please participate.Amidst the surging tides of the trend, every ship appears adept. But the true test isn't speed, but staying at sea. Survival is more important than success. Respect the market. Quaid hopes everyone can maintain a steady pace amidst volatility and reap their own wave of wealth.
Gold prices retreated after reaching a high of 4381 on Monday. Early analysis indicated a potential "double top" pattern.
Based on the previous daily fluctuations of around $100, initial expectations suggested a range-bound market fluctuation of 4381-4270. However, the actual trend far exceeded expectations. Prices plummeted from the 4381 high, triggering a sell-off, with the largest single-day drop reaching $300. This market action further demonstrates market uncertainty. Quaid advises everyone to maintain a cautious approach and strictly set stop-loss orders, whether long or short.
A sharp decline is always preceded by a rebound. Prices declined in early Asian trading, not incrementally. Irrational declines will eventually reverse. Don't be intimidated by the market at this time. Don't trade with a normal mindset. Position management is paramount. A 10-point stop-loss is completely unbearable right now, so reduce your position size to about one-third of your normal size.
When the market plummets or soars, you can open positions in batches to keep the total transaction loss within the controllable range of the account.
For short-term trading, you can enter short positions around 4130. I'll update specific trading strategies on the channel, so stay tuned.

Gold Market Nearing a Bottom — Trade with CautionAfter yesterday’s sharp decline, the market is likely entering a gradual bottoming phase. As I mentioned on Saturday, there are still unfilled gaps at 4019–4024 and 3887–3898. If the bears remain dominant, the 4019 gap could be filled, though a move toward 3887 seems less likely unless major negative news triggers it.
During any rebound, pay close attention to the 4200–4250 resistance area. If prices fail to stabilize there, the weekly chart pattern will weaken, increasing the risk of a drop toward the 3887 gap. Overall, trade with caution in the near term — the market is being influenced by multiple factors, leading to heightened volatility and risk. Being cautious never hurts.
While making profits is important, protecting your account comes first — otherwise, gains mean little. If you prefer fewer, safer trades, focus on the key price zones mentioned above and observe the market more than you act. For those continuing with short-term or scalping strategies, be sure to control your target prices strictly, especially now as the broader trend direction is still being established.
Of course, everyone has his or her own trading methods and theories. I will not comment too much here, but just share my own views. If you think it is useful, use it. If it is not useful, just watch the fun.
ElDoradoFx PREMIUM – GOLD ANALYSIS (22/10/2025, ASIA SESSION)Gold (XAUUSD) is currently trading around 4,125, attempting a minor recovery after a strong bearish breakdown during the US session. Price found near-term liquidity around 4,106–4,100, where a short-term bounce is unfolding. Despite this pullback attempt, the overall structure remains bearish unless key resistance levels are reclaimed.
⸻
🔍 Technical Outlook
Daily Chart (D1)
• Strong bearish candle formed after rejection from 4,381.
• Price still above 20EMA and well above 50EMA, confirming a corrective move within a broader bullish trend.
• RSI cooling from overbought; now around mid-level, room for either further correction or bounce.
• MACD still positive but histogram weakening, suggesting potential retracement or pause.
Bias: Corrective bearish inside macro bullish trend.
⸻
1H Chart (H1)
• Clear bearish shift with BOS confirmed below 4,254 and 4,229.
• Rejection from 20EMA and 50EMA above (4,170–4,249) confirms intraday bearish bias.
• RSI recovering from oversold (26→38) indicating a potential pullback leg.
• If gold climbs into 4,160–4,198 zone and rejects, bearish continuation likely.
Intraday Bias: Bearish until H1 closes above 4,200–4,210.
⸻
15M Chart (M15)
• Minor CHoCH formed after bounce at 4,106, with price entering a corrective channel.
• RSI around 55 → short-term recovery phase.
• MACD histogram green but still shallow → possible retracement only.
• Price approaching first resistance around 4,140–4,150.
Short-term View: Pullback phase inside bearish structure.
⸻
5M Chart (M5)
• Series of higher lows forming → bullish momentum attempt.
• MACD positive with expanding green bars.
• RSI above 55 suggests buyers in short control, but nearing resistance.
⸻
✨ Fibonacci Golden Zone
Recent impulse: High 4,254 → Low 4,106
🔹 38.2% Fib = 4,160
🔹 50% Fib = 4,180
🔹 61.8% Fib = 4,198
✅ Golden Zone: 4,160 – 4,198
This zone aligns with intraday EMA resistance and H1 supply, making it a key sell area if rejection occurs.
⸻
🎯 High Probability Scenarios
✅ Bearish Continuation Setup (Preferred)
⚠️ Sell in the 4,160–4,198 Golden Zone upon bearish rejection.
🎯 Targets → 4,140 → 4,120 → 4,106 → 4,080
🛑 SL above 4,210
✅ Breakout Sell (Momentum Play)
⚠️ Sell below 4,106 (Break & Retest)
🎯 Targets → 4,080 → 4,060 → 4,040
🛑 SL above 4,120
⸻
🟢 Bullish Countertrend Setup (Lower Probability)
✅ Buy from 4,106–4,100 only if strong bullish engulfing + MACD flip appear.
🎯 Targets → 4,140 → 4,160 → 4,180
🛑 SL below 4,090
🟢 Bullish Breakout Setup (Structure Shift Only)
✅ Buy above 4,200 (Break & Retest)
🎯 Targets → 4,229 → 4,254
🛑 SL below 4,180
⸻
📅 Fundamental Outlook – Asia Session
• No major Asian economic catalysts early session → market may retrace or range.
• Traders likely positioning for NY session after heavy US selling.
• USD Index holding firm; any DXY weakness could extend pullback.
• Focus shifts to US jobless data and Fed sentiment later today.
⸻
⚠ Key Levels to Watch
Type Level Description
Resistance 4,140 / 4,160 First intraday rejection zones
Resistance 4,180 / 4,198 Fibonacci Golden Zone
Support 4,120 Minor intraday support
Support 4,106–4,100 Liquidity shelf
Support 4,080 Deep corrective target
⸻
✅ Summary
Gold is undergoing a corrective bounce within a bearish intraday trend. The Golden Zone (4,160–4,198) is the critical area for potential continuation sells if rejection is confirmed. A failure to clear 4,200 keeps sellers in control. Buyers only gain momentum above 4,200, or at deep retests near 4,106 with bullish confirmation.
🟢 Reversal Buy only if 4,106 holds with strength.
🔻 Main Scenario: Sell rallies from 4,160–4,198 zone.
📉 Break Confirmation: Sell below 4,106.
✨ Golden Zone: 4,160 – 4,198.
⸻
🥇 ElDoradoFx PREMIUM 2.0 – PERFORMANCE 21/10/2025 🥇
📊 GOLD TRADE RESULTS:
🔻 SELL +210 pips
🟢 BUY LIMIT +20 pips
❌ BUY –40 pips (SL)
🟢 BUY +70 pips
🟢 BUY +100 pips
🔻 SELL +210 pips
🟢 BUY +270 pips
---
💰 TOTAL GOLD PIPS WON: ✅ +840 pips
📈 RESULT: 7 Signals → 6 Wins | 1 SL
🎯 ACCURACY: 86%
---
🔥 Solid upward momentum and precision in reversals — swing continuation played out beautifully 📈💎
👏 Congratulations if you profited! ✅✅✅🚀🚀🚀

Gold Plunges — Buying Opportunity EmergesThe strength of the bears eventually caused the price to fall below 4100. After touching 4080, the volatility decreased. I believe that at this point, everyone should know how to trade next. That's right, it is to go long, but pay attention to position control to avoid directly overweighting. It is safer to buy in batches, because the bottom cannot be formed all at once. The probability of this is relatively small. During the rebound, pay attention to the resistance in the area around 4180-4200/4250. If there is a strong and rapid rebound, the price will most likely have some retracement. Therefore, if you are doing short-term trading, you should pay attention to controlling the target. Mid-line trading may also be a roller coaster, but the overall direction should be correct. However, you should also pay attention to the risks. That's all for today.

Correct projection for GoldThe core conclusions of today's analysis on gold have all been verified by market trends, which can be summarized in three aspects: trend prediction, key level control, and trend logic:
1-Trend prediction verification: It was clearly stated this morning that "if it breaks below the key support level of 4280, it will enter a consolidation phase and may further drop to 4150". The current gold price is completely in line with this downward range, and the prediction is highly consistent with the actual trend.
2-Key level control: The previously emphasized resistance level at 4380 and support level at 4280 have both become the core boundaries of intraday price fluctuations.
3-We accurately captured "the restrictive effect of support and resistance levels on prices", and there were no deviations in the judgments on "short-term fluctuation rhythm and long-term trend direction", effectively providing clear range and direction references for trading operations.

Analysis and trading position for gold
Hello traders
The structure of the one-hour time frame is bearish for now
The algorithm for one-hour sellers has also been activated, but it has not yet pulled back to its equilibrium. In one hour, there are two pullback ranges, 4207 and 4232, which you can look for a trigger sell (this range has high validity until the defined TP is touched. If it gives the target first, this range will be merely a reaction). From these areas and TP, the one-hour sellers of this algorithm are defined at 4040, which is one with a daily support, the one-hour seller is liquidating here, which is also the daily support, so we can expect a good move from this support.

Gold Forms Double Top — Bears May Target 4150Gold ultimately formed a double top, and the decline followed a similar pattern to last Friday. Similarly, it failed to hold above 4352 amidst volatility, falling to around 4317 before rebounding. However, the rebound also failed to effectively convert resistance near 41 into support, leading to a rapid decline! The price has once again returned to support near the MA30 on the 4H chart.
A rapid decline is often accompanied by a rebound, but if the rebound fails to break through resistance, it can only serve as a buffer during the downtrend. If the pattern arrangement and indicators also favor a bearish trend, the subsequent decline is likely to be even more drastic (absent breaking news).
Now the price has rebounded to the resistance zone, and the strong resistance is still around 4300. If the rebound cannot gradually recover, then we must pay attention to the trend support. If it falls below, a similar trend as marked in the figure is likely to appear, and the short position may point to around 4150 or even lower.

Gold: Resistance at 4380 is significant📈Today, during the Asian session, the Gold continued its bullish trend, with the price once surging to 4375, but failed to hold steady afterward and pulled back.
📝From a technical perspective, the overall upward structure of London Gold on the daily chart remains intact, and the short-term technical pattern still shows a relatively strong momentum. However, there is certain resistance around the 4380 level, as the price failed to break through it in the previous two attempts,If the resistance at 4380 is broken, it will open the channel for further upward movement, we will focus on the resistance zone around 4400–4440; if this support 4280 fails to hold, gold prices may fall further to 4150 or even lower.
📝Looking at the 4-hour chart, the immediate focus above is on the short-term resistance zone of 4380-4383, while the support zone below is 4280-4290. If the bulls fail to achieve a sustained breakthrough, the market is likely to enter a consolidation phase later. In terms of operation, it is advisable to trade within this range. Refrain from excessive actions or chasing trades at mid-range levels; instead, wait patiently for key levels to enter positions.
💎Trading Strategy:
Buy 4290 - 4300
TP 4320 - 4330 - 4340
SL 4280
Daily-updated accurate signals are at your disposal. If you run into any problems while trading, these signals serve as a reliable reference—don’t hesitate to use them! I truly hope they bring you significant assistance

Gold Double Top Forming – Correction Ahead?When an asset hits an All-Time High(ATH) , technical analysis can get a bit tricky because there’s no historical resistance above and the usual technical rules might have less impact. However, right now it seems like some technical principles are still visible on gold’s chart, at least on the 1-hour timeframe , and I’d like to share that with you.
At the moment, Gold has broken below the lower line of its ascending channel, the Support zone($4,320 – $4,279) , and the neckline of a Double Top Pattern . This could indicate the start of a short-term correction. Given how strong gold’s momentum has been in recent weeks, this correction might not last too long since gold remains very attractive globally.
From an Elliott Wave perspective , the formation of a double top pattern might signal the end of an impulsive wave and the beginning of a corrective phase .
I expect that in the next few hours, Gold could at least drop to the Double Top Pattern’s target around $4,183 . If Gold breaks the Support zone($4,193 – $4,156) , we could see a deeper correction .
Second target:$4,143
Stop Loss(SL): $4,385(Worst)
Please respect each other's ideas and express them politely if you agree or disagree.
Gold Analyze (XAUUSD), 1-hour time frame.
Be sure to follow the updated ideas.
Do not forget to put a Stop loss for your positions (For every position you want to open).
Please follow your strategy; this is just my idea, and I will gladly see your ideas in this post.
Please do not forget the ✅ ' like ' ✅ button 🙏😊 & Share it with your friends; thanks, and Trade safe.

21/10/68 : XAUUSD ( US Session )Using it from US Session until 11.00AM , I'll new analysis and update at 12.00PM
Resistance
4274-4280
4264-4269
4258
Support
4247
4236-4242
4226-4231

Bullish Scenario (Primary Setup): Entry (Buy Zone): 4,180 – 4,2Technical Overview:
Gold is currently in a retracement phase, testing a strong BUY ZONE between 4,180 – 4,200.
This zone has previously acted as a major support area, where buyers stepped in.
The chart shows a possible bullish reversal pattern forming near this zone, suggesting a potential rebound.
🟩 Bullish Scenario (Primary Setup):
Entry (Buy Zone): 4,180 – 4,200
Target: 4,384
Stop-Loss: Below 4,160
Rationale:
The buy zone aligns with previous price reactions, confirming strong demand.
Wick rejections around 4,190 indicate buyer interest.
Price action suggests a possible V-shaped recovery or higher-low formation before continuation upward.
🟥 Bearish Scenario (Alternative):
If price closes below 4,160, the support zone will be invalidated.
In that case, exp TFEX:KKP1! TFEX:DELTA1! TFEX:JPY1! TFEX:EURUSD1! TFEX:GD1! TFEX:GF1! TFEX:USDJPY1! TFEX:GF101! TFEX:SVF1! TFEX:GO1! ect further downside toward 4,120 – 4,100.
⚙️ Summary Table:
Parameter Value
Trend Bias (Short-Term) Neutral to Bullish
Key Support (Buy Zone) 4,180 – 4,200
Target 4,384
Stop-Loss Below 4,160
Risk–Reward Ratio ≈ 1:3
📊 Conclusion:
Gold (XAU/USD) is approaching a critical support zone. As long as the price holds above 4,160, a bullish rebound toward 4,384 remains likely. However, a confirmed break below this level could trigger a deeper correction. TFEX:KEX1! TFEX:ICT1!

Gold Trade Set Up Oct 21 2025Gold failed to create ATH last night during Asia session and dumped hard shifting to a bearish structure during London session. So now i will mostly be looking for sells. If we get a 15m close under most recent swing low 4214 i will want to see 5m BSl swept at at 4233 before looking for sells but if price closes above 4214 and makes HL on the 15m i will look for short term buys into 5m supply and BSL at 4260 before looking for sells again

Gold ready for another spike 4380Gold (XAU/USD) is holding above the support trend line, showing potential for a bullish rebound. As long as price stays above the 4,220 support area, it may target the next resistance near 4,380.
