#XAUUSD(GOLD): +7350 Pips Swing Buy From A Safe Zone! Dear traders,
I hope you’re doing well.
Gold, after consolidating for a week or two, finally dropped significantly, indicating a strong bearish presence in the market. Currently, the bulls are still struggling to push the price higher. A possible scenario is to wait for the price to drop further to around $4650. This area looks promising and holds significant potential.
Good luck and trade safely!
Team Setupsfx_
Xauusdsignals

XAUUSD Intraday Plan | Reclaim 4981 or More DownsideYesterday price failed to break 5078 resistance, which was followed by a sharp drop to 4981 and then down into 4871 support.
For bulls to regain control, price needs to reclaim 4981. That would open the door for another attempt at 5078, and if momentum follows, a push toward 5202.
If selling pressure remains, we may see a full test of the support zone. Failure there would shift focus to the HTF support for potential buying reaction.
📌Key levels to watch:
Resistance:
4981
5078
5202
Support:
4871
4732
4600
4491
👉 Let key levels guide your decisions — wait for confirmation and manage risk accordingly.

GOLD (XAUUSD): More Correction is Coming?!
Gold dropped strongly from a key daily resistance yesterday.
The price managed to violate a support area of a consolidation
range on a daily time frame.
With a high probability, the market will continue to correct.
Next goal - 4800.
❤️Please, support my work with like, thank you!❤️
I am part of Trade Nation's Influencer program and receive a monthly fee for using their TradingView charts in my analysis.

XAUUSD | Ranging price. Breakout today? whats up gold gang, no update from me yesterday as price was just ranging .. managed to scalp a few moves but no major movement
Price is trending upwards currently on the 4h bouncing from the strong level of resistance 5105
Can it break today?
Lots of liquidity to the downside also where i will be looking for buy positions at the buy area .. or if i can spot it in real time, a sell down.
Im still bullish as per price action closing above the previous high on the 4h but really needs to break the 5105 ... i expect it to do so explosively
catch you in the TG
tommy

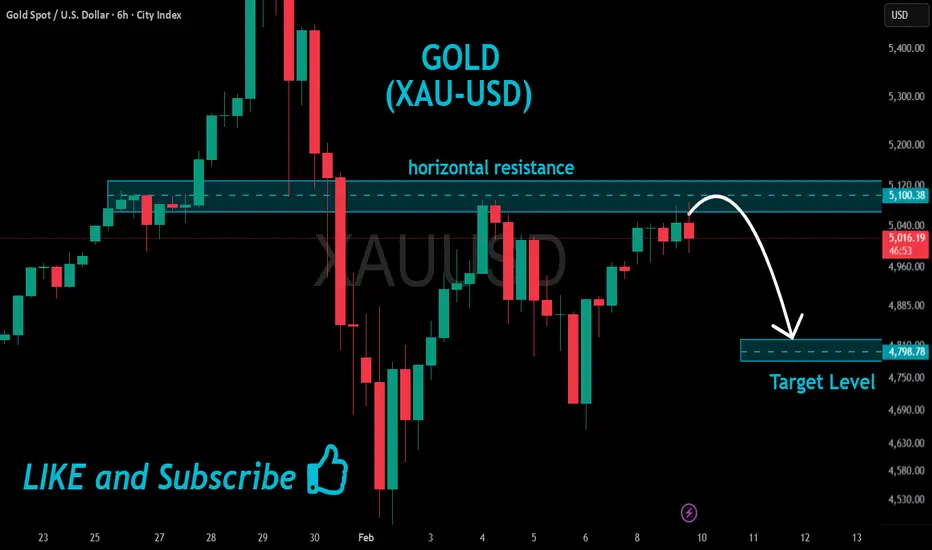
GOLD Short From Resistance!
HI,Traders !
#GOLD is once again
About to retest a horizontal
Resistance level of 5100.38
Which is a strong supply
Area from where a local
Bearish pullback is to
Be expected ! xauusd
Comment and subscribe to help us grow !
XAUUSD Intraday Plan | Reclaim 5078 or PullbackPrice briefly broke above 5078 yesterday, but couldn’t sustain the move and is now trading back just below that level. Price remains supported by the MA50, and we would need a clean, confirmed break above 5078 again to re-open the path toward 5202.
If selling pressure builds, watch the 4981 support and the MA200 for a potential test. Should both fail to hold, the support zone comes into focus for possible buying interest.
📌Key levels to watch:
Resistance:
5078
5202 ☑️
Support:
4981 ☑️
4871
4732
👉Let key levels guide your decisions — wait for confirmation and manage risk accordingly.

XAU/USD Price Outlook – Trade Setup📊 Technical Structure
Gold sharply rejected from the upper channel resistance near the $5,060 area and briefly broke below the ascending channel structure, triggering a fast selloff toward the $4,900 demand zone.
Price has now reacted strongly from the $4,936–$4,913 support zone, reclaiming short-term structure and attempting a recovery back toward the broken resistance area.
The current structure suggests a pullback-then-continuation scenario:
Short term: corrective rebound
Intraday bias: mildly bullish while above $4,913
Major resistance remains near $5,043–$5,066
As long as price holds above $4,913, buyers retain recovery control.
🎯 Trade Setup (Bullish Recovery Bias)
Entry Zone: $4,936 – $4,913
Stop Loss: $4,901
Take Profit 1: $4,980
Take Profit 2: $5,043
Extended Target: $5,066
Risk–Reward Ratio: Approx. 1:3.72
📌 Invalidation:
A sustained break below $4,900 would invalidate the recovery structure and expose $4,880 → $4,840 support region.
🌐 Macro Background
Gold rebounded after falling to a weekly low near $4,878 as traders position ahead of the US CPI report.
Strong NFP reduced expectations of a March Fed rate cut (USD supportive)
However, weak Jobless Claims signaled labor market softening (gold supportive)
Markets still expect at least two Fed cuts in 2026
Risk sentiment remains fragile, supporting safe-haven demand
Therefore, CPI will likely determine whether gold breaks $5,060 or returns below $4,900.
🔑 Key Technical Levels
Resistance Zone: $5,043 – $5,066
Intermediate Resistance: $4,980
Support Zone: $4,936 – $4,913
Breakdown Level: Below $4,900
Upside Structure Trigger: Above $5,043
📌 Trade Summary
Gold is attempting a rebound after a liquidity sweep below channel support.
Preferred strategy: Buy dips above $4,900 targeting a retest of $5,043–$5,066 resistance, while remaining cautious ahead of US CPI volatility.
⚠️ Disclaimer
This analysis is for reference only and does not constitute trading advice. Financial markets involve significant risk; proper risk and position management are essential.

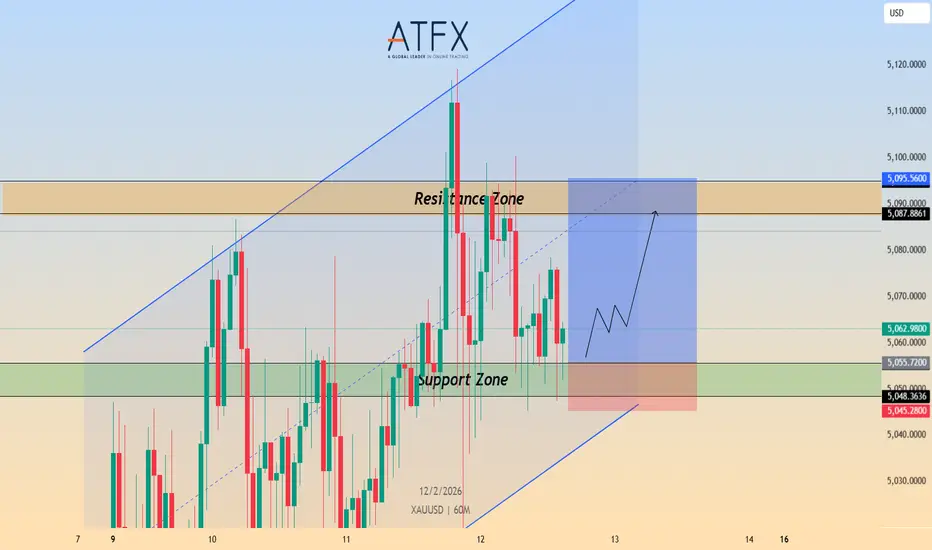
Gold Price Outlook – Trade Setup (XAU/USD)📊 Technical Structure
OANDA:XAUUSD Gold remains within a short-term ascending channel structure despite intraday weakness following strong US NFP data.
Price is currently holding above the key support zone (5,048–5,055) after a pullback from the resistance band near 5,087–5,095.
As long as the support zone remains intact, the broader short-term bias stays cautiously bullish, with scope for another attempt toward the upper resistance region.
However, failure to hold above 5,045 would expose the lower channel boundary.
🎯 Trade Setup (Bullish Bias)
Entry Zone: 5,048 – 5,055
Stop Loss: 5,045
Take Profit 1: 5,087
Take Profit 2: 5,095
Risk–Reward Ratio: Approx. 1:3.82
📌 Invalidation:
A sustained break below 5,045 would shift momentum bearish and invalidate the long setup.
🌐 Macro Background
Gold faces pressure after a stronger-than-expected US Nonfarm Payrolls report reduced expectations for a March Fed rate cut. Markets now price nearly a 95% probability of no change in March.
Despite this, the Federal Reserve is still expected to deliver two rate cuts later in 2026, limiting USD upside momentum.
Additionally, renewed concerns over Fed independence continue to cap aggressive USD strength.
Traders now await US CPI data and Weekly Jobless Claims for the next directional catalyst.
🔑 Key Technical Levels
Resistance Zone: 5,087 – 5,095
Support Zone: 5,048 – 5,055
Bearish Breakdown Level: Below 5,045
Upside Extension Target: 5,120
📌 Trade Summary
Gold remains structurally supported above 5,048 despite post-NFP volatility.
Preferred strategy: Buy dips above support, targeting a move back toward the resistance band, while staying cautious ahead of US inflation data.
⚠️ Disclaimer
This analysis is for reference only and does not constitute trading advice. Financial markets involve significant risk; proper risk and position management are essential.
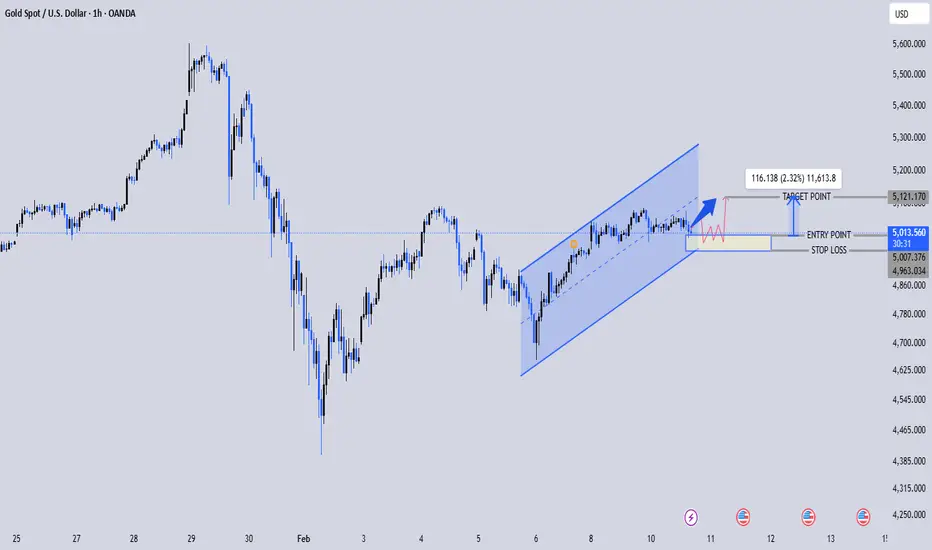
XAUUSD Bullish Channel Continuation Toward 5,110Market Structure
Strong impulsive recovery from the 4,600s zone.
Higher highs + higher lows forming inside the rising channel.
Price currently consolidating near the upper-mid section of the channel around 5,015.
That consolidation box you marked? That’s a classic bullish continuation base if buyers defend it.
📈 Bullish Scenario
Entry zone: ~5,010–5,020 (demand inside channel support)
Stop loss: Below 4,963 (below recent swing low & channel support)
Target: 5,110–5,120 (channel resistance + projected measured move)
If price holds above 5,000 psychologically and continues forming higher lows on lower timeframes, this breakout toward 5,110 is very realistic.
The measured move (≈116 points) aligns nicely with the upper boundary — confluence is strong here.
⚠️ Risk Factor
If price breaks and closes below:
4,990 short-term structure weakens
4,963 invalidates the bullish setup completely
Then we could see a deeper pullback toward mid-channel or even lower boundary.
💡 Overall Bias
Bias remains bullish while inside the ascending channel.
This is a continuation setup, not a reversal play.
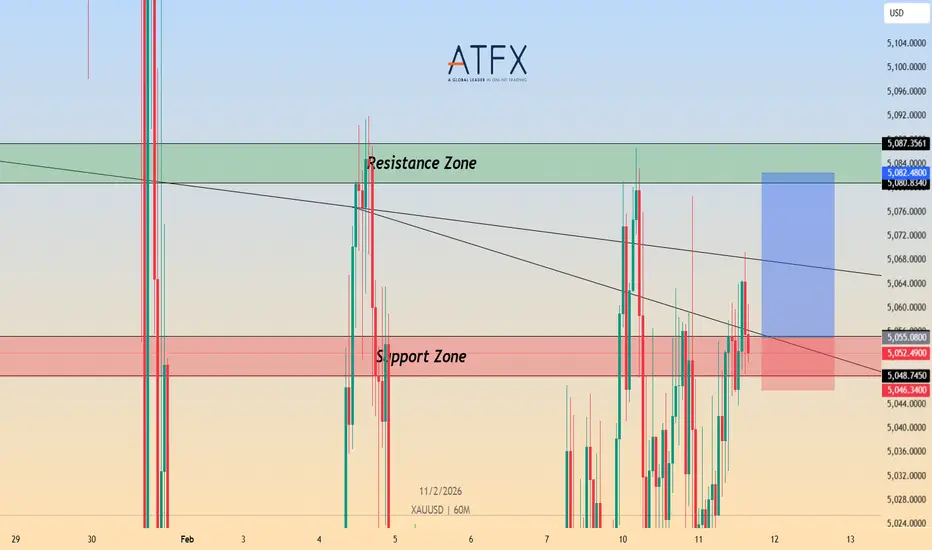
Gold Price Outlook – Trade Setup (XAU/USD)📊 Technical Structure
OANDA:XAUUSD Gold remains in a short-term bullish recovery structure on the 1-hour timeframe, holding above the key support zone around 5,048–5,055. Recent price action shows higher lows forming after a pullback, indicating buyers are still defending dips. As long as price stays above this support zone, the technical bias favors a push toward the upper resistance band near 5,080–5,090.
🎯 Trade Setup (Bullish Bias)
Entry Zone: 5,048 – 5,055
Stop Loss: 5,046
Take Profit 1: 5,080
Take Profit 2: 5,087
Risk–Reward Ratio: Approx. 1 : 3.14
📌 Invalidation:
A sustained break and hourly close below 5,046 would invalidate the bullish setup.
🌐 Macro Background
Gold is supported by ongoing US Dollar weakness, driven by expectations of further Federal Reserve rate cuts and renewed concerns over the Fed’s independence. Softer US retail sales data and lingering labor market uncertainty continue to weigh on the USD. While some Fed officials struck a cautious tone, markets remain focused on the upcoming US Nonfarm Payrolls (NFP) report, keeping gold bids intact but limiting aggressive upside positioning ahead of the data.
🔑 Key Technical Levels
Resistance Zone: 5,080 – 5,090
Support Zone: 5,048 – 5,055
Bullish Invalidation: Below 5,046
📌 Trade Summary
Gold maintains a bullish bias above the 5,050 region. As long as price holds above support, the preferred strategy remains buying pullbacks, targeting a move back toward the upper resistance zone ahead of key US data.
⚠️ Disclaimer
This analysis is for reference only and does not constitute trading advice. Financial markets involve significant risk; proper risk and position management are essential.
GOLD(XAUUSD): Price is in AB=CD Pattern! What's next?Dear Traders,
Following a price rally to $5600, a clearer indication of future price movement emerged. However, the price corrected itself after dropping to the unexpected $4400 level. Since then, it’s resumed natural price movement and currently forms an AB pattern. This pattern is on the verge of developing into a CD pattern, potentially lifting the price from $4967 to $5400 in the next move.
Consider entering when the price experiences a smaller correction. Given the current market’s significant volatility, strict risk management is recommended. If you enjoy our work, please like and comment for more insights.
Team SetupsFX_

GOLD (XAUUSD): Updated Support & Resistance Analysis
Here is my latest support & resistance analysis for Gold.
Resistance 1: 5085 - 5115 area
Resistance 2: 5583 - 5600 area
Support 1: 4652 - 4762 area
Support 2: 4341 - 4405 area
Main focus remains on Resistance 1.
The price already retraced from that one time last week.
We may see another limited bearish move from that.
I guess it will be weaker than the first one.
A bullish breakout of that resistance and a daily candle close above will provide a strong signal to buy.
❤️Please, support my work with like, thank you!❤️
I am part of Trade Nation's Influencer program and receive a monthly fee for using their TradingView charts in my analysis.

XAUUSD Weekly Outlook | Key Levels & High-Impact Data AheadGold is starting the week trading around 5003, pushing back into a key resistance area after last week’s recovery. Price is sitting close to the MA200, which may act as a dynamic resistance in the short term, while the MA50 remains the nearest dynamic support below.
For bullish continuation, price needs a clean break above 5078. If that level gives way, the upper resistance at 5202 comes into focus, with scope for further upside as long as momentum holds.
If price fails to break higher and starts rejecting from this area, a pullback into the support zone is likely. If selling pressure picks up and that zone gives way, watch the HTF support zone (4600–4491) next, followed by the deeper market structure support around 4408–4316.
📌 Key levels to watch
Resistance:
5078 → 5202 (Key Resistance Zone)
Support:
4981
4871 → 4732 (Support Zone)
4600 → 4491 (HTF Support Zone)
4408 → 4316 (HTF Market Structure Support)
👉 Let key levels guide your decisions — wait for confirmation and manage risk accordingly.
🔎Fundamental Focus:
Main volatility drivers this week are NFP (jobs data) and US CPI.
On geopolitics, markets are still reacting to Middle East risk headlines, even as US–Iran talks are continuing (so sentiment can flip fast on any headline).

XAUUSD Triangle targeting 4730Gold (XAUUSD) has been trading within a short-term Triangle pattern, with the 1H MA200 (orange trend-line) as its Resistance and the 4H MA200 (red trend-line) as its Support. Having hit the 1H MA200 right on the Lower Highs trend-line, we expect the pattern to start now its new Bearish Leg.
Based on the previous one it could hit the 0.886 Fibonacci retracement level, which falls under the 4H MA200. Our Target is a potential contact with the latter at $4730.
---
** Please LIKE 👍, FOLLOW ✅, SHARE 🙌 and COMMENT ✍ if you enjoy this idea! Also share your ideas and charts in the comments section below! This is best way to keep it relevant, support us, keep the content here free and allow the idea to reach as many people as possible. **
---
💸💸💸💸💸💸
👇 👇 👇 👇 👇 👇

GOLD (XAUUSD): Strong Intraday Bullish Signal
Gold turned very bullish on Friday.
The price violated a resistance line of a bullish flag pattern
on a 4H time frame.
With a high probability, it is heading toward 5070 level now.
❤️Please, support my work with like, thank you!❤️
I am part of Trade Nation's Influencer program and receive a monthly fee for using their TradingView charts in my analysis.

XAUUSD Intraday Plan | Can Bulls Reclaim Control?Gold failed to sustain the bullish move into 5118 yesterday, which was followed by a sharp decline into the first reaction zone, where support is holding for now.
For bulls to regain control, price needs to reclaim 4957, which would open the door for another push toward 5041 and 5118. If the current support zone fails, watch the lower support zones closely for potential reactions.
📌 Key levels to watch:
Resistance:
4957
5041
5118
Support:
4867
4792
4676
4586
👉Let key levels guide your decisions — wait for confirmation and manage risk accordingly.
⚠️ Volatility remains high and the range is wide — manage risk and position size carefully.

Gold (XAUUSD) 15M – Liquidity Sweep & Buy Reaction ZoneMarket Structure Overview
Overall structure shifted from bullish to bearish
Price made a lower high after the rejection near 5,070
Strong impulsive bearish leg broke prior support → confirms trend change
Current price is in a demand / liquidity zone around 4,800 – 4,770
📉 Key Observations
Previous bullish move failed → distribution phase
Clear break of structure (BOS) to the downside
Price is now compressing inside demand, showing slowing momentum
Wicks + consolidation suggest sell pressure is weakening
🟦 Support & Demand Zone
Major demand zone: 4,805 – 4,770
This zone previously caused a strong bullish reaction
Liquidity has already been swept below minor lows → good sign for a bounce
📈 Trade Idea (Based on Your Markup)
Bias: Short-term bullish retracement (counter-trend)
Entry zone: ~ 4,816
Stop-loss: ~ 4,767
Target: ~ 4,875
RR: Clean and favorable
📌 The projected move aligns with:
Demand reaction
Pullback into previous minor supply
Liquidity grab → reversal scenario
⚠️ Invalidation
A strong 15M close below 4,760
High-volume bearish continuation → bullish idea fails
🧠 Conclusion
This is a technical bounce setup, not a full trend reversal.
Best suited for:

GOLD (XAUUSD) — SMC Accumulation Complete | Targeting New ATHThis GOLD (XAUUSD) analysis is based purely on Smart Money Concepts & market structure, not indicators or emotions.
Price spent a long time in a clear Accumulation range, where smart money quietly built long positions while retail traders stayed confused.
The marked HH inside accumulation shows where liquidity was engineered before expansion.
After accumulation, price executed a classic manipulation move, sweeping sell-side liquidity below the range (HL), trapping weak sellers and fueling smart money entries.
📌 Key Confirmation:
The aggressive bullish displacement from the manipulation zone confirms institutional intent. This was not random — this was planned.
Now price is reacting into a Mitigation Block / Distribution zone, where previous sell orders are getting mitigated.
As long as GOLD respects this mitigation block, the bullish narrative remains valid.
🔍 Bullish Scenario:
• Healthy pullback or consolidation inside the mitigation block
• Liquidity taken ➝ continuation higher
• Targeting new ATH around 4730 and above
⚠️ Invalidation:
Only a strong acceptance below the mitigation block would delay the upside. Until then, dips are viewed as opportunities, not reversals.
This is how smart money builds trends: Accumulation ➝ Manipulation ➝ Expansion ➝ Continuation.
💡 If you wait for perfect clarity, you enter late.
If you understand liquidity, you enter with confidence.
💬 YOUR TURN
Do you see GOLD continuing toward a new ATH,
or do you expect deeper mitigation first?
👇 Comment your bias (Bullish / Pullback / Neutral)
🔁 Share this idea if it helped your market perspective
⭐ Follow for more Smart Money GOLD breakdowns

GOLD—Smart Money Bullish Continuation|Liquidity-Driven ExpansionThis GOLD analysis is built purely on Smart Money Concepts, focusing on structure, liquidity, imbalance, and institutional behavior — not indicators, not emotions.
Price has already delivered multiple clean Breaks of Structure (BOS), confirming a strong bullish market regime. Each BOS is followed by healthy pullbacks into premium demand zones, showing that buyers are in full control and selling pressure is only corrective.
The most recent impulse created a clear BISI (Bullish Imbalance) along with a well-defined Order Block (OB). This area represents unfinished business in price — zones where smart money is likely to rebalance positions before continuation.
Below the current price, we still have resting sell-side liquidity (SSS), which can act as a temporary draw for a controlled pullback. However, as long as price respects the highlighted OB + imbalance region, the higher-timeframe bullish narrative remains intact.
The projected path illustrates manipulation → mitigation → continuation, which is a classic institutional delivery model. Once mitigation is complete, the probability favors expansion toward higher liquidity pools, opening the door for new highs above the psychological 5000 area.
This is not a “signal” —
This is price telling its story through liquidity.
📌 Smart money doesn’t chase price — it waits for price to return to value.
💬 Your Turn
Do you expect: 1️⃣ A deeper mitigation into the OB
2️⃣ Or a shallow pullback with direct continuation?
👇 Share your bias in the comments
🔁 Repost if this aligns with your market view
⭐ Follow for more clean SMC & liquidity-based GOLD ideas

XAUUSD — Smart Money Reload Before Continuation📊 Gold Bullish Continuation | Liquidity, Imbalance & Order Flow in Play
Gold has already shown its hand.
After a strong bullish expansion, price delivered a deep corrective move into higher-timeframe value, clearing internal liquidity and mitigating smart money orders. This drop was not random — it was engineered to rebalance order flow before continuation.
🔹 Multiple BOS confirmations on the left confirm a healthy bullish structure.
🔹 The impulsive sell-off acted as liquidity sweep + discount delivery, tapping into a higher-timeframe Order Block.
🔹 From that OB, price reacted aggressively, showing strong bullish intent and displacement.
🔹 Currently, price is trading inside a balanced range (BISI ↔ SIBI) — a classic reload zone for smart money.
This zone represents fair value, where institutions often accumulate positions before targeting external liquidity.
As long as price holds above the BISI demand, the expectation remains: ➡️ Continuation toward previous highs (CRT High)
➡️ Expansion into premium liquidity
➡️ Potential for new highs once imbalance is fully resolved
⚠️ Any short-term pullbacks into this zone should be viewed as opportunities, not weakness — unless structure is violated.
📌 Smart money doesn’t chase price.
They wait for balance — then expand.
💬 Let’s Discuss
Do you see a deeper mitigation first, or direct continuation from here?
👇 Drop your bias in the comments
🔁 Share if this aligns with your Gold outlook
✍️ — Jayartolentiono90
Smart Money | Liquidity | Order Flow
Gold-focused analysis
🚫 No signals — only structure & logic
⭐ Follow for consistent SMC insights

XAU/USD Bullish Thesis Supported by Market Structure🔱 XAU/USD — Gold vs U.S. Dollar
Metals Market | Institutional Edge Plan (Day / Swing Trade)
📌 Market Bias
Primary Plan: 🟢 Bullish Continuation
Gold remains supported by macro flows, liquidity positioning, and risk-hedging demand. This plan focuses on buy-side participation with controlled risk, aligned with institutional behavior.
🧠 Execution Framework (Entry Logic)
Entry Method: 🧩 Layered Limit Entries (Liquidity-Based)
You may enter at any preferred price level,
however this strategy is designed around scaled limit entries to reduce emotional execution and improve average pricing.
Preferred Buy Zones (Limit Layers):
4900
4800
4700
4600
📌 Concept: Institutions rarely enter at one price.
They scale into positions where liquidity is resting and volatility shakes out weak hands.
🎯 Target Zone
Primary Objective: 5400
🔎 Target Logic Includes:
🚓 Strong Institutional Resistance Zone
📈 Overbought Conditions on higher timeframes
Potential Late-Buyer Trap
🔗 Intermarket Correlation Alignment
➡️ At this zone, probability favors profit protection over greed.
🛑 Risk Management
Protective Stop (Extreme Invalidation): 4500
📌 This level represents a structural failure of the bullish narrative.
⚠️ Risk parameters are personal.
Use this level as a reference, not a command.
⚖️ Trader Responsibility Notice
Dear Ladies & Gentlemen (Thief OGs),
You are not required to use only my TP or SL
Adjust position size, partials, and exits based on your own risk model
Capital preservation always comes before ego
💼 Professional traders manage risk first, profits second.
🔗 Related Markets to Watch (Correlation Dashboard)
💵 USD-Based Assets
DXY (U.S. Dollar Index):
⬇️ Weak USD = ⬆️ Supportive for Gold
USD/JPY:
Yen strength often aligns with risk-off flows benefiting XAU
📉 Bonds & Rates
US10Y Treasury Yields:
Falling yields = lower opportunity cost → bullish for Gold
📊 Risk Sentiment
S&P 500 / NASDAQ:
Equity stress or volatility spikes often redirect capital into Gold
🌍 Fundamental & Macro Factors in Play
Key Drivers Supporting Bullish Bias:
🏦 Central bank gold accumulation (reserve diversification)
📉 Real yield pressure amid policy uncertainty
🌍 Geopolitical & macro risk hedging demand
🧾 Sticky inflation narratives keeping Gold relevant as a hedge
Upcoming Factors to Monitor:
High-impact U.S. inflation data
Federal Reserve policy commentary
Labor market volatility & growth outlook signals
Global risk events influencing safe-haven flows
📌 Gold moves when confidence in fiat wobbles.
🧠 Institutional Mindset Reminder
Retail chases price
Institutions build positions
Liquidity tells the truth
Patience pays the premium
Thief Trader Wishes
“Take profits without noise.
Respect risk without fear.
Let the market pay you — don’t beg it.”
📈 Trade smart.
🧠 Stay disciplined.
💰 Secure the bag, protect the capital.

GOLD(XAUUSD): New Potential Zone For Swing And Intraday Buyers! Gold fell below our previous analysis’s expectations rendering it invalid. Consequently, we’ve identified two potential zones for buyers. One is safer while the other is riskier. You can choose either or both depending on your trading strategy.
Like and comment for more! We appreciate your support and hope it continues.
Team Setupsfx_

Gold’s Bounce Looks Corrective – Short SetupGold ( OANDA:XAUUSD ) bounced from two days ago mainly due to oversold conditions and margin-unwind dynamics, and touched the targets of my previous idea .
But the fundamental short case is still valid: the U.S. Dollar has near-term support, and if DXY( TVC:DXY ) firms up again it usually caps Gold’s upside—especially with the US 10Y yield around 4.29% ( TVC:US10Y ).
At the same time, the partial U.S. government shutdown and delayed key releases add uncertainty, which typically supports safe-haven demand.
My bias: look for shorts on failed follow-through (weak bounce) while Dollar/yields stay bid.
If DXY rallies again, can Gold reclaim today’s highs?
Let’s dive into a technical analysis of gold on the 1-hour timeframe.
Currently, gold is moving within the resistance zone($4,991-$4,878) and near the Potential Reversal Zone(PRZ) .
From an Elliott Wave perspective, the recent +10% rise in gold over the last two days is likely a corrective structure, most likely a zigzag correction(ABC/5-3-5).
I expect that AFTER breaking the support lines, gold will decline at least to $4,707 and fill the lower gap($4,695-$4,661).
First Target: $4,707
Second Target: $4,569
Stop Loss(SL): $5,079
Points may shift as the market evolves
Can gold resume its bullish trend, or should we expect deeper corrections?
💡 Please respect each other's opinions and express agreement or disagreement politely.
📌 Gold Analyze (XAUUSD), 1-hour time frame.
🛑 Always set a Stop Loss(SL) for every position you open.
✅ This is just my idea; I’d love to see your thoughts too!
🔥 If you find it helpful, please BOOST this post and share it with your friends.
