How can I justify this price?Whatever you understand, that was your concept!
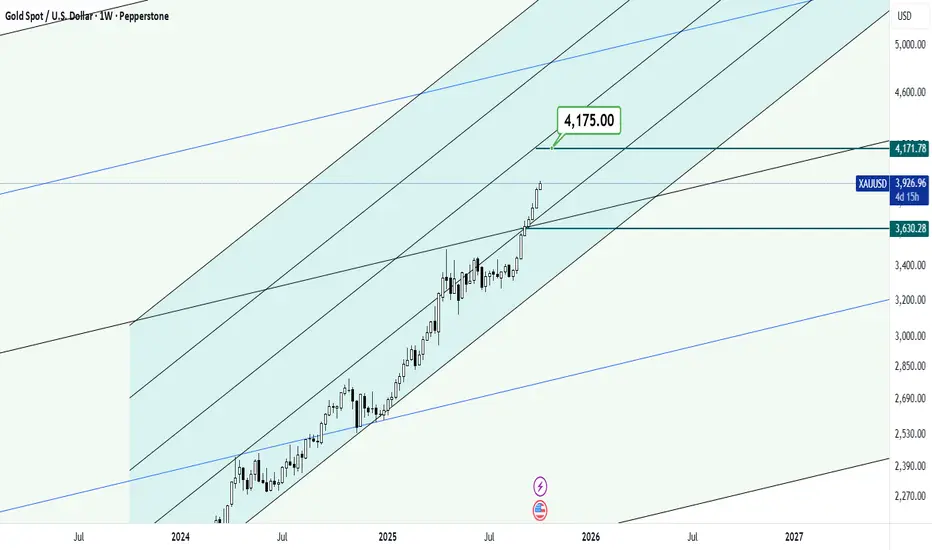
Well, we are rapidly approaching the end of the gold bull run and prices are facing a much steeper slope in the weekly and monthly timeframes!
The target price at 4175 is not far away, but I think it is scary!
Good luck
Xauusdsignals
XAUUSD(GOLD): +1000 Pips Possible Sell Setup! Comment Your ViewsDear Traders,
We may see sell dropping to 4000$ region or further down as we think price has reached the exhaustion point; it is likely that price drop rapidly and move up sharply. If you like the idea then comment and like.
Good luck
Team Setupsfx_

#XAUUSD: Price Is Likely To Hit $4200 Before Bearish CorrectionDear Traders,
Gold is likely to reach $4200 before experiencing a significant decline. We anticipate a final push potentially exceeding $4000. The current market sentiment is strong and is likely to drive the price to our target region. However, we require confirmation in a shorter timeframe and recommend employing appropriate risk management.
If you find our analysis valuable please engage with it. Follow us for further insights.
Sincerely,
Team Setupsfx

#XAUUSD: Targeting $4200, An 1800+ Pips Swing ViewDear traders,
Since we posted our previous idea on the gold price has reversed as we had anticipated. However, when we examine smaller time frames we gain greater clarity on the price’s progression. As of now, the price is trading at 4015 and may open with a positive gap on Monday. Our primary objective should be to allow the market to open on Monday. Once the price has settled, we can execute a more secure and well-managed RR trade.
Please do not consider this as a guarantee. Instead, use it as an educational perspective or bias. Conduct your own analysis and trade safely.
Team Setupsfx_

XAUUSD Bull and Bear Game1. Solid safe-haven demand: The ongoing US government shutdown, heightened global trade tensions, and escalating geopolitical risks all contribute to gold's safe-haven fundamentals.
2. Favorable Federal Reserve Policy: Market expectations for an October rate cut by the Fed are extremely high (with a 97% probability), which continues to suppress the US dollar and is bullish for gold.
3. Technical Correction Needs: The RSI indicator has shown an overbought signal. The rapid price increase has accumulated profit-taking pressure, raising the possibility of a short-term technical correction.
Long Strategy:
· Ideal Entry: After the support range of $4060-4050 stabilizes (e.g., a bullish engulfing candlestick pattern or a hammer candlestick pattern appears), you can place long orders in batches.
· Target: Retest of the $4130-4150 area.
· Stop-loss: A break below $4050.
· Short Strategy (Short-Term):
· Suitable only for aggressive traders. Try a small short position when the price rebounds to $4130-4150 and a stagflation signal (e.g., a bearish engulfing candlestick pattern or a dark cloud cover pattern) appears.
· Target: $4080-4060.
· Stop-loss: A breakout of $4170.

ElDoradoFx PREMIUM 2.0 – (14/10/2025, U.S. SESSION)Gold continues to consolidate after a strong intraday rebound from 4,090. The market is showing compression between 4,125–4,144, forming a temporary equilibrium structure after Friday’s impulsive rejection from 4,179. Volatility is expected to increase as liquidity builds ahead of U.S. CPI data tomorrow.
⸻
🧭 MARKET STRUCTURE OVERVIEW
• Trend Context: Macro bias remains bullish (D1 uptrend intact), but short-term distribution structure is visible below 4,144–4,150.
• Liquidity Zones:
• Buy-side liquidity resting above 4,150–4,165.
• Sell-side liquidity below 4,093–4,072.
• Market Cycle Stage: Reaccumulation or pre-breakout compression.
⸻
🔍 MULTI-TIMEFRAME TECHNICAL OUTLOOK
D1 – Macro Trend Context
• Price action: Successive bullish candles above 20EMA and 50EMA.
• RSI (81.9): Overbought but still supportive — structure points to controlled retracement before continuation.
• MACD: Bullish momentum moderating, suggesting potential pause before trend expansion.
• Key level: Daily resistance at 4,179.70 (weak high), immediate support 4,084–4,063.
H1 – Intraday Structure
• Clean Break of Structure (BOS) from 4,090 → 4,137, followed by consolidation.
• Minor lower high confirmed at 4,144, forming temporary range.
• RSI at 57 — neutral, showing balanced order flow.
• MACD histogram contracting, indicating loss of bullish momentum.
• Current structure favors a pullback toward the Golden Zone before next directional move.
15M–5M – Short-Term Precision View
• Clear CHoCH observed below 4,132.
• EMA cluster flattening (20EMA ≈ 4,130, 50EMA ≈ 4,125).
• Short-term buyers defending 4,125–4,120, but volume divergence showing early exhaustion.
• A break below 4,125 would confirm liquidity sweep and open the door for 4,093–4,072 retracement.
⸻
📊 FIBONACCI GOLDEN ZONE ALIGNMENT
• Swing High: 4,179
• Swing Low: 4,090
➡️ Golden Zone = 4,124 – 4,136
This zone coincides with the 1H resistance confluence, trendline touchpoint, and intraday imbalance fill. It serves as the key decision zone for U.S. session traders.
⸻
🎯 HIGH PROBABILITY TRADE SETUPS
1️⃣ Bullish Continuation Scenario
• Confirmation: Break & retest above 4,144.
• Entry: Buy on retest of 4,144–4,147 zone.
• Targets: 4,165 → 4,179 → 4,200
• Stop-loss: Below 4,125 (structure invalidation).
• Rationale: Reclaiming prior supply + momentum expansion expected if DXY weakens.
2️⃣ Bearish Corrective Scenario
• Confirmation: Rejection from 4,136–4,144 (Golden Zone).
• Entry: Sell from 4,136–4,140 range with candle confirmation.
• Targets: 4,110 → 4,093 → 4,072
• Stop-loss: Above 4,150.
• Rationale: RSI divergence + MACD histogram contraction + liquidity sweep above previous highs.
⸻
📅 FUNDAMENTAL CATALYSTS
• 🕐 No major U.S. economic data today, but traders are positioning ahead of tomorrow’s CPI report, which will define midweek volatility.
• 🕐 DXY remains stable near 104.90, keeping gold capped intraday.
• 🕐 Treasury yields flat; risk sentiment mixed — aligning with gold’s consolidation.
⸻
⚠️ KEY TECHNICAL LEVELS
• Major Resistance: 4,144 / 4,165 / 4,179
• Intraday Support: 4,125 / 4,110 / 4,093 / 4,072
• Extreme Levels: 4,050 support pivot / 4,200 macro extension.
⸻
🧩 SENTIMENT & SUMMARY
Gold is currently in a compression phase between intraday supply (4,136–4,144) and demand (4,110–4,125).
Expect low volatility until a clear break of structure occurs.
📈 Above 4,144 → momentum resumes toward 4,165–4,179.
📉 Below 4,110 → corrective wave extends into 4,093–4,072 before potential bounce.
The safest approach for institutional-style execution is to wait for confirmation at the boundaries of the Golden Zone rather than pre-positioning.

ElDoradoFx PREMIUM 2.0 – (14/10/2025, LONDON SESSION)
Gold rejected 4,179 after forming a double-top structure and has entered a short-term correction phase.
The 1H chart shows a Break of Structure to the downside, and price is now retesting the 4,125–4,134 supply area.
The overall trend remains bullish, but this pullback is healthy after an extended rally.
⸻
🔸 BREAKING PRICE:
Below 4,093 confirms continuation toward 4,073 → 4,050
Above 4,150 reopens bullish momentum toward 4,179 → 4,200
⸻
🔸 FIBONACCI GOLDEN ZONE (4,085 → 4,179):
🎯 4,106 – 4,118 → Current decision zone.
If price holds above, buyers may re-enter.
If it fails, expect deeper correction.
⸻
🔸 HIGH PROBABILITY AREAS:
🔻 SELL Zone: 4,125–4,134
🎯 Targets: 4,090 → 4,073 → 4,050
🛑 SL: Above 4,150
🔹 BUY Zone (Reversal Confirmation):
Break above 4,150 → Targets: 4,165 → 4,179 → 4,200
🛑 SL: Below 4,125
⸻
🔸 FUNDAMENTAL WATCH:
• No major UK data today.
• DXY holding near 104.90, applying pressure on gold.
• Market focus remains on upcoming U.S. CPI → expect volatility spikes.
⸻
🔸 SUMMARY:
Gold is correcting after rejection at 4,179.
Focus on 4,125–4,134 for possible short re-entries.
Break below 4,093 = confirmation of deeper correction.
Above 4,150, buyers take control again.
⸻
💎 ElDoradoFx PREMIUM 2.0 – Session Analysis
#XAUUSD #Gold #ElDoradoFx #LondonSession #Analysis

Gold shows strength again on Monday💎Gold has broken through the previous high of 4059, and the strong bullish momentum continues. Every Monday sees a sharp rise,those who review historical market data will notice this cyclical pattern.
📈Today, as a Monday, gold is surging toward the key 4100 level. Amid such a strong bull trend, any attempt to predict the peak will be crushed by the trend itself. Investors who fail to understand the principle of "trading with the trend" are bound to end up with disastrous results.
📈After breaking above 4080 today, the upward room has opened up again. Focus on the 4125-4170 range on the upside, as this is the extended target zone following the breakout. Given the current volatility, gold may even reach this range in a single trading day. The market is currently in a state of bullish enthusiasm, and we remain bullish on the trend. However, we must also guard against correction risks and adhere to the strategy of "being bullish but not blindly chasing upward moves." It is advisable to let the market develop further; a pullback to form a low will also provide a defensive entry point.
Buy 3080 - 3085
TP 4000 - 4010
SL 3075
Daily-updated accurate signals are at your disposal. If you run into any problems while trading, these signals serve as a reliable reference—don’t hesitate to use them! I truly hope they bring you significant assistance

Gold Price Outlook – Trade Setup (XAU/USD)📊 Technical Structure
TVC:GOLD Gold (XAU/USD) rallied strongly in the Asian session, reaching $4,130, marking a fresh all-time high. Price action shows a support zone at $4,112–$4,117 and a resistance zone at $4,159–$4,165. If gold consolidates above support, buyers may attempt to push toward the resistance zone. However, as the rally has been steep, some pullback into support is possible before the next leg higher.
🎯 Trade Setup
Entry: $4,112–$4,117 (buy near support)
Stop Loss: $4,109
Take Profit 1: $4,137
Take Profit 2: $4,159
Take Profit 3: $4,165
Risk/Reward (R:R): ~1 : 6.22
🗝️ Key Technical Levels
Support Zone: $4,112–$4,117
Resistance Zone: $4,159–$4,165
Trend Bias: Bullish above $4,112
🌍 Macro Background
Gold price (XAU/USD) jumps to a fresh record high near $4,130 during the early Asian session on Tuesday, supported by renewed US–China trade war fears. US President Donald Trump announced new trade measures, including 100% tariffs on all Chinese goods and export controls on critical US-developed software, effective November 1. Although Trump later struck a softer tone, saying the US was not looking to “hurt” China, investors still rushed to safe-haven assets.
At the same time, expectations for further Federal Reserve rate cuts are growing. Markets are pricing in an almost certain 25 bps cut in October and another in December, according to the CME FedWatch tool. Lower interest rates reduce the opportunity cost of holding gold, supporting the rally. Traders are also awaiting Fed Chair Powell’s speech later on Tuesday, which could provide additional policy guidance.
Despite strong year-to-date gains (over 56%), analysts note that while the rally has legs, a short-term correction would be healthy for sustaining the long-term uptrend.
📌 Trade Summary
Gold remains bullish above $4,112 support zone. Dips into this area are likely to attract renewed buying interest, with upside targets at $4,159–$4,165. A break below $4,109 would invalidate the bullish setup and expose deeper corrective pressure.
⚠️ Disclaimer
This analysis is for reference only and does not constitute trading advice. Trading involves significant risk, and proper risk management is essential.

ElDoradoFx PREMIUM 2.0 - (14/10/2025, ASIA SESSION)Gold remains in a strong bullish trend across all major timeframes, consolidating near the 4,110–4,117 resistance zone after a solid impulse from 4,050.
The market shows sustained buying pressure, but short-term exhaustion is visible with potential for a healthy pullback before continuation.
⸻
🧩 Multi–Timeframe Technical Breakdown
📆 Daily (D1):
• Candle closed bullish, extending the uptrend from late September.
• RSI remains overbought (~86) → suggesting potential short-term correction.
• MACD still expanding positively → confirms medium-term bullish continuation.
Bias: Bullish (Possible minor retracement before continuation)
⸻
⏰ 1H Structure:
• Clear BOS above 4,078, followed by sustained higher highs and higher lows.
• Price currently consolidating under 4,117 resistance after intraday overextension.
• 20EMA and 50EMA acting as dynamic support near 4,100–4,104.
• MACD histogram losing strength — early retracement signals forming.
Bias: Bullish, but expecting corrective pullback before next leg
⸻
🕒 15M–5M Intraday Outlook:
• Price forming a minor CHoCH at 4,117, confirming exhaustion at top of ascending channel.
• Potential pullback into Fibonacci Golden Zone (4,097–4,101) for liquidity grab before continuation.
• If 4,093 breaks, expect a short-term correction back into 4,085–4,072 liquidity pocket.
⸻
✨ Fibonacci Golden Zone
Swing Low: 4,085 → Swing High: 4,117
🎯 Golden Zone: 4,097 – 4,101
This confluence aligns with 1H EMA + BOS retest → ideal re-entry area for buys.
⸻
📈 Trading Plan
✅ High Probability Buy Setup (Continuation Bias):
• Entry: 4,097–4,101 (Golden Zone retest)
• Confirmation: Bullish rejection / EMA bounce
• Targets: 🎯 4,117 → 4,125 → 4,135 → 4,150
• Stop Loss: 🛑 Below 4,085
⸻
⚠️ Short-Term Sell Setup (Correction Bias):
• Entry: Break & Retest below 4,093
• Targets: 🎯 4,085 → 4,072 → 4,050
• Stop Loss: 🛑 Above 4,104
⸻
🧠 Key Market Levels
• Resistance: 4,117 / 4,125 / 4,135
• Support: 4,101 / 4,093 / 4,085 / 4,072
• Trendline Supports: 4,085 & 4,050 zones
⸻
📰 Fundamental Context
• No major Asian data → technicals dominate.
• U.S. Bank Holiday liquidity fading; normal flow resumes in London.
• DXY steady near 104.80, keeping gold capped but structurally bullish.
⸻
⚡️ Summary
Gold remains bullish overall, consolidating below 4,117 after strong gains.
Expect an intraday pullback toward 4,097–4,101 before the next impulse.
Break above 4,117 → confirms continuation to 4,135–4,150.
Break below 4,093 → triggers short-term correction only.
⸻
📊 Prepared by ElDoradoFx PREMIUM 2.0
💎 Professional XAUUSD Analysis | Session Outlooks | Smart Money Insights
#XAUUSD #Gold #Forex #ElDoradoFx #PriceAction #SmartMoney #AsiaSession #TradingView #TechnicalAnalysis
⸻
🥇 ElDoradoFx PREMIUM 2.0 – PERFORMANCE 13/10/2025 🥇
⚡️ GOLD TRADE RESULTS:
🔻 SELL +30 pips
🟢 BUY +210 pips
🟢 BUY +360 pips
---
💰 TOTAL GAIN: +600 pips
🎯 RESULT: 3 Signals → 3 Wins | 0 SL
📊 ACCURACY: 100 % ✅
---
🔥 Sharp setups. Strong momentum. Maximum precision.
A flawless start to the week — profits locked in 📈💎
🚀 Congratulations if you profited! ✅✅✅

GOLD Will Go Down!
HI,Traders !
#GOLD is trading in an upward trend and has
formed an ascending channel. Now it has touched
the upper limit of the channel. We expect
a correction from there !
Comment and subscribe to help us grow !

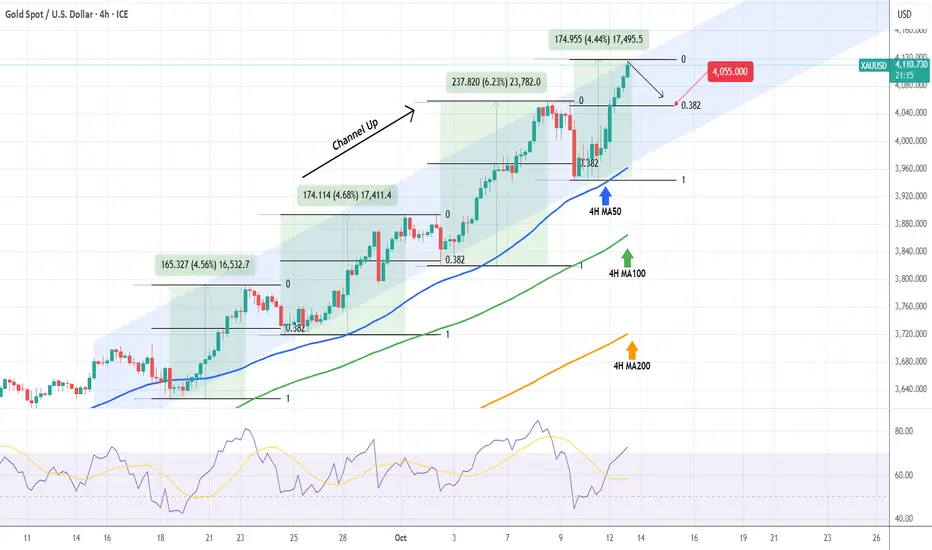
XAUUSD Looking for a quick relief pull-back.Gold (XAUUSD) has been trading within a 1-month Channel Up supported by its 4H MA50 (blue trend-line) and today hit the top (Higher Highs trend-line) of the pattern.
This Bullish Leg has completed a +4.45% rise, almost similar to the first two of the pattern. They both pulled back to their respective 0.382 Fibonacci retracement levels after the Higher High, so as long as the pattern's top holds, we expect a quick correction to $4055 (Fib 0.382).
-------------------------------------------------------------------------------
** Please LIKE 👍, FOLLOW ✅, SHARE 🙌 and COMMENT ✍ if you enjoy this idea! Also share your ideas and charts in the comments section below! This is best way to keep it relevant, support us, keep the content here free and allow the idea to reach as many people as possible. **
-------------------------------------------------------------------------------
💸💸💸💸💸💸
👇 👇 👇 👇 👇 👇
Bullish Strategy Secures Profits — What’s the Next Move?Good evening, everyone!
Today, gold surged above 4040 before pulling back to the 4033–4022 support area, then rebounded strongly to break the 4050–4060 previous highs, setting another new record.
Congratulations to all traders who followed the strategy — this move has delivered impressive profits! 👏
From a medium-term perspective, the overall structure remains bullish. However, on the 30-minute timeframe, the market shows signs of a technical correction, which is a normal consolidation phase.
Short-term support is located near the 4050 previous high, followed by 4038–4028. In a deeper pullback scenario, the price could test 4015–4011, though without major news catalysts, such a decline seems less likely. Therefore, attention should focus mainly on 4050/4038 as key short-term zones.
If gold continues rallying without a proper pullback, the next potential upside target is around 4100. Should the price reach that level with weakening momentum, it may present a relatively low-risk short-selling opportunity.
Trading Strategy Summary:
Swing traders: Consider buying near 4050 and selling near 4100.
Short-term traders: Use quick in-and-out trades around intraday support and resistance levels.

GOLD (XAUUSD): New ATH & Next Resistances
As I predicted, Gold updated the ATH this morning.
The next strong resistances that I see are:
Resistance 1: 4098 - 4103 area
Resistance 2: 4148 - 4153 area
Get ready for more growth.
❤️Please, support my work with like, thank you!❤️
I am part of Trade Nation's Influencer program and receive a monthly fee for using their TradingView charts in my analysis.

ElDoradoFx PREMIUM 2.0 - (13/10/2025, LONDON SESSION)Gold continues its bullish structure, holding strong above the 4,050 support and trading near recent highs around 4,078. Buyers remain in control, although momentum is showing early signs of exhaustion as price approaches upper channel resistance.
⸻
🔍 Technical Outlook
Daily Chart (D1)
• Strong continuation of the bullish trend since the breakout above 4,000.
• Price is above both 20EMA and 50EMA → confirming sustained upside pressure.
• RSI (74) nearing overbought territory → possible short-term correction before continuation.
• MACD remains strongly positive → confirms underlying bullish bias.
Bias: Bullish, but extended — watch for retracements toward 4,040–4,050.
⸻
1H Chart (H1)
• Structure clearly bullish with multiple BOS (Break of Structure) signals.
• Price broke above 4,060, reaching 4,078 before mild rejection.
• RSI (67) and MACD still positive but flattening → likely short-term pullback.
• Key dynamic support: 20EMA (~4,059) and 50EMA (~4,015).
• If gold holds above 4,059, next impulsive leg could target 4,085–4,100.
Intraday Bias: Bullish with possible retest before new high.
⸻
15M Chart (M15)
• Short-term pullback from 4,078 high; structure remains bullish above 4,050.
• RSI neutral (53) → cooling phase after strong push.
• MACD histogram turning lighter → suggesting consolidation before next move.
• Price creating higher lows → continuation likely if 4,060 support holds.
Short-term Range: 4,050–4,078.
⸻
5M Chart (M5)
• Pullback currently forming a mini flag/channel.
• Buyers protecting 4,060 area.
• A break above 4,072–4,074 could trigger momentum continuation.
• Below 4,050, momentum may flip bearish toward 4,031.
⸻
✨ Fibonacci Golden Zone
Last impulse leg (Low 3,955 → High 4,078)
🔹 Golden Zone: 4,050 – 4,031
This area remains a key buy zone for bullish continuation setups.
Expect buyers to step in aggressively if price revisits this range.
⸻
🎯 High Probability Scenarios
Bullish Continuation Setup
✅ Buy above 4,074 (Break & Retest)
🎯 Targets → 4,085 → 4,095 → 4,110
🛑 SL below 4,060
Rationale:
• Structure continuation from higher low formation
• MACD positive crossover
• RSI above 55 and 1H EMA support
⸻
Bearish Correction Setup
⚠️ Sell below 4,050 (Break & Retest)
🎯 Targets → 4,040 → 4,031 → 4,015
🛑 SL above 4,059
Rationale:
• Overbought conditions from daily RSI
• Possible liquidity grab above 4,078 followed by correction
• MACD 5M histogram turning red → short-term momentum loss
⸻
📅 Fundamental Outlook – London Session
• No major EU or UK data expected early in session.
• Focus remains on U.S. retail sales and Fed commentary later in the day.
• DXY stabilizing around 104.80 → neutral pressure on gold.
• Bond yields steady, limiting large intraday swings for now.
⸻
⚠️ Key Levels to Watch
Type Level Description
Resistance 4,074 / 4,078 Intraday high & breakout zone
Resistance 4,085 / 4,100 Next liquidity target
Support 4,059 Intraday EMA confluence
Support 4,050–4,031 Fibonacci Golden Zone
Support 4,015 Deeper retracement zone
⸻
✅ Summary
Gold remains in a controlled bullish phase, supported by a clean structure and solid fundamentals.
As long as price holds above 4,050, continuation toward 4,085–4,100 remains favored.
However, a failure to hold 4,050 could trigger a correction toward the Golden Zone (4,050–4,031) before renewed buying pressure.
Session Bias: Bullish, but cautious near 4,078.
Break Confirmation:
• Buy above 4,074
• Sell below 4,050
Golden Zone: 4,050 – 4,031
⸻
🥇 ElDoradoFx PREMIUM 2.0 – WEEKLY PERFORMANCE 💸
📆 06/10/2025 → 12/10/2025
MONDAY 06/10/2025
🟢 BUY +110 pips
🔻 SELL +110 pips
🟢 BUY +110 pips
🔻 SELL +60 pips
🟢 BUY LIMIT +150 pips
TUESDAY 07/10/2025
🟢 BUY +20 pips
🟢 BUY +20 pips
🔻 SELL +110 pips
🔻 SELL +60 pips
🟢 BUY LIMIT +210 pips
⚖️ SELL – BE
🟢 BUY +40 pips
🟢 BUY +20 pips
💸 BTC/USD BUY +2,500 pips
WEDNESDAY 08/10/2025
🔻 SELL +60 pips
🟢 BUY +20 pips
🟢 BUY +40 pips
🔻 SELL +110 pips
❌ SELL –40 pips (SL)
🟢 BUY +210 pips
❌ SELL –40 pips (SL)
🟢 BUY LIMIT +40 pips
THURSDAY 09/10/2025
🔻 SELL +20 pips
🔻 SELL +60 pips
🟢 BUY +20 pips
🟢 BUY +120 pips
🟢 BUY +110 pips
🟢 BUY LIMIT +30 pips
🟢 BUY +60 pips
FRIDAY 10/10/2025
🔻 SELL +50 pips
🔻 SELL LIMIT +20 pips
❌ SELL –95 pips (SL)
🔻 SELL +210 pips
🟢 BUY +110 pips
🟢 BUY +200 pips
🔻 SELL +40 pips
💸 BTC/USD BONUS TRADES (Weekend)
🔻 SELL +200 pips
🟢 BUY +2,300 pips
📊 WEEKLY STATS
🏆 GOLD NET PIPS: +2,265
💰 BTC/USD NET PIPS: +5,000
🚀 TOTAL GAIN: +7,265 pips
📈 RESULT: 38 Signals → 34 Wins | 3 SL | 1 BE
🎯 WIN RATE: 89%
🔥 Summary:
Strong GOLD momentum + explosive BTC performance!
Discipline and precision continue to deliver massive results 💪📈
👏 Congratulations if you profited! ✅✅✅🚀🚀🚀

Bulls Regain Control!Is 4100 the Next Big Target?After touching the 3945-3955 area three times during the week, gold rebounded quickly and showed a clear lower shadow in the candle chart. It also showed an oscillating upward structure in the short-term structure, and formed a secondary springboard in the 3970-3980 area to rise again, and closed above 4010 on Friday. It can be seen that after the gold pullback, the bulls regained dominance and continued the bullish trend.
The short-term technical structure is biased towards bulls, the center of gravity is gradually moving up, and the buying support below is strong. I believe that gold still has the potential to continue to rise. The current short-term resistance of gold is in the 3930-3940 area. Once gold breaks through this resistance area, it could retest the previous highs of 3950-3960, or even extend its upward trend to around 4100.
So, how do you execute the trade next? I think we can consider going long on gold when it retraces to the 4000-3990 area, initially aiming for a short-term upside target of the 4030-4040 area.
Gold is showing renewed bullish momentum as buyers defend the 3970 zone.
Could this be the start of another strong rally toward 4100?
Follow me for real-time gold insights &to my traders' channel for exclusive setups!

GOLD Potential Short!
HI,Traders !
#GOLD is growing Nicely but will
Soon hit a horizontal resistance
Of 4049.41 so after the
Retest a local bearish
Pullback is to be expected !
Comment and subscribe to help us grow !

GOLD (XAUUSD): Correction is Over?!
Looks like Gold has completed a correctional movement
that it initiated yesterday.
A confirmed bullish Change of Character on a 4h time frame
that happened after a test of a strong intraday support suggests
a strong bullish pressure.
I expect a rise to 4039
❤️Please, support my work with like, thank you!❤️
I am part of Trade Nation's Influencer program and receive a monthly fee for using their TradingView charts in my analysis.

GOLD Epic Bearish Breakout!HI,Traders !
#GOLD made an epic
Bearish breakout of a very
Strong key horizontal level
Of 4003.24 which is now a
Resistance and the breakout
Is confirmed so we are
Bearish biased and we will
Be expecting a further
Bearish move down !
Comment and subscribe to help us grow !

Gold Roadmap After Breaking $4,000 – What’s Next?Gold ( OANDA:XAUUSD ) continued its bullish momentum at the start of the week and even seems to have broken through the key psychological resistance at $4,000 .
Let me first point out that when an asset reaches a new All-Time High (ATH) , Technical analysis tends to become less reliable since there’s no historical price data above that level. However, we still do our best to analyze the market using the available tools .
Currently, Gold is moving near the upper lines of ascending channels and within the Potential Reversal Zone(PRZ) .
From an Elliott Wave Theory perspective , it appears that gold is completing Wave 3 , given the strong momentum it has shown.
That said, Gold likely needs a correction before continuing its uptrend. This pullback could first test the Support lines(First Target) , and in the next stage, possibly reach around $3,963(Second Target) .
Stop Loss(SL): $4,109
Please respect each other's ideas and express them politely if you agree or disagree.
Gold Analyze (XAUUSD), 1-hour time frame.
Be sure to follow the updated ideas.
Do not forget to put a Stop loss for your positions (For every position you want to open).
Please follow your strategy; this is just my idea, and I will gladly see your ideas in this post.
Please do not forget the ✅ ' like ' ✅ button 🙏😊 & Share it with your friends; thanks, and Trade safe.

Gold (XAU/USD) Rebound Setup – Support Holding StrongAnalysis:
Gold (XAU/USD) is showing signs of bullish strength after testing the $4,000–$3,970 support zone, where buyers are stepping back in. The recent consolidation above support suggests a potential reversal and continuation of the uptrend.
The setup highlights:
Support Zone: Around $3,970 – $4,000, acting as a key accumulation area.
Bullish Trigger: A breakout above minor resistance could drive momentum higher.
Targets:
🎯 Target 1: $4,101
🎯 Target 2: $4,150
🎯 Target 3: $4,200
Stop Loss: Below $3,970 to protect against a downside breakout.
📈 Outlook: As long as price sustains above support, Gold remains bullish, aiming for a breakout towards $4,150 and $4,200 levels.

Gold XAUUSD Breakout Setup | VWAP and Market Structure Explained📊 Gold (XAUUSD) Analysis
Gold remains in a bullish trend overall 💪. On the 30-minute timeframe, price is approaching a key level of resistance near the previous swing high.
📈 The VWAP bands show price pressing up toward the first deviation, suggesting momentum remains strong — but this is also where we often see short-term reactions.
💡 Trade idea:
If price can break above the previous high and the first VWAP deviation, then a retrace and retest of that level could offer a potential long opportunity for continuation 🏹.
However, if this setup fails to materialize and price rejects from the current zone, we abandon the long idea and wait for clearer confirmation.
⚠️ Disclaimer: This content is for educational purposes only and not financial advice.

ElDoradoFx PREMIUM 2.0 – (09/10/2025, London Session)Market Bias: Neutral–Bullish (possible upside recovery if 4,030 holds)
Overall Trend: Still bullish on the higher timeframes, though intraday correction continues from 4,059 high.
⸻
🔍 Daily (D1) Outlook
• Gold is in a strong uptrend, supported by 20 EMA (3,998) and 50 EMA (3,867).
• Yesterday’s candle printed a small rejection wick from 4,059 – signaling exhaustion but not reversal yet.
• RSI at 78 → near overbought, indicating limited room for immediate upside before a pullback.
• MACD still positive and widening → medium-term bullish trend intact.
📈 Daily Bias: Trend bullish unless price closes below 3,998 support.
⸻
⏱ 1H (H1) Outlook
• Gold is consolidating between 4,018 – 4,045 inside a minor descending channel within the broader uptrend.
• A bounce from the ascending green trendline aligns with the 20 EMA support (4,030).
• MACD histogram showing smaller red bars → bearish momentum fading.
• RSI ~49 → neutral, showing indecision before London volatility.
• Structure still forming higher lows, maintaining bullish pressure.
🟢 If gold holds above 4,030, a recovery toward 4,045–4,059 is likely.
🔴 Break below 4,018 would confirm short-term bearish continuation to 4,010–3,995.
⸻
⏱ 15M (M15) Outlook
• Gold is coiling between 4,018–4,038 forming a symmetrical triangle, often a precursor to breakout volatility.
• EMA alignment remains positive (20 > 50 > 200).
• MACD turning flat → early consolidation before possible breakout.
• RSI hovering near 50, indicating balanced market.
📍 Key observation: This compression phase will likely break during London — direction will depend on whether 4,045 (upper boundary) or 4,018 (lower boundary) gives way first.
⸻
⏱ 5M (M5) Scalping View
• Range-bound structure within 4,030–4,038.
• Minor liquidity sweeps above and below confirm low-volume accumulation.
• Short-term EMAs crossing upward → micro bullish hint.
💡 Scalpers may watch for breakout candle closes with volume confirmation.
⸻
✨ Fibonacci Golden Zone
Using the latest swing from 3,984 → 4,059, the retracement levels are:
• 38.2% → 4,032
• 50% → 4,021
• 61.8% → 4,010
➡️ Golden Zone: 4,032 – 4,010 (buy interest area if retested with confirmation).
✅ Confluence: aligns with ascending trendline + 1H EMA + psychological support 4,030.
⸻
⚡ Breakout & Retest Levels
Direction Breakout Zone Retest Confirmation Target Zones
Bullish Above 4,045–4,051 Retest 4,041–4,043 4,059 → 4,072 → 4,085
Bearish Below 4,018–4,010 Retest 4,014–4,016 3,995 → 3,984 → 3,970
⸻
📊 Indicators Summary
Indicator Reading Bias
RSI (H1) 49 ⚪ Neutral
MACD (H1) Fading red histogram 🟢 Bullish recovery building
EMAs (20/50/200) Upward aligned 🟢 Bullish structure
Parabolic SAR Below price 🟢 Supportive trend
Volume Decreasing ⚠️ Low volatility before London open
⸻
📅 Fundamental Outlook – London Session
• No major UK data early session.
• Focus on US CPI (tomorrow) → traders may stay cautious.
• DXY stabilizing near 104.70, showing slight weakness, giving gold potential upside room.
• US yields steady; sentiment neutral-to-slightly risk-on.
⸻
✅ Summary
Gold remains inside consolidation but still bullish on structure.
Price is testing a key support zone (4,030–4,018) within the golden zone, where buyers may re-enter.
📈 Buy Scenario (High Probability):
Hold above 4,030 → possible rally to 4,045 → 4,059 → 4,072.
Confirmation: breakout and retest above 4,045.
📉 Sell Scenario (Alternative):
Break and retest below 4,018 → 4,010, opens deeper correction to 3,995–3,984.
🎯 Fibonacci Golden Zone: 4,032 – 4,010 (buy interest area).
⚠️ Invalidation: Close below 4,010 = short-term bearish shift.
