10/9: Sell Orders Above 4050 Profited, Watch Support Around 4000In yesterday’s session, we clearly indicated that if gold breaks above 4050, traders should look for short opportunities — and this move has indeed delivered impressive profits.
At present, the price is testing the 30-minute chart support area, though it is relatively weak. The key support zone lies on the 1-hour chart, around 4000–3990.
From a strategic perspective, if the rebound fails to break above 4038, it signals weakening bullish momentum. In this case, selling near the highs remains the preferred approach while monitoring support around 4011–4000. If the support holds, short-term buying opportunities may arise.
Be cautious when heavy selling pressure appears — close short-term positions promptly. Traders may choose to adopt a scalping approach for quick profits or consider a medium-term long position, though the latter requires stronger account capacity and risk tolerance.
Xauusdsignals

ElDoradoFx PREMIUM 2.0 - (09/10/2025, Asia Session)Current Price: 4,041
Session Bias: Neutral-to-bullish (possible continuation if 4,031 holds)
Market Structure: Gold consolidating after major rally, forming a potential re-accumulation phase inside an ascending channel.
⸻
🕐 1️⃣ DAILY TIMEFRAME (D1)
• The daily candle closed bullish but with a long upper wick, showing rejection near 4,059.
• Structure remains firmly bullish, with price holding well above both EMAs:
• 20 EMA: 3,978
• 50 EMA: 3,867
• MACD still positive, histogram extended but flattening → momentum slowing.
• RSI at 78, signaling overbought conditions.
• Parabolic SAR remains below price → trend intact.
Summary:
The daily trend remains bullish, but a short-term consolidation or correction is likely before a new leg higher toward 4,070–4,090.
⸻
⏱ 2️⃣ H1 TIMEFRAME
• Gold is moving inside an ascending channel, currently holding mid-range.
• Support area between 4,033–4,018; resistance around 4,047–4,059.
• The latest candles show lower highs forming, signaling potential temporary compression before breakout.
• MACD histogram slightly negative, confirming minor correction mode.
• RSI at 54 → neutral, suggesting possible bounce from support if buyers defend structure.
• The 20 EMA (4,039) and 50 EMA (3,985) remain bullishly aligned → trend still intact.
Observation:
Asia could open with consolidation between 4,030–4,050 before a breakout. Bulls will likely defend the 4,033–4,018 zone for a re-entry attempt.
⸻
📉 3️⃣ M15 TIMEFRAME
• Price building a descending wedge structure — typically a bullish continuation pattern.
• Immediate support: 4,033–4,030
• Resistance: 4,047–4,051 (weak high)
• Fibonacci retracement from 3,984 → 4,059:
• 38.2% = 4,032
• 50% = 4,021
• 61.8% = 4,010
➤ Golden Zone = 4,032 – 4,010
• MACD histogram red but contracting — bears losing pressure.
• RSI at 47, near mid-level → awaiting a confirmed impulse.
Summary:
The wedge plus golden zone suggest a potential bullish rebound if Asia session liquidity sweeps below 4,030–4,018 and reclaims above 4,033.
⸻
⚡ 4️⃣ M5 TIMEFRAME (SCALPING STRUCTURE)
• Market is ranging 4,032–4,046, inside compression.
• Minor CHoCH and BOS signals visible between candles, confirming short-term equilibrium.
• MACD showing convergence → early sign of potential breakout build-up.
• RSI around 48 → balanced.
Scalping Areas:
• Buy scalp: from 4,033–4,028, confirmation candle close above 4,035, SL ≤ 60 pips.
• Sell scalp: only if clean break below 4,018, retest, and rejection candle appears.
⸻
✨ FIBONACCI GOLDEN ZONE (Current Swing: 3,984 → 4,059)
Retracement Level Price
38.2% 4,032
50% 4,021
61.8% 4,010
➡️ Golden Zone = 4,032 – 4,010 → Primary buy interest area if retested with bullish confirmation.
⸻
🚨 BREAKOUT & RETEST LEVELS TO WATCH
Direction Breakout Zone Retest Confirmation Target Zones
Bullish Above 4,051–4,059 Retest 4,047–4,050 4,066 → 4,072 → 4,085
Bearish Below 4,018–4,010 Retest 4,014–4,016 4,000 → 3,990 → 3,970
⸻
🧭 ASIA SESSION OUTLOOK
• Base Case (65% probability):
Gold remains in consolidation early Asia, possibly sweeping 4,030–4,018 (Golden Zone) before resuming upward movement to 4,060–4,072.
• Alternative (25% probability):
Extended sideways compression 4,030–4,050 until London.
• Low Probability (10%):
Strong bearish break below 4,010 leading to deeper correction 3,990–3,970.
⸻
✅ SUMMARY
Gold remains bullish overall, but currently accumulating near intraday support after rejection at 4,059.
Asia is expected to be range-bound with a bullish bias, focusing on:
• Buy interest zone: 4,032–4,010 (Golden Zone)
• Breakout confirmation: above 4,051 for 4,060–4,072 extension.
• Invalidation: below 4,010 structure.
Bias: 🟢 Bullish above 4,018
⚪ Neutral 4,018–4,010
🔴 Bearish below 4,010
⸻
🥇 ElDoradoFx PREMIUM 2.0 – PERFORMANCE 08/10/2025 📱
📊 DAILY MARKET RESULTS
✅ SELL +60 pips
✅ BUY +20 pips
✅ BUY +40 pips
💸 BTC/USD +1,700 pips
✅ SELL +110 pips
✅ BUY +20 pips
❌ SELL –40 pips (SL)
✅ BUY +210 pips
❌ SELL –40 pips (SL)
✅ BUY LIMIT +40 pips
---
🏆 GOLD TOTAL PIPS WON: +420 pips
📱 BTC/USD TOTAL: +1,700 pips
📈 COMBINED GAIN: +2,120 pips
📊 RESULT: 10 Signals → 8 Wins | 2 SL
🎯 ACCURACY: 80 %
---
🔥 Solid day of profits with powerful BTC moves and consistent gold trades!
Another step toward closing the week in style 💪📈
👏 Congratulations if you profited ✅✅✅🚀🚀🚀

GOLD (XAUUSD): The Next Psychological Resistances
Gold successfully reached 4000 psychological resistance and broke through that.
Here are the next potentially significant structures:
Resistance 1: 4048 - 4052 area
Resistance 2: 4098 - 4102 area
For now the price is testing 4050 psychological resistance.
Its breakout will push the prices to Resistance 2.
❤️Please, support my work with like, thank you!❤️
I am part of Trade Nation's Influencer program and receive a monthly fee for using their TradingView charts in my analysis.

Pullback Alert: Gold Feeling the Heat at 4000As expected, gold continued to rise to the 3985-3995 area, reaching a high of around 3991, just a hair away from 4000. According to my calculations, the current resistance area of gold is located in the 3985-3995 area (for the specific calculation process, please refer to the previous trading idea). Therefore, I believe that within this range, we can begin to test the top and short gold.
Moreover, from the short-term performance, although gold still maintains a bullish trend, the short-term rise has been suppressed and the recent rise has weakened. Moreover, after the continuous rise in gold prices, the risk of chasing the rise has increased significantly. We must be cautious about the current rise and guard against signs of profit-taking at market highs. Moreover, gold has repeatedly reached highs in the 3980-3990 area. Repeatedly reaching highs in a limited area is likely to mean that gold will usher in a wave of irreversible pullbacks in the short term.
In addition, we need to focus on the area near 3960. If gold can still stay above 3960 during repeated pullbacks, then gold will still maintain its current strong position, or at least maintain high-level fluctuations; if gold falls below the area near 3960 during the pullback, then gold may continue the pullback trend and is expected to continue to 3930, or even around 3900.
So for the current short-term trading, I think the time is ripe to short gold, and I have already shorted gold according to the above trading plan. Now I just need to wait patiently for gold to pull back and make a substantial profit!

4000 in Sight, But the Pressure’s On—Pullback Ahead?It is obvious that gold is currently in a very strong bullish trend. As far as the current market is concerned, there are not many reference points above. In the short term, perhaps only the 4000 mark is worth paying attention to. However, it should be emphasized that when market sentiment is high and gold prices continue to rise, volatility may increase significantly and the risk of chasing the rise will increase significantly. From the current perspective, the short-term upward trend has been suppressed, and there is obvious pressure near the 3980 level. Therefore, we must be cautious about the current rise and guard against signs of profit-taking at market highs.
After the strong rise in gold, the current short-term support is obviously in the 3935-3925 area, followed by the 3905-3895 area. If gold cannot effectively fall below these two key support areas, gold will continue to maintain its current strong bullish trend; in addition, we can infer the current resistance area from volatility.
1. First Wave: Gold rose from around 3628 to around 3791, a fluctuation of nearly $165.
2. Second Wave: Gold rose from around 3718 to around 3895, a fluctuation of nearly $175.
3. Current Wave: Gold began its rise from around 3819. Extrapolating upward by $165-175, the resistance area for this phase is 3985-3995.
Therefore, it can be inferred that the short-term resistance at the current stage is in the 3985-3995 area. If the gold market cannot provide a suitable entry position to execute a long trade, then we can consider shorting gold with the 3985-3995 area as resistance; under appropriate circumstances, we can even consider entering the market early to short gold, first targeting the short-term retracement target: 3945-3935 area.

ElDoradoFx PREMIUM 2.0 – US FORECAST (07/10/2025)
Gold is trading around 3,971, showing renewed bullish strength into the early US session after rejecting the 3,955–3,946 demand zone during London.
The market continues its primary uptrend, though price is now retesting the previous supply zone 3,972–3,977, where bulls previously lost momentum.
Momentum indicators confirm intraday buying pressure but highlight overextension — signaling a possible reaction or rejection before any continuation.
⸻
🔍 Technical Outlook
Daily Chart (D1):
• Strong bullish trend remains dominant, with price far above 20 EMA (3,914) and 50 EMA (3,837).
• RSI (78) → extremely overbought, suggesting the market is nearing exhaustion.
• Parabolic SAR remains below price, confirming bullish structure; however, a close below 3,950 would trigger a correction signal.
• Upside targets remain 3,985 – 4,000, but limited unless US dollar weakens sharply.
1H Chart (H1):
• Structure remains bullish after a BOS (Break of Structure) above 3,965.
• Price is forming higher lows and higher highs; however, current candle shows signs of rejection at 3,972–3,977 (supply zone).
• RSI ~63 → moderate bullish momentum.
• MACD turning positive again with histogram expanding — buyers remain in control.
• 20 EMA (3,961) and 50 EMA (3,949) → immediate support levels to monitor.
15M Chart (M15):
• Strong bullish leg formed after a double-bottom at 3,946 with a confirmed CHoCH (Change of Character).
• Price now testing Fibonacci resistance and supply area 3,972–3,977.
• RSI at 70+ → overbought short term.
• MACD positive but showing early signs of slowing momentum — a retest to 3,965 before continuation is likely.
5M Chart (M5):
• Short-term bullish channel intact.
• MACD histogram remains green, RSI above 65 → intraday bullish continuation bias.
• Possible minor retracement toward 3,964–3,961 for liquidity grab before continuation.
• No bearish divergence yet; structure favors intraday buys on pullbacks.
⸻
✨ Fibonacci Golden Zone
Drawn from 3,946 swing low → 3,977 swing high:
• 38.2% → 3,965
• 50% → 3,962
• 61.8% → 3,958
➡ The Golden Zone (3,965–3,958) aligns with strong EMAs and intraday trendline confluence.
A bounce from this zone would offer high-probability bullish setups for continuation toward 3,977 → 3,985 → 3,990.
⸻
🎯 High Probability Entries
Scalping Setups (M5–M15, ≤60 pips SL):
• Buy Setup #1: Buy at 3,965–3,958 (Golden Zone) after rejection or engulfing candle.
🎯 Targets → 3,972 → 3,977 → 3,985
🛑 SL below 3,952 (60 pips)
• Buy Setup #2: Buy above 3,977 breakout & retest.
🎯 Targets → 3,985 → 3,995 → 4,000
🛑 SL below 3,972 (50–60 pips)
• Sell Setup: Only valid if rejection occurs at 3,977–3,985 zone with bearish engulfing confirmation.
🎯 Targets → 3,965 → 3,958 → 3,946
🛑 SL above 3,985 (60 pips)
⸻
📅 Fundamental Outlook – US Session
• Today’s main catalyst: Fed Chair Powell’s remarks (late session).
• US Dollar Index (DXY) trading around 104.90, stable but showing slight weakness — supportive for gold.
• US Treasury yields are softening, which typically fuels gold demand.
• No major data releases, so market likely to follow technical structure unless Powell’s tone shifts sentiment.
Sentiment: Cautiously bullish — intraday momentum favors dips for continuation, but rejection near 3,977 must be watched closely.
⸻
⚠ Key Levels to Watch
Resistance: 3,972 – 3,977 / 3,985 / 3,995 – 4,000
Support: 3,965 / 3,958 – 3,952 / 3,946 – 3,940
⸻
✅ Summary
Gold maintains bullish momentum above 3,965 but enters a critical resistance zone (3,972–3,977).
The Golden Zone (3,965–3,958) remains the best area to seek new longs on dips.
Only a confirmed breakout above 3,977 opens the path to 3,985–4,000,
while rejection here could trigger short-term pullback to 3,958–3,946 before any continuation.
Bias for US session:
➡ Bullish above 3,958
⚠ Bearish only if 3,946 breaks with strong volume
— ElDoradoFx PREMIUM 2.0 – Deep Analysis Team

Ride Both Sides:Short Now, Long Later!Gold continues to rise and hit new highs, and the current high has reached around 3977. There is no doubt that the current gold market maintains a strong bullish trend. From the perspective of market sentiment, the only high point worth paying attention to in the short term is the 4,000 mark. There are currently no other high points that can be used as an effective reference. However, given the extreme highs, caution is advised regarding the current rally, and be wary of signs of profit-taking at market highs.
Two key support areas of note are currently located between 3930 and 3920, and between 3905 and 3895.If gold cannot effectively fall below these two key support areas, gold will continue to maintain a strong bullish trend and may hit 4000 in a short period of time; once gold falls below the above two key support areas during the retracement process, gold may continue to repair the retracement trend to the 3880-3860 area.
Therefore, in terms of short-term trading, because gold will fall back every time it hits a new high, remember not to go long on gold directly at a high level. You should grasp the rhythm of gold fluctuations. You can consider shorting gold in the 3965-3975 area, and then wait for gold to retreat to the area around 3930-3920 before considering going long on gold appropriately.

GOLD (XAUUSD): 4000 Soon?!
Gold was strongly bullish on Monday, updating the ATH again.
The next psychological resistance is 4000.
I think that the price will reach that soon.
We will probably see a pullback first.
You can consider the underlined supports, especially Horizontal Support 1
and a Vertical Support 1 for buying after a pullback.
❤️Please, support my work with like, thank you!❤️
I am part of Trade Nation's Influencer program and receive a monthly fee for using their TradingView charts in my analysis.

ANFIBO | XAUUSD Weekly Plan [10.6 - 10.10.2025]Hi traders, Anfibo is here!
XAUUSD Analysis – Daily Trading Plan
Overall Picture:
Gold’s bullish trend remains extremely clear, reflecting the market’s strong confidence in this safe-haven asset amid ongoing global economic and geopolitical uncertainties. The continuous series of new ATHs highlights that buyers are firmly in control of the market.
However, from a technical perspective, the $4,000/oz level stands out as a significant psychological round-number resistance. This zone also coincides with the Monthly Fibonacci extension target, making it highly likely that profit-taking will emerge once price approaches this level. Any reaction here will largely depend on external factors and key news events, which must be closely monitored.
Technical Outlook:
Primary Trend: Strong bullish momentum on both Daily and Monthly timeframes.
Momentum: Still positive, though $4,000 may trigger short-term corrections.
> SUPPORT KEY / BUY ZONES : 3800- 3787 - 3750 - 3723 - 3713 - 3703
> RESISTANCE KEY / SELL ZONES : 3825 - 3835 - 3865 - 3880
Trading Plan for Today:
>>> SELL ZONE:
(1) ENTRY: 3969 - 3973
SL: 3976
TP: 3900 - 3890
(2) ENTRY: 3995 - 4005
SL: 4010
TP: 3900 - 3800 - ...
>>> BUY ZONE:
ENTRY: 3885 - 3900
SL: 3880
TP: 3940 - 3970 - 3995 - ...
Risk Management:
- Maintain a minimum Risk:Reward ratio of 1:2.
- Manage position sizing carefully; avoid overtrading at psychological highs.
- Monitor U.S. economic data and geopolitical news closely, as these could act as catalysts for corrective moves.
Conclusion:
Gold remains in a powerful bullish cycle with no signs of cooling down yet. However, the $4,000/oz mark is a critical psychological and technical barrier where corrective pullbacks are likely to occur. Traders should continue to favor long setups but remain vigilant around this zone, closely observing price reactions to refine their strategies.
WISH EVERYONE A PROFITABLE NEW WEEK!

Gold Price Outlook – Trade Setup (XAU/USD)📊 Technical Structure
OANDA:XAUUSD TVC:GOLD Gold (XAU/USD) continues its strong upward momentum, currently trading around $3,974 after printing fresh all-time highs above the $3,950 threshold. On the intraday chart, price action remains within an ascending channel, with immediate support at $3,955–$3,959 (support zone + trendline confluence). If this area holds, bulls may attempt another push toward the $3,990–$3,995 resistance zone, where profit-taking could emerge.
Momentum indicators remain in overbought territory, suggesting the potential for short-term pullbacks before the next leg higher. Failure to defend the $3,955 level could open the door toward $3,930–$3,920, but the broader uptrend structure remains intact as long as price holds above $3,900.
🎯 Trade Setup
Entry (Buy): $3,955 – $3,959 (support zone / channel bottom retest)
Stop Loss: $3,953
Take Profit 1: $3,990
Take Profit 2: $3,995 – $4,000 (psychological level)
Risk–Reward Ratio: ~1 : 5.78
🌍 Macro Background
Gold’s rally is fuelled by political turmoil and safe-haven demand. Japan’s LDP leadership change, France’s government instability, and the ongoing US government shutdown have amplified market uncertainty. Additionally, comments from Fed officials highlight policy caution, with traders still pricing in a 94% probability of an October Fed rate cut.
The Dollar has weakened despite risk aversion, as markets increasingly expect Fed easing to counteract slowing growth and labour market risks. In such an environment, gold remains well-supported, especially with investors hedging against heightened political risk.
🔑 Key Technical Levels
Resistance: $3,990 – $3,995, $4,000 (psychological level)
Support: $3,955 – $3,959
📌 Trade Summary
Gold remains in a strong bullish structure, but intraday charts show potential for pullbacks toward support before buyers step back in. A buy-on-dip strategy near $3,955 looks attractive with upside targets at $3,990 and $4,000. Macro uncertainty continues to favour safe-haven flows into gold, keeping dips well-bid.
⚠️ Disclaimer
This analysis is for reference only and does not constitute trading advice. Trading involves significant risk, and proper risk management is essential.

Smart Money Strategy: Short Now, Go Long LaterAs I expected, gold touched around 3950 during the rise. According to the current structure, gold is currently in a very strong bullish trend, the market has a strong bullish consensus, and gold still has room to continue to rise. If gold can break through 3950 during the rise, it may open up space to higher levels.
However, it should be emphasized that when market sentiment is high and gold prices continue to rise, volatility may increase significantly and the risk of chasing the rise will increase significantly. From the current perspective, the short-term upward trend has been suppressed, and there is obvious pressure near the 3950 level, so gold may show signs of pullback in the short term.
To be honest, although gold prices have risen sharply, there have not been many opportunities to enter the market and go long on gold during the rise. So I have already shorted gold in the 3930-3950 area according to the previous trading strategy. First aim for the retracement target: 3920-3910 area.

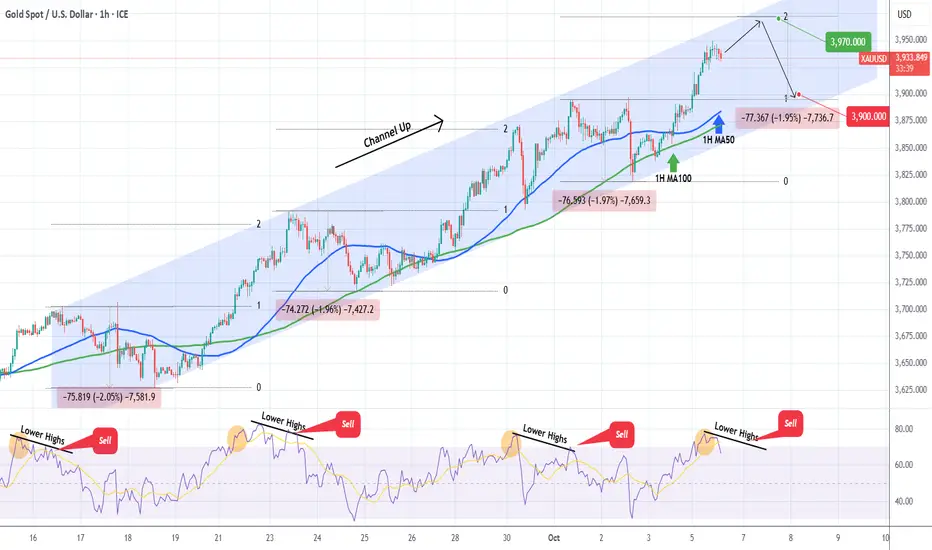
XAUUSD made new ATH. What's next?Gold (XAUUSD) gave us an excellent buy signal last week (September 29, see chart below), easily hitting our 3860 upside Target:
This time, the price is extending the Bullish Leg of the 3-week Channel Up, which according to the 1H RSI, should peak soon. The last two did so on the 2.0 Fibonacci extension.
That should take us to 3970, which would be right at the top of the Channel Up (Higher Highs). A 1H RSI Lower Highs rejection would be the sell signal, targeting the 1H MA100 (green trend-line), like both previous Bearish Legs did, at 3900.
-------------------------------------------------------------------------------
** Please LIKE 👍, FOLLOW ✅, SHARE 🙌 and COMMENT ✍ if you enjoy this idea! Also share your ideas and charts in the comments section below! This is best way to keep it relevant, support us, keep the content here free and allow the idea to reach as many people as possible. **
-------------------------------------------------------------------------------
💸💸💸💸💸💸
👇 👇 👇 👇 👇 👇
Bulls on Fire! The 4000 Challenge BeginsWhen summarizing the trading on Sunday, it was clearly pointed out that gold would inevitably hit 3900 or even 3930 this week. However, it was unexpected that gold had reached 3920 so early. Although it retreated slightly after reaching around 3920, according to the current structure and trend, the bull trend has not ended yet and there is still room for growth.
Since gold has once again broken through the recent high of 3895, the double top structure constructed in this horizontal area has become invalid and temporarily has no resistance effect. In fact, after the top and bottom conversion, this position area may play a supporting role to a certain extent in the future. As gold breaks through 3900, market bullish confidence may expand unprecedentedly, and the enthusiasm for buying will be pushed to another level. As the center of gravity of gold moves up, the current technical structural support has moved up to 3880-3870; and the strong support is located in the 3850-3840 area.
If gold cannot effectively fall below these two key support areas during the retracement. Gold will continue to maintain its bullish trend and continue its strong upward trend. It is even expected to continue to set new highs and reach around 3930 or even 3950. Once gold rises and breaks through 3950, the 4000 mark will follow!
So in terms of short-term trading, we can first try to start buying gold in small batches in the area around 3880-3870. After all, the entry price is relatively high, so we must control the lot of transactions and set up protection.
If you want to continue to follow and pay attention to my trading strategies and signals, be sure to follow me!

Gold Price Outlook – Trade Setup (XAU/USD)📊 Technical Structure
OANDA:XAUUSD Gold (XAU/USD) surged toward $3,924 before encountering resistance near the $3,950 zone, which aligns with an extended overbought condition on the short-term charts. Price remains supported by the ascending trendline from September lows, with immediate demand located around $3,878–$3,887.
If bulls defend this support zone, a fresh rebound toward $3,942 → $3,950 resistance is likely.
A rejection from the resistance zone could trigger consolidation or a pullback back toward the $3,878 support.
🎯 Trade Setup
Entry: Buy near $3,878–$3,887 (support zone retest)
Stop Loss: $3,875
Take Profit 1: $3,942
Take Profit 2: $3,950
Risk/Reward: ~1 : 5.16
🌍 Macro Background
Gold remains underpinned by Fed rate cut expectations, with markets pricing a 99% chance of a 25bps cut at the October meeting. The ongoing US government shutdown has delayed key macro data, intensifying safe-haven demand.
Hawkish remarks from Dallas Fed’s Logan briefly supported the US Dollar, but the market consensus points toward further easing.
Political uncertainty in Washington, combined with fragile labour market signals (ADP showing -32k jobs, ISM Services PMI down to 50), continues to support the bullish bias for gold.
🔑 Key Technical Levels
Resistance: $3,942 / $3,950
Support: $3,878 / $3,887
📌 Trade Summary
Gold remains technically bullish above $3,878 support, with near-term upside toward $3,950 as long as Fed rate cut expectations dominate sentiment. Any decisive break below $3,875 would neutralize the bullish bias and open a correction toward $3,820.
⚠️ Disclaimer
This analysis is for reference only and does not constitute trading advice. Trading involves significant risk, and proper risk management is essential.

ElDoradoFx PREMIUM 2.0 - ASIA FORECAST - 06/10/2025Gold is trading around 3,886, holding just under the recent swing high (3,896–3,894) after a bullish continuation. The market is consolidating in a tight range while buyers defend support and await new catalysts.
⸻
🔍 Technical Outlook
Daily Chart (D1):
• Strong bullish structure intact, with price above the 20 EMA (3,846) and 50 EMA (3,791).
• RSI (78) → near overbought, suggesting limited upside unless momentum strengthens.
• Daily candle shows slowing momentum; still bullish but vulnerable to retracement if 3,862 fails.
1H Chart (H1):
• Price consolidating between 3,880–3,896 resistance and 3,862 support.
• MACD is positive but flattening, showing buyers losing short-term strength.
• Market structure: higher highs remain intact; 3,862 is the intraday key breakout/rejection zone.
15M Chart (M15):
• Price rejected 3,889–3,896 zone twice, creating short-term equal highs.
• A base is forming around 3,883–3,880. If broken, correction may extend toward 3,870.
• RSI ~55 → neutral, but momentum fading on lower TFs.
5M Chart (M5):
• Buyers defending 3,883, forming higher lows.
• Resistance remains at 3,889–3,896.
• Short-term indicators show mixed signals: MACD flattening, RSI ~58, suggesting potential breakout but risk of rejection if liquidity isn’t strong.
⸻
✨ Fibonacci Golden Zone
From 3,843 low → 3,896 high, the golden retracement sits at 3,870–3,862.
• If Asia session pulls back into this zone and holds, high probability for bullish continuation.
• A clean break below 3,862 = shift in structure toward deeper retracement (3,843 → 3,820).
⸻
🎯 High Probability Entries (Not Scalping – Asia Focus)
Bullish Setup:
• Buy if price retests and holds 3,870–3,862 golden zone, target 3,889 → 3,896 → 3,910.
• SL below 3,855 (50–55 pips).
Bearish Setup:
• Sell only if price rejects 3,889–3,896 zone again with bearish confirmation.
• Target 3,870 → 3,862.
• SL above 3,902 (60 pips).
⸻
📅 Fundamental Outlook – Asia Session
• No major Asian data expected today.
• Market will position for US ISM PMI & Fed speakers later → possible volatility in NY.
• DXY remains firm near recent highs; if USD strengthens further, gold may face rejection under 3,896.
⸻
⚠ Key Levels to Watch
• Resistance: 3,889 – 3,896 / 3,910
• Support: 3,880 / 3,870 – 3,862 / 3,843
⸻
✅ Summary
Gold remains bullish overall, consolidating below 3,896 resistance. The golden zone 3,870–3,862 is the key for continuation; if it holds, expect buyers to push back toward 3,896 → 3,910. However, repeated rejection under 3,896 could trigger a correction into 3,870 → 3,862.

GOLD (XAUUSD): Get Ready For Breakout
Gold closed, approaching a strong horizontal resistance based on a current
All-Time High.
Following a bullish accumulation, there is a high chance that the underlined
structure will be broken, and the price will go higher.
Wait for a 4H candle close above 3897 as a confirmation,
expect a bullish continuation to 3920 then.
❤️Please, support my work with like, thank you!❤️
I am part of Trade Nation's Influencer program and receive a monthly fee for using their TradingView charts in my analysis.

Gold XAUUSD: Double Top, Volume Profile, and VWAP Trade Plan📊 Gold (XAUUSD) has been trending higher overall, but recently formed a double top followed by a significant retracement ⚡. Despite that, price action is now beginning to show signs of a shift in structure back to the upside 📈.
🔎 In the video, we review both the VWAP and the anchored volume profile as part of the trade plan. For a potential long setup, I’ll be watching for price to break above the volume profile’s Point of Control (POC) 🎯.
❌ However, if price were to break below VWAP, that would invalidate the idea and I’d step aside until the next opportunity arises.
⚠️ Disclaimer: This analysis is for educational purposes only and not financial advice. Always manage risk appropriately.

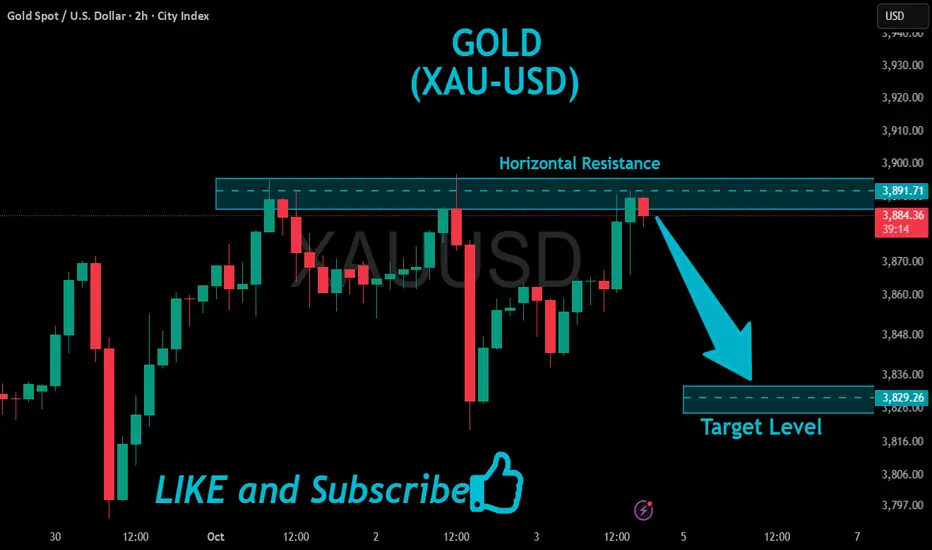
GOLD Risky Short!
HI,Traders !
#GOLD grew up fast
But then hit a horizontal
Resistance level of 3891.71
From where we are already
Seeing a nice pullback
And we will be expecting
A further local move down !
Comment and subscribe to help us grow !
Safe-Haven Demand Keeps Gold on Fire🔶 Gold Price Outlook – Trade Setup (XAU/USD)
📊 Technical Structure
Gold retreated after touching fresh highs, now consolidating between $3,844–$3,860. The chart shows repeated bounces from the ascending trendline support, suggesting buyers remain active. Key resistance stands at $3,881–$3,886, and a breakout above could open the way to $3,900 psychological level. The short-term bias remains bullish as long as support holds.
🎯 Trade Setup
Entry: $3,837–$3,843 (long)
Stop Loss: Below $3,833
Take Profit:
TP1: $3,881
TP2: $3,886
TP3: $3,900
Risk/Reward: 1 : 4.21
🌍 Macro Background
Gold remains supported by macro factors:
Fed Policy: Despite hawkish remarks from Dallas Fed President Logan warning about persistent inflation, markets are still pricing in a 99% chance of a 25bps rate cut in October. The USD has rebounded slightly, but overall sentiment remains bearish for the dollar.
Government Shutdown: The ongoing US government shutdown suspends official BLS data releases. However, September’s NFP figures are expected to be published, keeping labour market focus alive.
Labour Market: ADP report showed a surprise drop of -32K private payrolls, adding pressure on the Fed to cut rates.
Safe-Haven Demand: Rising geopolitical tensions and fiscal uncertainty continue to fuel safe-haven inflows into gold.
Despite intraday pullbacks, fundamentals remain gold-supportive.
🔑 Key Technical Levels
Resistance: $3,881 / $3,886 / $3,900
Support: $3,843 / $3,837
📝 Trade Summary
Gold is consolidating but holding critical support. As long as price sustains above $3,837, bulls retain control. The suggested long entry near $3,843 targets the $3,881–$3,886 area.
⚠️ Disclaimer
This analysis is for reference only and does not constitute trading advice. Trading involves significant risk, and proper risk management is essential.

ElDoradoFx PREMIUM 2.0 – US FORECAST (02/10/2025)🔎 XAUUSD Deep Technical & Fundamental Analysis – 02/10/2025 (US Session)
📊 Daily Chart (D1)
• Gold rejected 3,896–3,900 key resistance with a large upper wick, confirming strong supply.
• Current candle turning bearish, now pressing into 3,830 zone.
• Price remains above the 21 EMA and daily parabolic SAR, so medium-term trend still bullish but a retracement toward 3,820–3,800 support is underway.
• A daily close under 3,820 could shift momentum bearish into October.
⸻
⏰ 1H Chart
• Strong rejection after a liquidity sweep at 3,896.
• Break of structure (BOS) confirmed at 3,862 → sellers in control.
• Price testing 3,832 intraday support (last H1 low).
• MACD histogram deepening red, moving averages crossed bearish, RSI trending down.
• Unless bulls reclaim 3,860–3,862, intraday bias remains bearish.
⸻
⏱ 15M Chart
• Multiple CHoCH (change of character) moves after the sweep at 3,896.
• Strong momentum candles driving down into 3,832–3,827 liquidity pool.
• If broken, next downside targets = 3,820 and 3,805.
• Countertrend bounce possible only if 3,832 holds with divergence.
⸻
⏱ 5M Chart (Scalping Entries)
• Clear bearish momentum: continuous BOS with lower highs/lows.
• MACD & histogram deep in red, confirming strong sellers.
• Scalping levels:
• Sell continuation: Break & retest below 3,832 → TP 3,827 – 3,820. SL above 3,838 (~60 pips).
• Buy scalp (risky countertrend): If 3,832–3,827 demand holds with bullish candle pattern → TP 3,840–3,850. SL under 3,826 (~60 pips).
⸻
📌 Fibonacci Golden Zone
• From the last swing low → high, the golden retracement sits 3,820–3,832.
• This is where price is consolidating now.
• Break below 3,820 confirms bearish continuation.
• Hold above 3,832 could allow a bounce toward 3,850–3,860.
⸻
🌍 Fundamental Watch
• US ISM Manufacturing PMI (today) → already pressured gold after USD strength.
• Fed speakers later could increase volatility. Hawkish = bearish gold, dovish = bullish bounce.
• Dollar Index (DXY) firming, yields ticking higher → adds bearish bias to gold.
⸻
✅ High-Probability Trade Plans
🔻 SELL Setup (higher probability intraday)
• Entry: Break & retest 3,832.
• SL: 3,838 (≈ 60 pips).
• TP1: 3,827 / TP2: 3,820 / TP3: 3,805.
🔼 BUY Setup (countertrend scalp, lower probability)
• Entry: Bounce from 3,832–3,827 golden zone with bullish confirmation.
• SL: 3,826 (≈ 60 pips).
• TP1: 3,840 / TP2: 3,850 / TP3: 3,860.
⸻
📌 Summary:
Gold is under strong selling pressure after rejecting 3,896–3,900. The 3,832–3,820 golden zone is the key pivot.
• Break below 3,820 = bearish continuation to 3,805.
• Hold above 3,832 = possible bounce toward 3,850–3,860.
⚠️ Volatility will remain high with USD data & Fed comments today.

GOLD (XAUUSD): Next Goal - 3900
Gold looks bullish again today,
following a completion of a correctional movement after an update of the ATH yesterday.
The market was accumulating for some time within a horizontal range on an hourly time frame.
A confirmed bullish CHoCH indicates its highly probable completion.
The price will most likely continue rising now.
Goal - 3900
❤️Please, support my work with like, thank you!❤️
I am part of Trade Nation's Influencer program and receive a monthly fee for using their TradingView charts in my analysis.

ElDoradoFx PREMIUM 2.0 – GOLD FORECAST (02/10/2025)
🔎 Deep Technical Analysis (XAUUSD – 02/10/2025, London Session)
Current Price: 3,867
⸻
📈 Daily Chart
• The bullish trend remains intact with higher highs and higher lows.
• Price has tested 3,895–3,900 resistance zone, leaving an upper wick yesterday → clear sign of supply.
• Parabolic SAR dots remain bullish, but momentum is slowing.
• EMA20 sits far below at 3,771, leaving room for correction without breaking the structure.
⸻
⏳ H1 Chart
• Double top rejection forming at 3,872–3,875.
• RSI around neutral (50–55), showing lack of trend direction.
• MACD histogram contracting, signalling reduced bullish momentum.
• Key intraday support sits at 3,862–3,855. Break here → possible quick drop to 3,840–3,832.
⸻
⏱️ M15 Chart
• Price consolidates inside the Fibonacci golden zone (3,862–3,868).
• Liquidity sits above equal highs at 3,874 → if bulls break, stop runs could fuel a rally toward 3,888–3,895.
• If 3,862 fails to hold, short-term downside pressure opens into 3,855–3,852 and then 3,840.
⸻
⏱️ M5 Chart
• Sweep at 3,872 followed by immediate rejection.
• MACD flipped red with bearish momentum building.
• EMA alignment turning flat/down, suggesting short-term weakness.
⸻
🎯 Scalping Setups (Max 60 pips SL)
• Buy scalp:
• Entry: 3,862–3,864 support zone
• SL: 3,858
• TP1: 3,872
• TP2: 3,888
• Sell scalp:
• Entry: 3,872–3,874 rejection
• SL: 3,878
• TP1: 3,862
• TP2: 3,852
⚠️ Current higher probability = short scalps on failed rejections at 3,872, unless price decisively breaks above with strong volume.
⸻
✅ Overall Outlook
• Bias: Neutral-to-bearish below 3,875.
• Breakout upside trigger: 3,875 → target 3,888–3,895.
• Breakdown downside trigger: 3,862 → target 3,852–3,840.
• Golden zone (3,862–3,868) is the intraday pivot. Reactions here will define London’s move.

Gold Price Outlook – Trade Setup (XAU/USD)📊 Technical Structure
OANDA:XAUUSD Gold remains in a bullish consolidation phase after printing a fresh record high near $3,895, supported by safe-haven demand. On the 1H chart, price is consolidating between the Support Zone ($3,847–$3,840) and the Resistance Zone ($3,900–$3,905). A short-term pullback is visible, but the broader ascending channel structure remains intact, suggesting dips could be treated as buying opportunities.
🎯 Trade Setup
Entry: $3,847 (near support zone)
Stop Loss: $3,837
Take Profit: $3,900 / $3,925 (extension if momentum sustains)
Risk/Reward: ~1 : 6
🌍 Macro Background
Gold’s rally is fuelled by a weaker USD, plunging US Treasury yields, and heightened Fed rate cut expectations. According to CME FedWatch, markets are pricing in a 98% chance of a 25bps cut in October and strong odds of another in December. The US government shutdown adds a political risk premium, while softer US jobs data (ADP: –32k private payrolls in September) reinforced dovish bets. Meanwhile, geopolitical tensions (Ukraine conflict, Middle East uncertainty) continue to attract safe-haven flows.
🔑 Key Technical Levels
Resistance Zone: $3,900 – $3,905
Intermediate Resistance: $3,925
Support Zone: $3,847 – $3,840
Deeper Support: $3,800
📌 Trade Summary
Gold is consolidating below $3,900, but the supportive macro backdrop keeps the bias bullish. Any dip toward the $3,847–$3,840 support offers a favourable long setup targeting $3,905–$3,925. Traders should watch today’s US ISM Manufacturing PMI and upcoming FOMC member speeches for volatility triggers.
⚠️ Disclaimer
This analysis is for reference only and does not constitute trading advice. Trading involves significant risk, and proper risk management is essential.
