GOLD Resistance Ahead!
HI,Traders !
#GOLD is trading in an
Uptrend and Silver shot
Up sharply today and it
Is now locally overbought
So after the retest of the
Horizontal resistance above
At 3436.05 from where we
Will be expecting a local
Bearish move down !
Comment and subscribe to help us grow !
Xauusdsignals

I might be the first to start shortingAgainst the backdrop of strengthened expectations of interest rate cuts and Trump's continued tough stance, gold rose above the 3400 mark and continued to above 3410. The upward momentum was relatively strong and market sentiment was optimistic. But the more this happens, the more dangerous it feels! In fact, from a short-term perspective, the foreseeable target area above is: 3415-3425 area, which has only 100-150pips of room for growth from the current gold price. So I think there is no need to continue chasing long gold for the time being.
From the current structure, although gold is in a fluctuating upward structure, the trading volume is gradually decreasing after gold broke through 3410, proving that as gold continues to rise, the market has gradually become more cautious. Judging from the candlestick pattern, the trend line constructed from the highs of 3500 and 3440 is currently facing resistance near 3415, while the resistance of the trend line constructed from 3452 and 3440 is currently near 3425. Therefore, the current more obvious resistance area is in the 3415-3425 area. In comparison, there is a larger retracement space below, firstly in the 3395-3385 area, and then in the 3375-3365 area.
Therefore, at this stage, I will no longer aggressively chase the rise of gold; instead, I will start shorting gold in batches above 3410, and then patiently wait for gold to retrace!

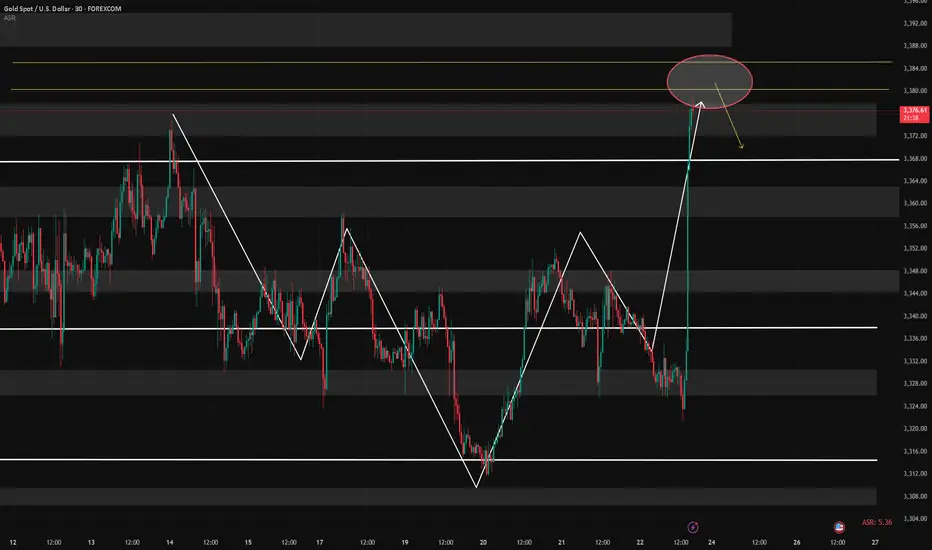
Gold (XAU/USD) – 30m – AMD (Accumulation / Manipulation / DistriGold (XAU/USD) – 30m – AMD (Accumulation / Manipulation / Distribution)
🔹 Phase 1: Accumulation
The market showed a period of range-bound price action in the lower zone, where liquidity was building up.
This phase indicates that smart money was collecting positions, creating the base for the next move.
The price respected the liquidity trendline and showed a gradual shift of demand.
---
🔹 Phase 2: Manipulation
A clear stop-hunt / liquidity grab occurred above the accumulation range.
This move is characterized by a false breakout above the consolidation zone, designed to trap early buyers.
The spike in volume and quick rejection signals the transition into distribution.
---
🔹 Phase 3: Distribution
Price moved into the 3,406 – 3,410 area, marking the distribution zone.
This is where supply overtakes demand as institutional players offload positions.
Strong rejection candles confirm sellers are active here.
Risk of reversal is high, and any long trades are considered risky at this point.
---
🔹 Outlook & Trading Plan
If price holds below 3,406, we can expect a downward continuation toward 3,377 and potentially the 3,368 liquidity pool.
Any short entry should ideally align with rejection signals in the distribution phase.
If the market breaks and sustains above 3,410, it invalidates the distribution setup and indicates continuation of bullish momentum.
---
✅ Bias: Bearish under 3,406
🎯 Targets: 3,377 – 3,368
❌ Invalidation: Above 3,410
Analysis: mohsen mozafari nejad
Adminstration of persiaux king academy

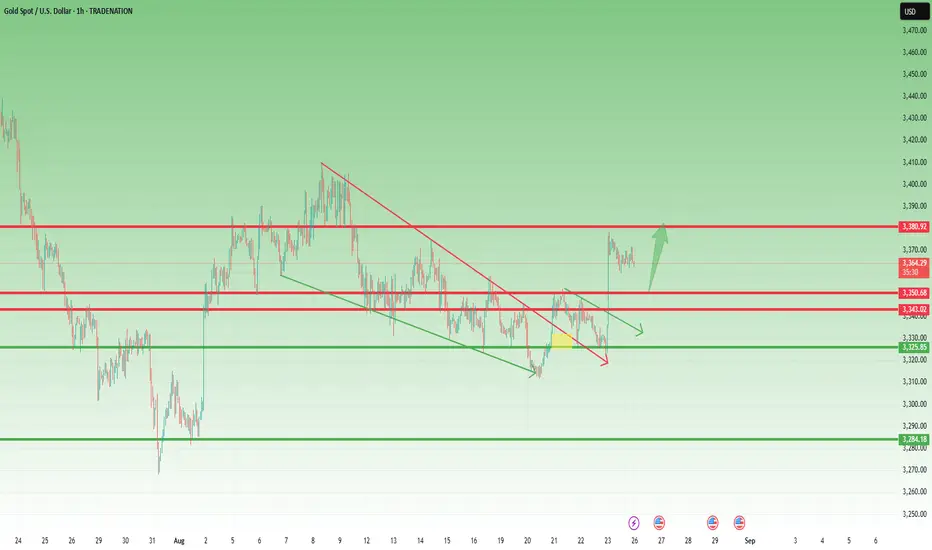
Watch Resistance at 3391–3398, Avoid Chasing HighsGold rebounded strongly from 3352 support today, breaking through the 3358–3366 resistance and rallying to 3386 before consolidating. During this phase, multiple tests of the 3368 support held firm, and price has now returned above 3380, keeping the overall bias bullish.
⚠️ However, caution is warranted: resistance is not only near 3386 but also at the 3391–3398 zone, where fresh selling pressure is likely. The upside looks limited, making blind chasing risky.
📌 Suggestion: Focus on sell opportunities around resistance. For larger accounts with proper position sizing, chasing a short-term rally may be manageable; but for smaller accounts, chasing highs carries significant risk and is not recommended.
These are my personal views for reference only. Please evaluate carefully based on your own situation. If you’d like more tailored guidance, feel free to reach out.

Gold (XAU/USD) 27 August 2025Gold continues to trade in a well-defined structure, with buyers defending higher-lows while sellers attempt to cap upside momentum near the $3400 handle. Today’s analysis blends the Daily → 4H → 1H confluences to outline execution-ready trading zones with clear invalidation and profit objectives.
🔵 Demand Zones – Where Buyers Are Positioned
📍 Primary Buy Zone: $3368 – $3373
This zone carries the strongest institutional weight for the day:
Daily higher-low structure remains intact above $3365.
4H bullish order block + fresh BOS confirmation.
ICT’s Optimal Trade Entry discount (0.618–0.705 retracement).
RSI bullish divergence on 1H; MACD slope turning positive.
Strong absorption wick confirmed at $3370 on the last sweep.
📌 Trade Plan:
Entry: $3368 – $3373
SL: Below $3360
Targets: $3395 → $3410
📍 Secondary Buy Zone: $3350 – $3355
A deeper liquidity-driven fallback demand level:
Untested 4H demand block from breakout leg.
Daily demand base aligning with sell-side liquidity resting below $3355.
MACD crossover and ATR volatility expansion on 1H support demand.
📌 Trade Plan:
Entry: $3350 – $3355
SL: Below $3345
Targets: $3380 → $3400
🔴 Supply Zones – Where Sellers Are Positioned
📍 Primary Sell Zone: $3402 – $3408
The first line of resistance for intraday traders:
4H lower-high structure aligning with Daily resistance.
Fresh bearish order block and FVG imbalance inside zone.
RSI divergence (bearish) on both 4H & 1H timeframes.
Thin volume node above $3400 → prone to rejection.
📌 Trade Plan:
Entry: $3402 – $3408
SL: Above $3415
Targets: $3388 → $3370
📍 Secondary Sell Zone: $3420 – $3426
A liquidity sweep zone with higher timeframe supply:
Daily supply block remains unmitigated.
Buy-side liquidity pool resting above $3420.
ATR extension = capped intraday volatility.
VWAP overextension favors mean reversion.
📌 Trade Plan:
Entry: $3420 – $3426
SL: Above $3435
Targets: $3400 → $3385
🟡 Executive Summary – The Golden Zone
Today’s Golden Zone is the Primary Buy Zone ($3368 – $3373).
It aligns across Daily (higher-low support), 4H (fresh bullish OB), and 1H (execution refinement). Backed by 6+ confluences, this zone offers the highest-probability continuation trade, targeting the $3410 region.
✅ Bias: Maintain bullish stance above $3365. Look for dip buys around $3368–$3373, while fading exhaustion only at defined sell zones above $3402.

Gold (XAUUSD) Set to Hit Resistance | Sell on Rise SetupGold (XAUUSD) is approaching a critical resistance zone between 3492 and 3494, where sellers have previously stepped in to push prices lower. We anticipate a similar reaction this time, presenting an opportunity to enter a short position on any upward move into this prime supply area.
🔻 Short Trade Setup – Fade the Rally
Entry: Sell Gold (XAUUSD) at 3392
Add-On: Sell more Gold (XAUUSD) if price rises to 3399
Targets: Refer to chart for detailed target zones
Invalidation: If daily closes above 3406, consider the setup invalid
📉 Risk-Reward Profile
This setup offers an attractive risk-reward ratio, particularly for short-term traders looking to capitalize on a potential rejection at resistance. Maintain tight stops and disciplined position sizing to manage risk effectively.
Gold (XAUUSD) has enjoyed a strong rally, but the odds now appear to favor a pullback. Watch price action and momentum closely within the resistance zone for confirmation.
👍 If you find this idea useful, please like and share your thoughts in the comments. Let’s build a community of sharp traders sharing insights!
🔔 Follow for more high-probability trade setups and market analysis.
Happy Trading,
– The InvestPro Team

Final Bear Profit—Then Gold Turns BullishSupported by Trump's statement and geopolitical tensions, gold continued to rise to around 3394 and is currently fluctuating narrowly around 3390.
Although the upward momentum of gold seems strong, the bulls are not resolute during the rise. Instead, they will launch an attack again after repeatedly testing the support. It is expected that the market is not highly unanimous in its agreement on the continuation of the strong bull market stimulated by the news, so the short-term volatility of gold will be exacerbated during the rise.
As gold continues to rise, it is clearly under pressure in the 3400-3410 area in the short term. Moreover, the bullish sentiment of gold has obviously weakened before facing this area, so we must consider that gold may still retreat after being under pressure in the short term. Below, we should first note the short-term support area of 3385-3375. If gold fails to effectively break below this area during a pullback, it will likely retest 3400.
Therefore, in short-term trading. At present, we can consider shorting gold appropriately in the 3390-3400 area. If gold retreats as expected, we will first observe the performance of gold in the 3385-3375 area. If it cannot effectively fall below this area, we can adjust the trading strategy and re-enter the long trade!

GOLD Local Short!
HI,Traders !
#GOLD is going up now
But will soon hit a horizontal
Resistance of 3394.70 from
Where we will be expecting a
Local pullback and we will
Be expecting a local move down !
Comment and subscribe to help us grow !

GOLD Bullish Breakout!
HI,Traders !
#GOLD made a bullish
Breakout of the falling resistance
And the breakout is confirmed
So we are bullish biased
And we will be expecting
A further bullish move up !
Comment and subscribe to help us grow !

Explosive Rally Ahead: Gold Eyes a 3400 BreakoutThere is no doubt that as long as gold is above 3350, the current gold market will maintain a strong bullish structure. After today's sideways trading, gold has clearly established a support platform in the 3370-3360 area. Although it has repeatedly fallen back under pressure in the 3380-3390 area, it has rarely fallen below the short-term support platform of 3370-3360. In addition, the candlestick charts have repeatedly shown long lower shadows, proving that the buying momentum is strong and the market bullish enthusiasm is high! Therefore, in short-term trading, we can try to go long on gold based on the 3370-3360 support level.
However, it's important to note that gold has repeatedly come under pressure at the 3380-3390 resistance level. If gold consistently fails to break through this resistance level during its upward trend, bullish sentiment could be affected. Therefore, gold may need to retest support before any further gains. If it falls below the 3370-3360 level during this retest, it could extend to the 3355-3350 level, which is strong support in the short term. Therefore, if gold falls below the 3370-3360 level, it could retest the 3355-3350 level, prompting bulls to launch a counterattack.
Therefore, in the short term, given that gold maintains a bullish structure, I would primarily consider going long on gold.
1. Consider initiating a long position in gold in the 3370-3360 area; first, see if gold can break through the 3380-3390 area as expected.
2. If gold retests the support area, consider resuming a long position in the 3355-3350 area.

Gold Update – Correction Complete, Acceleration Ahead?1. Yesterday’s setup
In yesterday’s update, after reviewing Gold in other currencies and concluding the bigger picture remains bullish, I pointed out that on XAUUSD a correction was normal after Friday’s huge rise. I highlighted the 3350 zone as the level where bulls should look for opportunities.
2. What happened overnight
Overnight, Gold delivered exactly that: a violent drop into 3350, immediately followed by an even more violent reversal that erased the move and spiked price up to 3385.
3. Current situation
At the time of writing, XAUUSD is trading around 3375. With the 3350 low now in place, we can reasonably consider the correction complete.
4. Key levels ahead
For a true bullish confirmation, clearing the 3380–3390 zone is essential . If this breakout occurs, I believe the 3400 level won’t act as much of a resistance, but rather as a point of upward acceleration.
5. Trading plan
My bullish view is unchanged. Buying dips against 3350 remains the strategy. For targets, a reasonable objective — if 3380–3390 gives way — is the 3450 zone.
6. Final note
Gold has shown its hand: buyers are here, defending the key level. Now it’s about confirmation above resistance — once that happens, momentum could take us higher, faster. 🚀
Disclosure: I am part of TradeNation's Influencer program and receive a monthly fee for using their TradingView charts in my analyses and educational articles.

Gold’s Next Move = Your Next ProfitOn Friday, gold prices soared due to Powell's dovish remarks, reaching a high of around 3379, and the candle chart showed signs of a V-shaped reversal. From a technical perspective, gold still has the potential to continue to rise, and as of now, gold has not effectively fallen below 3360. While effectively curbing the downward space, it also shows that a certain amount of buying momentum is still continuing.
However, gold has not yet effectively broken through the 3380-3390 area, and the upper space has not been completely opened. If gold cannot break through this area, the bullish momentum may gradually weaken in the short term. In order to accumulate enough momentum to break through this area, gold may usher in a pullback in the short term.
First, we should focus on the 3355-3345 area below. As long as gold remains above this area, the overall bullish pattern will remain. Therefore, this area is the entry area where we should try to go long on gold for the first time after gold pulls back.
Therefore, we currently have two trading options:
1. When gold first hits the 3380-3390 area, consider shorting gold.
2. When gold first hits the 3355-3345 area, consider longing gold.

Gold Analysis- Quick UpdateAs I said yesterday, Gold looks bullish overall, not just on XAUUSD.
Right now, price is correcting after Friday’s huge rally – perfectly normal. The key level to watch is 3350 for buyers to step in.
For confirmation, we need a break above 3380. If that happens, I believe 3400 will fall this time, and in the medium term we could even see a test of the old 3500 ATH.
At the moment I’m out of the market, waiting for a trade that’s worth the risk. Patience is also a position. 🚀
Disclosure: I am part of TradeNation's Influencer program and receive a monthly fee for using their TradingView charts in my analyses and educational articles.
XAUUSD Strong 1D MA100 rebound. Buy.Gold (XAUUSD) has been trading within an Ascending Triangle since its April 22 All Time High (ATH). Shortly after it solidified a Higher Lows trend-line as its Support with a 1D Body Candle Resistance Zone, limiting any upside break-out.
Last Wednesday it hit and rebounded on its 1D MA100 (green trend-line) for the 2nd time in 1 month, showing strong resilience and the presence of a short-term Demand Zone. The last Lower High contact was made a little above the 0.9 Fibonacci retracement level. This gives us a 3420 short-term Target, which is marginally below the Resistance Zone.
-------------------------------------------------------------------------------
** Please LIKE 👍, FOLLOW ✅, SHARE 🙌 and COMMENT ✍ if you enjoy this idea! Also share your ideas and charts in the comments section below! This is best way to keep it relevant, support us, keep the content here free and allow the idea to reach as many people as possible. **
-------------------------------------------------------------------------------
Disclosure: I am part of Trade Nation's Influencer program and receive a monthly fee for using their TradingView charts in my analysis.
💸💸💸💸💸💸
👇 👇 👇 👇 👇 👇

XAUUSD NEXT WEEK ? Greetings 👋
Thats My Gold View Next Week !
Recently Gold Pump At My QM Buy Setup And Now We Have Zones For Selling And Buying
Selling ZONE : 3390 / 3410 Buy Side Liquidity Zone When Its Take Liquidity Then It Will Drop
Buying ZONE : 3352 / 3349 CISD Another Buy Zone : 3338 / 3327 Buy Trendline + IFVG Setup
BEST OF LUCK 🤞

Gold is trading above its key SMA/EMA (20-200)Technical portrait today
General signal: opinions on the XAU/USD instrument are moderately bullish. On Investing.com — Strong Buy on most timeframes. According to medium-term and long-term moving averages: 11 “Buy” signals and only one “Sell”, also a significant advantage in the indicators in favor of “Strong Buy”.
Trend: gold is trading above its key SMA/EMA (20–200), which supports the bullish structure. RSI is in the ~70 area, MACD — Buy, ADX — Buy, which confirms the strength of the bullish momentum.
Support and resistance levels
Price boundaries for today:
Support: $3,310–3,270 — a critical zone; a breakout here may initiate a correction.
Resistance: $3,360–3,410 — a zone where a local pause or rebound is possible.
Stock Forecast
Today's forecast is a slight increase to ≈ $3,375, with further potential to $3,412 by the end of the week. Bullish sentiment remains.
Macro and analytics from banks
RBC Capital Markets remain optimistic: they believe that gold can reach $3,722 by Q4 2025 and $3,813 by the end of 2026 in the base case, remaining above $3,100-3,500.
Goldman Sachs also forecasts growth: to $3,700 by the end of 2025, and $4,000 by mid-2026, especially under the drive of ETF investments and central bank demand.
At the same time, HSBC warns of weakening momentum: a pullback is possible, especially if physical demand decreases and the positive sentiment regarding the Fed slows

GOLD Short From Falling Resistance!
HI,Traders !
#GOLD is rising and will soon reach a falling
Resistance line. After retesting it, we expect
a decline and a move down toward the target!
Comment and subscribe to help us grow !

Rate Cut Expectations Boost Gold — Caution on HighsFed Chair Powell noted that shifting economic risks strengthen the case for rate cuts, signaling potential support for a 25bp cut at the September meeting. In response, gold bulls surged, breaking through the 3358–3366 resistance and reaching around 3378.
⚠️ Caution: After sharp rallies, pullbacks are common. Avoid blind chasing — if you do, keep positions light and be ready to close quickly.
📌 My outlook: I’ve started entering sell positions, with key supports to watch at 3366–3358–3352 during pullbacks.
Importantly, this rally has shifted the 1D structure; holding above 3350 could open the door for a bullish move toward the 3400 level.
Gold (XAU/USD) Analysis - 22 August 2025Gold continues to trade within a high-volatility range, and today’s structure provides us with very clear execution zones validated across the Daily, 4H, and 1H timeframes. By blending price action, order flow, and institutional concepts, we can refine both the buy and sell areas that carry the highest probability of delivering asymmetric returns.
Macro Context (Daily)
The daily chart maintains a bullish undertone as higher-lows remain intact, and price continues to defend key demand blocks. That said, the upper range resistance around the $3360–$3380 area has capped recent rallies, leaving the market positioned between a strong daily demand base and significant supply overhead.
Swing Structure (4H)
On the 4H, gold is consolidating between a fresh demand block at $3318–$3324 and a supply block at $3356–$3362. This consolidation aligns perfectly with premium/discount zones of the current 4H range, giving us clarity on where institutional flows are likely to engage.
Execution Refinement (1H)
The 1H chart adds precision:
A bullish FVG and demand overlap sit at $3320, creating inducement for long entries.
Above, clear liquidity is resting just beyond $3355 and again near $3380, prime zones for potential stop-runs and reversals.
Momentum indicators (RSI/MACD) show hidden bullish divergence at demand and early exhaustion at supply — adding weight to both sides of the range.
Execution Zones
Primary Buy Zone (Golden Zone) → $3318 – $3324
Entry: $3322 | SL: $3312 | TP1: $3345 | TP2: $3360
Confluence: Daily demand OB + 4H discount zone + 1H FVG + RSI divergence.
Secondary Buy Zone → $3302 – $3308
Entry: $3306 | SL: $3296 | TP1: $3328 | TP2: $3340
Confluence: Deep retracement into 61.8% Fib + untapped 4H OB + liquidity sweep potential.
Primary Sell Zone → $3356 – $3362
Entry: $3359 | SL: $3369 | TP1: $3342 | TP2: $3325
Confluence: Daily resistance + 4H supply OB + premium zone + liquidity inducement above $3355.
Secondary Sell Zone → $3378 – $3384
Entry: $3381 | SL: $3391 | TP1: $3360 | TP2: $3335
Confluence: Major untested daily supply + 4H imbalance + stop-run liquidity.
Executive Summary
The clearest asymmetric opportunity lies in the Primary Buy Zone at $3318–$3324, which aligns across Daily, 4H, and 1H with multiple layers of confluence. This zone provides tight risk control with substantial upside toward $3360.
Until we see a decisive break of either the $3300 handle or the $3380 resistance, expect gold to remain range-bound with sharp liquidity grabs at both extremes. Institutional order flow favors a buy-the-dip bias within demand zones, while rallies into supply should be approached with tactical shorts.
Golden Zone = Buy $3318 – $3324
(best confluence: demand OB + FVG + RSI divergence + structural HL defense)

XAUUSD Safe-Haven Flows Could Trigger Bullish Move in GoldI’m currently analyzing XAUUSD (Gold) 🪙✨, which appears to be significantly oversold 📉 and now trading into a prior bullish imbalance zone ⚖️ — an area where price could begin to rebalance. This level is particularly important, as it has acted as a key reaction point multiple times in the past 📊. With gold being overextended and signs of weakness emerging in the stock markets 📉📉, my view is that capital could rotate into safe-haven assets 🛡️, potentially fueling a gold rally 🚀. I’ll be watching for a bullish break of structure 🔍 as a signal to enter long. (Not financial advice.)

Institutional Gold Analysis (XAU/USD) – 19 August 2025Gold prices are consolidating in a narrow range near $3,331, reflecting a transitional market phase as traders await fresh direction from the Federal Reserve’s upcoming Jackson Hole summit. The prevailing bias leans mildly bearish in the short term, with USD strength and higher yields capping upside momentum, while underlying safe-haven demand continues to provide structural support.
From a 4-Hour institutional perspective, price action currently sits at the midpoint of an internal range, offering clearly defined liquidity pools both above and below. This creates an environment where institutional flows are likely to engineer sweeps into key supply and demand zones before a decisive expansion phase begins.
Primary Institutional Zones
Primary Buy Zone ($3,320–$3,325)
The dominant area of interest for buyers lies within $3,320–$3,325, a well-defined discount zone that combines multiple layers of institutional confluence. This level is supported by a Rally-Base-Rally (RBR) demand zone, a fresh unmitigated order block, and a fair value gap formed during recent displacement. The retracement aligns perfectly with the Optimal Trade Entry (OTE) Fibonacci band (0.705–0.79), while liquidity pools at equal lows (EQL) provide the setup for a sweep before reversal. From here, upside targets extend first to the structural resistance at $3,348, and further towards $3,372 — the 1.272 Fibonacci extension of the last impulsive leg.
Primary Sell Zone ($3,345–$3,350)
On the supply side, the clearest short opportunity emerges between $3,345–$3,350, which has been validated as a Drop-Base-Drop (DBD) supply zone. This area overlaps with a fresh order block and fair value gap, while resting in the premium half of the internal swing. Equal highs (EQH) clustered at this level signal an ideal liquidity grab, with displacement likely to follow during London/New York Kill Zone overlap. Downside targets from this zone first revisit $3,331, with extended projections toward $3,295 (Fib 1.272 extension).
Fallback Levels
Should the primary zones be invalidated through manipulative displacement or deeper liquidity hunts, fallback areas are defined:
Fallback Buy Zone ($3,310–$3,315): This deeper demand pocket provides secondary positioning if the primary buy zone fails, offering a structural base for recovery back into $3,325–$3,348.
Fallback Sell Zone ($3,360–$3,365): If price sweeps beyond the primary sell zone, this extended premium region becomes the next institutional supply area, targeting retracements back to $3,350–$3,331.
Golden Zone Nomination
Of all identified zones, the Primary Sell Zone ($3,345–$3,350) emerges as the Golden Zone of the day. It represents the highest-probability, institution-grade setup due to its multi-layered confluence, liquidity alignment, and Kill Zone overlap. With the market capped below $3,350 in recent sessions, this level offers the most favorable balance of risk and reward for intraday execution.
Institutional Confirmation
Cross-validation with external institutional sources strengthens this bias. Reuters confirms gold’s range-bound behavior ahead of the Fed’s Jackson Hole summit, while FXStreet highlights fading bullish momentum near $3,330. TradingNews also reinforces the significance of the $3,348–$3,350 cap as resistance, perfectly aligning with our Sell Zone. Together, these insights support the transitional-to-bearish outlook, while acknowledging that long-term structural demand from central banks remains intact.
Conclusion
In summary, gold remains trapped between defined liquidity pools, awaiting a catalyst for directional expansion. For today, the Primary Sell Zone ($3,345–$3,350) stands out as the Golden Zone, offering the most institutionally aligned short opportunity with multiple confirmations. Meanwhile, the Primary Buy Zone ($3,320–$3,325) provides a structurally valid counterpoint should liquidity sweep lower. Until the Fed’s policy guidance becomes clear, traders should expect range-bound behavior with engineered liquidity grabs during London and New York sessions, best exploited by targeting the defined high-probability institutional zones.

GOLD Swing Short!
HI,Traders !
#GOLD made a bearish
Breakout of the key horizontal
Level of 3347.89while trading
In a downtrend so we are
Bearish biased and we will
Be expecting a further
Bearish continuation !
Comment and subscribe to help us grow !

Gold on Fire: Bulls Eye an Unrelenting Surge to 3365–3375Although gold has been weak recently, we have still achieved impressive results in gold long trading because it touched 3375 and 3358 twice during the rebound process. We have made a total profit of more than 900 pips in the long trading, which can be said to be a very successful transaction in the short term.
At present, gold maintains an overall volatile market, but in the short term, gold has never effectively fallen below the 3330-3320 area. What is more obvious is that the dense trading area below is concentrated in the 3330-3310 area, so the buying support below is strong, which greatly limits the downward space of gold; in addition, gold touched around 3358 during today's rebound, and once broke through Friday's intraday high, which to a certain extent strengthened the market bullish sentiment. Therefore, when gold retreats again, there may be more buying funds willing to enter the market.
In terms of fundamentals, the ceasefire and peace between Russia and Ukraine have not yet been settled, and the geopolitical situation remains tense; and the market's expectations for the Federal Reserve to cut interest rates are gradually strengthening. Against this background, gold still has the possibility of rising again.
Therefore, in the short term, I still prefer to trade gold long. We can consider buying gold in the 3340-3330 area, first looking at the target 3365-3375 area, and even continuing the upward trend to around 3380.
