4284.50 Sell Limit XAUUSDSafe Place For Sell on Xauusd is 4284.50 with 30/40 pip Sl And 60/80 pip Tp
Waite For Result/update
Xauusdsignals

XAU/USD — Market Blueprint > Bullish Road Ahead📊 Asset:
XAU/USD – “Gold vs U.S. Dollar”
Metals Market Opportunity Blueprint — Swing Trade Outlook
📈 Plan:
Bullish Bias (Swing Trade Setup) ✨
Gold continues to hold strong above major structural support, reflecting continued demand during USD volatility and broader risk hedging.
🎯 Entry Zone:
Any active market level based on your strategy
(Traders may enter on dips, breakouts, or momentum confirmation. Adapt to your preferred model.)
🛑 Stop Loss (Risk Control):
This is my SL: 4140.00
Dear Ladies & Gentlemen (Thief OG’s), kindly adjust your stop loss according to your strategy, account size, and personal risk management.
⚠️ Note: I am not recommending you use only my SL. Always manage your own risk—your money, your rules.
🎯 Target (Take Profit):
Primary Target: 4350.00
Price is approaching a major resistance zone, entering overbought conditions, and potential liquidity traps may form.
Be alert and secure profits when the market gives them.
⚠️ Note: Dear Ladies & Gentlemen (Thief OG’s), I am not recommending you use only my TP. Your exit depends on your own rules and risk appetite.
📡 Correlated Pairs to Watch (USD & Metals Market)
Tracking related instruments helps confirm direction, detect fakeouts, and build higher-conviction entries.
1️⃣ DXY (U.S. Dollar Index)
Gold moves opposite the dollar
Falling DXY = bullish support for XAU/USD
Watch for divergence between DXY strength and gold price action
2️⃣ XAG/USD (Silver)
Silver often moves ahead of gold in momentum shifts
Strong silver breakout = supportive signal for gold continuation
3️⃣ USD/JPY
Risk sentiment + yield fluctuations influence gold
Weak USD/JPY sometimes signals softer USD → bullish for gold
4️⃣ US10Y (U.S. 10-Year Treasury Yield)
Gold rises when bond yields drop
Falling yields = reduced opportunity cost → boosts gold attractiveness
5️⃣ SPX / NASDAQ
Equities sell-offs often push liquidity into gold
Risk-off flows = bullish gold environment
🔍 Key Market Notes:
Gold remains a preferred hedge while markets digest macro uncertainty
Overbought structure near resistance—tight management recommended
Liquidity zones ahead may trigger fake breakouts before true moves
Bullish continuation remains valid above key swing support

XAU/USD Price Outlook – Trade Setup📊 Technical Structure
FOREXCOM:XAUUSD Gold (XAU/USD) pulls back toward the 4,220–4,210 support zone after briefly testing the 4,256–4,266 resistance zone, while the broader bullish structure remains intact. Price continues to respect the rising trendline, and buyers are expected to re-enter on dips as long as support holds.
The chart presents a bullish continuation structure:
Support zone: 4,220 – 4,210
Resistance zone / target area: 4,256 – 4,266
While price stays above 4,210, corrective moves into support are likely to attract buying interest, with upside potential toward 4,256–4,266. A 4H close below 4,206 would invalidate the bullish structure and expose the 4,190 region.
🎯 Trade Setup
Idea: Buy dips into support, targeting a move toward the 4,256–4,266 resistance zone.
Entry: 4,220 – 4,210
Stop Loss: 4,206
Take Profit 1: 4,256
Take Profit 2: 4,266
Risk–Reward Ratio: ≈ 1 : 2.52
Bias stays constructively bullish while price holds above 4,220–4,210 on a closing basis.
A break below 4,206 would signal weakening momentum and invalidate the bullish idea.
🌐 Macro Background
According to FXStreet, gold extends gains above $4,200 as expectations for a December Fed rate cut continue to build. Markets now price in an 87% probability of easing at the December 9–10 FOMC meeting, significantly higher than the previous week.
Fed & USD drivers:
Weaker US economic data and dovish remarks from policymakers boost rate-cut bets.
Lower interest rates reduce the opportunity cost of holding gold, supporting upward momentum.
ISM Manufacturing PMI due later today may influence USD volatility—stronger data could weigh on gold temporarily.
Geopolitical factors:
Progress in US–Ukraine peace discussions may limit safe-haven demand.
Trump’s special envoy traveling to Moscow this week keeps geopolitical risk in focus, though the tone remains cautiously optimistic.
Overall, the macro backdrop continues to favor upside for gold while dips remain well-supported.
🔑 Key Technical Levels
Resistance zone: 4,256 – 4,266
Support zone: 4,220 – 4,210
Invalidation level (bulls): 4,206
📌 Trade Summary
XAU/USD maintains a bullish continuation structure above the 4,220–4,210 support area. As long as this zone holds, the setup favours buying dips and targeting 4,256–4,266. Fed rate cut expectations and geopolitical developments continue to provide underlying support for gold, though US data may introduce short-term volatility.
⚠️ Disclaimer
This analysis is for reference only and does not constitute trading advice. Trading involves significant risk, and proper risk management is essential.

GOLD (XAUUSD): Road to ATH
As I predicted earlier, Gold successfully bounced to 4215.
The market closed, testing a key daily resistance.
Next week, I suggest looking for its breakout to buy.
Your confirmation will be a daily candle close above 4245.
With a high probability, the market will rise to a resistance
based on a current ATH.
❤️Please, support my work with like, thank you!❤️
I am part of Trade Nation's Influencer program and receive a monthly fee for using their TradingView charts in my analysis.

XAUUSD: Gold Wave HarmonyXAUUSD: Gold Wave Harmony
According to its wave structure, gold is completing a correction phase and preparing to form a new impulse. The chart shows a transition from sideways movement to a more dynamic wave, which could set the direction for the near term.
Main scenario: after the correction ends, a downward impulse sequence is expected to develop. Alternative scenario: if the market consolidates above recent highs, it could continue to rise, delaying the start of a new downward wave.
Idea for traders: watch for confirmation of the structure on lower timeframes and enter only after clear reversal signals appear.
Risk management: use clear stop levels and adjust the plan as new impulses emerge.
Friends, more wave analysis is available in our profile.
Subscribe to stay up to date with wave analysis!

Weekly Gold Trend SummaryThis week, gold witnessed a remarkable transition from bottom consolidation to strong upward momentum, forming an overall oscillatory uptrend. After intense long-short battles earlier in the week, bullish forces gradually gained dominance, driving prices from around the $4,000 psychological level to above $4,200 with substantial gains. The weekly movement can be segmented as follows:
1. Early-Week Consolidation Under Pressure (November 24)
Gold extended its mild correction at the start of the week, opening at $4,065.63 during the Asian session with minor intraday declines. A sudden volatility spike occurred in late Asian trading, sending prices plunging $22 to $4,055.48 (a 0.48% drop). Pressured by a strong U.S. dollar and fading expectations of a Fed rate cut in December, gold’s safe-haven appeal remained subdued as capital flowed into dollar-denominated assets. Prices traded under pressure within the $4,000 – $4,100 range; however, buying interest emerged near the annual moving average, halting the downward trajectory.
2. Mid-Week Intensified Long-Short Dynamics (November 25 – 26)
November 25: Gold traded in a narrow range, opening at $4,129.87 (a 0.33% decline from the previous close) with a high of $4,144.04 and a low of $4,129.09. The session remained confined within a triangular consolidation pattern, with balanced bullish and bearish momentum.
November 26: Sentiment shifted to oscillatory bullishness. Following a close at $4,130.59 the prior day, gold surged to an intraday high of $4,169.20, posting a 0.82% daily gain. Escalating geopolitical tensions and rising Fed rate cut bets provided fundamental support, while technically, the MACD golden cross persisted with mild expansion of bullish momentum bars, signaling the start of bullish momentum acceleration.
3. Late-Week Strong Rally to New Highs (November 29 – 30)
Gold entered a robust upward phase in the latter part of the week:
November 29: Prices soared sharply to close at $4,218.55, gaining $61.82 (1.49%) intraday with a peak of $4,226.66.
As of 09:00 GMT on November 30: Gold hovered around $4,219 , marking significant cumulative gains from the early-week $4,060 range. Having successfully broken through previous resistance zones, the strong uptrend remained intact.
Overall Assessment
After initial pressure from a strong U.S. dollar, gold broke out of its consolidation range supported by favorable factors including Fed rate cut expectations and geopolitical risks. As bearish momentum waned, bullish forces took full control, driving a sharp weekly rally from the $4,000 support level to above the $4,200 milestone.

GOLD Bullish Bias!
HI,Traders !
#GOLD is making a bullish
Rebound from the support
Cluster of rising and horizontal
Support levels so as Gold is
Trading in an uptrend we are bullish
Biased and we will be expecting
A further bullish move up !
Comment and subscribe to help us grow !

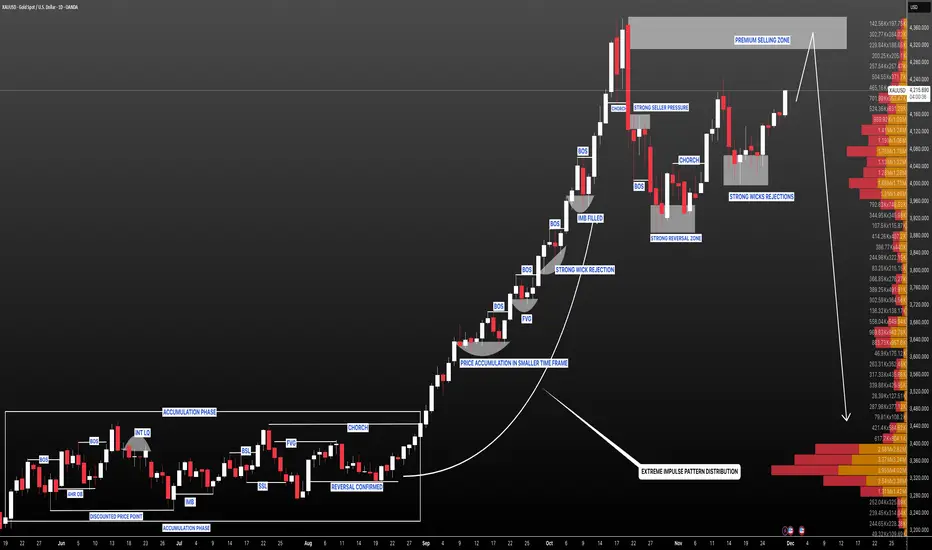
XAUUSD(GOLD): Reaching Our Premium Selling Zone! Get Ready ! Gold is approaching a critical level and we believe this will be a significant move. The $4350-$4400 region has a high volume of sellers, which will be decisive for traders. A price reversal could lead to a substantial decline.
Good luck and trade safe!
Team Setupsfx_
Gold Set Up Secured 300 PipsPerfect play, with price BOS on the 1h, come down tap into 1h demand, engulf on the 1h and 15m to target BSL

gold await breakout#XAUUSD base on H4 past candle and price movement, we expect price to retest 4187 for bearish reverse.
Sell limit 4187, target 4140, SL 4198.
Above the rectangle 4199-4200 holds bullish breakout to buy. Below the down rectangle on H1 closure will continue bearish also.

Gold Trade Set Up Nov 28 2025Price created a new HH on the 1h in Asia session then reversed in London to test 1h demand and bounced off it. Overall i am still bullish. internally price swept low range liquidity so i will want to see 5m-15m engulfing candle to continue higher to BSL

XAU/USD Intraday Plan | Gold Stuck Between 4142–4167Yesterday we saw a break above the 4142 level, but gold failed to extend higher, resulting in a ranging move between 4142 and 4167. Buyers now need to clear the 4167 minor resistance to push toward 4198.
If price can’t hold and slips back below 4142, we could see a retest of the consolidation range. Continued selling pressure would then shift focus toward the Support Zone.
📌Key levels to watch:
Resistance:
4167
4198
4232
Support:
4142
4098
4052
4016
3968
🔎Fundamental focus:
Today is a U.S. bank holiday, which means trading volume is thinner than usual. Lower liquidity can lead to exaggerated intraday moves, sharper spikes, and occasionally wider spreads, so caution is advised.

GOLD: Rally followed by a pullbackGold is showing a trend of rallying in the Asian session followed by short-term pressure today. While strongly supported by expectations of a Fed rate cut, it also faces high-level pressure from the weekly and monthly closing. The intraday trend is likely to be a "rally followed by a pullback".
After contesting near the middle band and trend line yesterday, gold chose to break upward. Despite the inertial upward momentum in the Asian session, the MACD indicator on this timeframe has shown a downward divergence, signaling a potential pullback risk. We need to focus on the European and American session trends closely,if the rally fails to sustain after moving higher, a "rally to highs then close lower" pattern is likely to form.
Intraday Short-term Resistance: Around 4195. If gold successfully breaks above this resistance level, it may face pressure in the 4210 - 4230 range.
Short-term Support Levels: Keep an eye on the 4150 - 4160 zone. A breakdown below this level could trigger a further decline to the key support at 4140.
Sell 4185 - 4190
SL 4195
TP 4160 - 4150 - 4140
Buy 4160 - 4165
SL 4155
TP 4180 - 4185 - 4190

GOLD (XAUUSD): Another BoS
A quick follow-up for the yesterday's post for Gold.
The price successfully bounced and broke another intraday resistance,
setting one more local higher high on a 4H.
The market will most likely continue rising following the plan
and reach 4205 soon.
❤️Please, support my work with like, thank you!❤️
I am part of Trade Nation's Influencer program and receive a monthly fee for using their TradingView charts in my analysis.

XAU/USD Price Outlook – Trade Setup📊 Technical Structure
OANDA:XAUUSD Gold (XAU/USD) remains supported after rebounding from the 4,154–4,160 support zone, keeping the short-term bullish structure intact. Price has broken above the 4,170–4,175 barrier and is now consolidating just below the 4,190–4,196 resistance zone, with buyers looking to extend gains as long as support holds.
The chart shows a bullish continuation pattern:
Support zone: 4,154 – 4,160
Resistance zone / target area: 4,190 – 4,196
As long as gold stays above 4,154, dips into support are likely to attract buyers, with upside potential toward 4,190–4,196. A decisive 4H close below 4,154 would invalidate the bullish setup and expose the 4,130 region.
🎯 Trade Setup
Idea: Buy dips into support, targeting a move toward the 4,190–4,196 resistance zone.
Entry: 4,160 – 4,154
Stop Loss: 4,149
Take Profit 1: 4,190
Take Profit 2: 4,196
Risk–Reward Ratio: ≈ 1 : 2.76
Bias remains constructively bullish while price holds above 4,154–4,160 on a closing basis.
A break below 4,154 would signal weakening momentum.
🌐 Macro Background
According to FXStreet, gold holds firm near a two-week high as rising expectations for a December Fed rate cut continue to support bullish sentiment. Comments from multiple Fed officials confirmed that further easing is a “live option,” helping gold absorb both a modest USD rebound and the broader risk-on tone.
Key drivers:
Fed rate cut expectations reinforced by dovish remarks from Williams, Waller, and Miran.
Kevin Hassett emerging as the frontrunner for Fed Chair, expected to support aggressive rate cuts.
Mixed US data failed to alter the easing outlook, keeping USD capped.
Russia–Ukraine developments keep geopolitical uncertainty in play, maintaining gold’s safe-haven appeal.
Despite improved risk appetite, gold’s bullish bias remains intact due to persistent USD softness and expectations of lower US rates. The fundamental backdrop continues to favor upside moves.
🔑 Key Technical Levels
Resistance zone: 4,190 – 4,196
Support zone: 4,154 – 4,160
📌 Trade Summary
Gold remains in a bullish continuation structure above the 4,154–4,160 support band. As long as this zone holds, the setup favours buying dips and targeting 4,190–4,196 where previous supply pressure may reappear. Fed rate cut expectations and geopolitical tensions underpin the bullish narrative, while risk sentiment limits immediate downside.
⚠️ Disclaimer
This analysis is for reference only and does not constitute trading advice. Trading involves significant risk, and proper risk management is essential.

GOLD broke out of the H4 trendline — real breakout or trap? Hello Traders! 👋
Gold has broken out of the H4 descending trendline, boosted by geopolitical tension and a weaker USD.
But the real question is: Is this a true breakout or just FOMO before a drop?
Here are the key zones I’ll be watching today:
BUY Zones (SL 10 – TP 10)
• 4165 – 4155
• 4170 – 4175
• 4140 – 4145
• 411x
• 4099
SELL Reaction Zones (SL 10 – TP 10)
• 4200 – 4203
• 4212 – 4215
• 4230
• 4245 – 4247
👉 If price breaks below 4133, the trendline fails → potential sell-continuation setup.
📌 Bias: BUY is the main play — SELL only for short reaction scalps.
💬 What do YOU think — real breakout or classic bull trap? Drop your thoughts below!
❤️ Let’s discuss & grow together!

Gold: Narrow Volatility on ThanksgivingGold is showing a narrow-range oscillatory downward trend today. Influenced by the early close of the market for the U.S. Thanksgiving holiday, trading activity has turned sluggish. With no major news catalysts to drive momentum, it’s difficult to break out of the oscillatory range in the short term. However, the medium-to-long-term uptrend remains supported by multiple core factors.
During the early Asian session, gold briefly touched a high of 4168 before pulling back, and has been fluctuating within the 4140 - 4170 range overall—consistent with market expectations of thin trading and narrowed volatility during holidays.
Initial support lies around 4140, where buying interest has gradually emerged to form effective short-term support.
Key support focuses on the 4120 - 4130 zone, which is expected to effectively slow down further downward movement.
Immediate resistance is near 4170. From today’s price action, the market has pulled back after rallying to this range.
If broken, we will monitor yesterday’s resistance level at 4180.
Trading Strategy:
Buy 4140 - 4145
SL 4135
TP 4160 - 4165 - 4170
Sell 4165 - 4170
SL 4175
TP 4150 - 4145 - 4140

Gold Trade Set Up Nov 27 2025Overall i believe price action is still bullish but internally in the 15m we are making LL/LH and we got a lot of SSL plus daily FVG below that i believe will be targeted before continuing its bullish trend so i will be looking for internal 5m BSL to be swept followed by a bearish engulfing candle to target SSL

XAU/USD Price Outlook – Trade Setup📊 Technical Structure
OANDA:XAUUSD Gold (XAU/USD) eases lower after failing to break above the 4,168–4,175 resistance zone, with sellers defending this area and keeping price capped. The market structure has shifted into a short-term bearish setup, with waning bullish momentum and repeated rejection at resistance.
The chart presents a bearish continuation pattern:
Resistance zone: 4,168 – 4,175
Support zone / target area: 4,104 – 4,110
As long as price remains below 4,168, rallies toward the resistance zone are likely to attract sellers, with downside potential toward the 4,110–4,104 support band. A decisive 4H close above 4,175 would invalidate the bearish structure and open the way toward 4,183.
🎯 Trade Setup
Idea: Sell into resistance, targeting a move toward the 4,110 support zone.
Entry: 4,168 – 4,175
Stop Loss: 4,183
Take Profit 1: 4,110
Take Profit 2: 4,104
Risk–Reward Ratio: ≈ 1 : 4.49
Bias stays bearish while price holds below 4,168–4,175 on a closing basis.
A 4H close above 4,175 would signal buyers regaining control.
🌐 Macro Background
According to FXStreet, gold eased from a two-week high as improved global risk appetite and hopes for a Russia–Ukraine peace framework prompted some profit-taking in safe-haven assets. Thin Thanksgiving liquidity also encouraged short-term selling flows.
Despite this pullback, dovish Fed expectations continue to weigh on the USD:
-Durable Goods Orders rose only 0.5%, slowing from the prior month.
-Initial jobless claims fell to 216K, a seven-month low.
-Chicago PMI dropped sharply to 36.3, showing deeper contraction.
Fed officials reinforced expectations of a December rate cut:
-John Williams said rates could fall without hurting inflation goals.
-Christopher Waller noted the labour market is weak enough to justify easing.
-Stephen Miran stated that the economy requires large rate cuts to reach neutral policy.
This dragged the USD Index to a one-week low, providing underlying support to gold.
However, rising optimism regarding Russia–Ukraine negotiations boosted risk sentiment and limited safe-haven demand, aligning with the bearish technical rejection at resistance.
🔑 Key Technical Levels
Resistance zone: 4,168 – 4,175
Support zone: 4,104 – 4,110
📌 Trade Summary
Gold turned lower after repeated rejection at the 4,168–4,175 resistance zone, signalling a short-term bearish continuation pattern. As long as this zone caps the upside, the setup favours selling rallies into resistance with downside targets at 4,110–4,104.
Dovish Fed expectations keep gold supported on deeper dips, but improved risk sentiment and peace-talk optimism align with short-term selling pressure.
⚠️ Disclaimer
This analysis is for reference only and does not constitute trading advice. Trading involves significant risk, and proper risk management is essential.

Today: Can we break above 4200 again?Gold’s bullish trend has reignited amid rising Fed rate cut expectations. A minor pullback may unfold during today’s US session, followed by a rebound—with moderate resistance expected around 4200
Buy 4130 - 4140
TP 4160 - 4170 - 4180
Accurate signals updated daily. They serve as a reliable guide for trading issues – feel free to refer to them. Hope they help!

Gold Trade Secured 150 PipsPrice swept SSL but was still bullish overall so i waited for a CISD and 15m engulfing bullish candle to target BSL

Gold Trade Set Up Nov 26 2025Price pushed higher in Asia but engulfed to the downside in London so now i will be waiting for either a 15m engulfing/CISD to the upside to target BSL or a push lower to lower SSL

XAUUSD Intraday Plan| Breakout Above 4142, Eyes on 4198 Next?Gold has finally broken above the 4142 resistance after a day of consolidation, showing renewed bullish strength. Price is now trading above both moving averages, with the MA50 crossing above the MA200.
If bullish momentum holds, we can expect a retest of 4198, and a clean break above that level would open the path toward 4232 next.
However, if price drops back below 4142, we may see a move back into the consolidation range. A confirmed break beneath that range would then open the door for a deeper pullback into the Support Zone.
📌Key levels to watch:
Resistance:
4198
4232
4274
Support:
4142
4098
4052
4016
3968
🔎Fundamental focus:
Today brings a cluster of important U.S. data releases — Unemployment Claims, Durable Goods Orders, and the Chicago PMI.
