Xauusdsignals

GOLD (XAUUSD): Bullish Move After Opening?!
I think that there is a high chance that Gold will have a bullish opening.
The market closed, breaking a resistance line of a bullish flag pattern
on an hourly time frame.
Fundamentals strongly support this bullish outlook.
Resistance 1: 3392
Resistance 2: 3420
❤️Please, support my work with like, thank you!❤️
I am part of Trade Nation's Influencer program and receive a monthly fee for using their TradingView charts in my analysis.

GOLD (XAUUSD): Technical Analysis & Important Pattern to Watch
For some known reason, Gold remains bearish this entire week.
The market is currently correcting within a falling channel - a bullish flag on a 4H time frame.
Ahead, I see a bunch of strong intraday supports.
From one of these structures, a bullish rally may resume.
A trigger that you should look for is a bullish breakout of
a resistance line of the flag and a 4H candle close above that.
A bullish continuation will be expected then.
❤️Please, support my work with like, thank you!❤️
I am part of Trade Nation's Influencer program and receive a monthly fee for using their TradingView charts in my analysis.

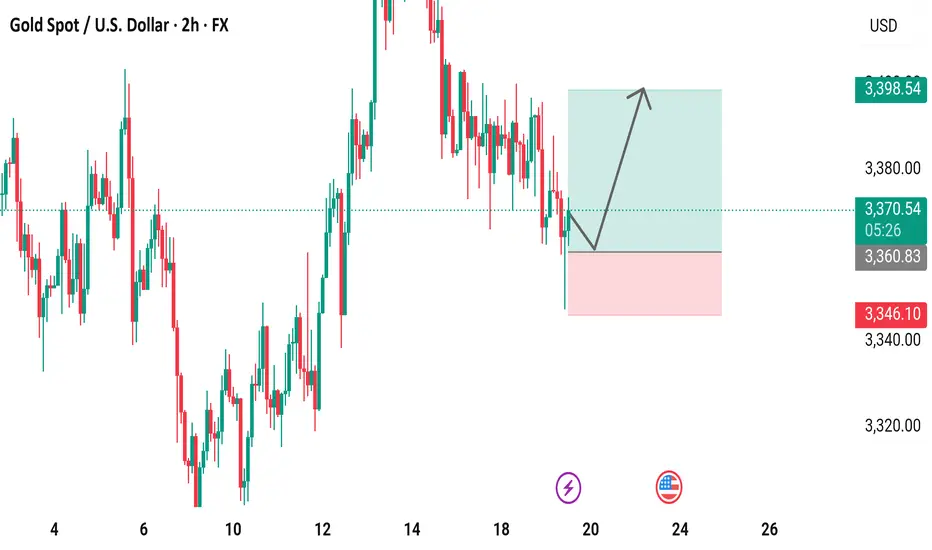
XAU/USD 2-Hour Chart Analysis: Bullish Breakout in Progress2-hour candlestick chart of the Gold Spot/U.S. Dollar (XAU/USD) currency pair, displayed on TradingView, a popular trading platform. The chart tracks price movements over a period from the 4th to the 26th, with each candlestick representing a 2-hour interval. The price levels, shown on the y-axis, range from 3,320.00 to 3,398.54 USD, while the x-axis marks the corresponding dates. The current price is 3,370.55 USD, up by 1.61 points (+0.05%), highlighted in green to indicate a positive change. Green candlesticks represent bullish (upward) price movements, while red ones indicate bearish (downward) trends, offering a clear view of market dynamics.
Gold Slips Below Key Support – Is $3,326 Next?OANDA:XAUUSD TVC:GOLD Gold has broken beneath the $3,365–$3,369 support zone, which now aligns with descending trendlines TL1 and TL2 acting as resistance. The 30-minute chart confirms a clean bearish breakout and retest, signalling potential continuation toward lower support near $3,326.
🎯 Short Setup
Entry: $3,365 (retest of broken support / trendline confluence)
Stop: $3,375 (above TL2 and intraday highs)
Target 1: $3,330
Target 2: $3,326
R:R: ~1:3.95
📊 Technical Context
• Price is capped below the $3,365–$3,369 supply zone
• Trendline resistance (TL1, TL2) remains intact from mid-June
• Structure favours continuation lower as long as price stays beneath the retest zone
🌐 Fundamental Backdrop
• Fed held rates steady, but Powell’s tone remained hawkish, warning of “elevated inflation” — supporting USD strength
• Rising Middle East tensions (Israel-Iran conflict) offer safe-haven bids, but not enough to break resistance
• Trump’s tariff threats and criticism of Fed policy add macro uncertainty — mildly supportive of gold in the longer run
📘 Trade Bias
As long as gold holds below $3,365, the bearish thesis remains intact. A sustained push above $3,375 would invalidate the setup and signal a potential reversal or breakout retest.
⚠️ Disclaimer
This analysis is for educational purposes only. Always do your own research and consult a licensed advisor before making financial decisions.

XAU/USD 4H Market Analysis- 19 June 2025XAU/USD 4H Market Analysis
Market Structure: Gold has been in a mild uptrend on the 4‑hour chart, making higher lows and highs since early June. The recent swing high was around ~$3,428 (mid-June), and price has pulled back toward the rising support line near ~$3,373.
A break above the recent high (around $3,404–$3,428) would continue the bull trend; conversely, a drop below the ~3,373 trendline/50% Fib level would signal a bearish turn.
In other words, bulls remain in control as long as ~$3,373 holds – breaking that would threaten lower support around ~$3,338.
Overall Bias: Moderately bullish on 4H. Gold is respecting its rising trendline and 50-period EMA, and analysts note that holding above ~$3,373 keeps the uptrend intact.
Momentum (MACD) is neutral to slightly bearish short-term, so we expect consolidations and range bounces more than a reversal.
In summary, assume an upward bias while price stays above key support near $3,370–$3,380; a firm break below would flip bearish.
Key SMC/Zones:
Price is currently in a range/consolidation roughly between $3,370 and $3,400.
Important zones include:
Demand (Support) Zone:
~ $3,368–$3,378 — this 50% Fib retracement area has been defended as a bullish order block.
Below that, stronger supports sit near ~ $3,354 and $3,333 .
Supply (Resistance) Zone:
~$3,395–$3,415 — a cluster of swing highs and Fib levels. Analysts highlight $3,395, $3,412, $3,435 and even $3,450 as major resistance barriers.
In particular, the $3,400 level is a known psychological and technical ceiling.
Trendlines/BOS: The rising 4H trendline (currently near $3,370–$3,380) is key support.
A break of structure (BOS) below that line would be a bearish Change-of-Character. Similarly, the prior swing low around $3,373 is a flip zone – bulls want to keep that hold.
Liquidity: Stop-loss/liquidation clusters may lie just above recent highs ($3,428–$3,450) and just below recent lows ($3,338–$3,354). For example, stops above $3,428 could fuel a rally if hit, and stops below $3,338 could accelerate a drop.
In short, high-probability zones on the 4H chart are around ~$3,370 (demand/support) and ~$3,400 (supply/resistance).
We’ll look for trades that align with that structure (see setups below).
1H Trade Setups (Aligned with 4H Bias)
Long around $3,370–3,375 (Buy Dip to Demand Zone) –
Entry: ~3,370–3,375 (green zone). Stop: ~$3,365 (≈$5 below zone). Take-Profit: $3,380 first, then $3,390–$3,400.
Reason: This zone is a 4H demand area (50% Fib + order block) and coincides with the rising 4H trendline.
Price has repeatedly bounced here, so a bullish reversal is likely.
Trigger: Look for a bullish 1H signal (e.g. engulfing or pin bar) at ~3,370–3,375, or a break of the short-term 1H down-structure.
Entry on such a signal would target a retest of the mid-range (~3,380) and beyond toward resistance.
Short around $3,395–3,400 (Sell Rally to Supply) –
Entry: ~3,395–3,400 (red zone). Stop: ~$3,405 (≈$5 above zone). Take-Profit: $3,375 first, then $3,365.
Reason: This area is a clear 4H supply zone (near multiple Fibonacci levels/resistance).
It’s just below the $3,400 psychological barrier. A failure or bearish reversal here would likely send price back toward the demand zone below.
Trigger: Watch for a bearish 1H candle or a break of the short-term 1H up-structure in the 3,395–3,400 range. A clear rejection (e.g. bearish engulfing or strong wick) would be the signal to enter short.
(Note: If price breaks cleanly above $3,405–3,410 instead, a bullish continuation trade would then be favored, targeting $3,415+.)
Takeaway: Trade gold with the 4H structure in mind. With price above the ~$3,370 trend support, favor longs on pullbacks into that demand zone and shorts only at proven supply near $3,400. Always use a tight ~$5 stop beyond each zone and scale out at logical pivot levels to manage risk.

6/19 Gold Analysis and Trading SignalsGood morning!
Yesterday, the Federal Reserve's interest rate decision aligned with market expectations, bringing no major surprises. The market had already priced in bearish sentiment in advance, which led gold to trade within the Bollinger Bands' upper, middle, and lower bounds, with all three bands trending sideways, indicating limited intraday volatility.
🔍 Technical Overview:
On the 30-minute chart, the Bollinger Bands began to tilt downward near the close, with price currently pressured by the middle band;
However, MACD structure suggests the middle band may be broken, with potential for price to challenge the upper band resistance near 3392–3400;
More importantly, on the 1D chart, the MACD is showing signs of a bearish crossover (death cross). If confirmed, it may break the bullish structure, weakening support from the weekly MA5;
If gold sustains below the weekly MA10 at 3317, it could open the door for a broader correction, with a drop toward 3200 becoming increasingly likely.
📊 Fundamental Factors:
Today’s U.S. market holiday means fewer economic data releases. As such, gold will likely be driven by technical structure and geopolitical headlines, especially those related to the Middle East. If no new developments emerge, selling on rallies remains the preferred strategy.
📌 Trading Plan (VIP-Focused):
✅ Sell Zone: 3392–3409
✅ Buy Zone: 3338–3321
✅ Scalp/Flexible Zones: 3387 / 3373 / 3364 / 3356 / 3345

Strong support at 3365/3350In recent years, following the easing of high inflation pressures in the U.S., the Federal Reserve has maintained a high-interest-rate policy, a decision that has significantly impacted gold and U.S. dollar markets: high rates have boosted the U.S. dollar while suppressing gold demand 📉.
This week, gold prices defied market expectations: fueled by geopolitical conflicts, gold surged last Friday and opened higher on Monday, only to trend lower thereafter ⬇️. The hourly chart shows a series of lower lows, with 3,400 emerging as short-term resistance, while gold currently oscillates around 3,380 🔄. With key economic data pending release, gold may still rebound (the initial jobless claims data was advanced to Wednesday) ⏰.
Technically, gold remains in a unilateral uptrend on the daily chart, with strong support at 3,365/3,350 from the 5-day and 10-day moving averages—though not yet in an extremely strong trend 📈. Key resistances lie at 3,430/3,450: a break above 3,450 could pave the way for a challenge to the previous high of 3,500 🏔️!
⚡️⚡️⚡️ XAUUSD ⚡️⚡️⚡️
🚀 Buy@ 3365 - 3375
🚀 TP 3395 - 3405
Accurate signals are updated every day 📈 If you encounter any problems during trading, these signals can serve as your reliable guide 🧭 Feel free to refer to them! I sincerely hope they'll be of great help to you 🌟 👇

Gold (XAU/USD) 4H Technical Analysis - 18 June-2025Gold has been in a bullish 4H uptrend, making higher highs and higher lows. Recent data show gold peaked near ~$3,445 on June 16 (a new all-time high) before pulling back toward the $3,400 area.
In other words, price action remains constructive: successive higher lows (around $3,372, $3,322) and higher highs (around $3,445) indicate a strong uptrend.
As long as each pullback holds above the prior swing low (so far ~$3,372), the bullish structure (Break-of-Structure, BOS) is intact.
A decisive drop below ~3,372 (and especially below ~$3,322) would violate that structure (a Change-of-Character, CHoCH) and open a deeper correction.
Market Structure & Bias (4H)
Bullish bias: Gold has made a series of higher lows and highs on 4H, confirming an uptrend
Technical indicators (RSI bullish, price above 200-SMA) and fundamentals (safe-haven demand) support this bias.
Caution near $3,400:
The key $3,400 zone has switched roles as resistance-turned-support. Holding above $3,400 keeps bulls in control, but failure to regain it could allow a deeper dip toward ~$3,350.
Break-of-Structure (BOS): A BOS (new 4H high) upholds the uptrend.
A CHoCH (e.g. a close below $3,372/$3,322) would signal a possible reversal
Key 4H Levels & Zones
Resistance/Supply: ~$3,445–3,450 (recent swing high); ~$3,500 (psychological/all-time level).
Price may stall or reverse near these supply zones.
Pivot/$3,400: ~3,400–3,413 zone – a critical pivot. Gold traded near $3,400 recently; a break above targets $3,450, while failure could drop to support.
Support/Demand Zones: ~$3,372 (prior 4H higher-low). Near ~$3,350–3,353 – the 61.8–78.6% Fibonacci retracement of the last rally and a “golden pocket” demand area. ~$3,322–3,328 – a strong 4H demand order-block where price held on the last pullback.
Finally ~$3,300 (major low below).
Order Blocks & Imbalances: Smart-money traders note a 4H demand block at $3,322–3,328 (the low of a large bullish candle).
A brief sweep above $3,338 (a liquidity grab) was followed by a clean bounce from this zone.
Any unfilled gaps (imbalances) near $3,380–3,400 may attract price back during retracements.
In summary, the 4H chart shows a bullish structure with key support at ~$3,372–3,350 (demand/Fib zone) and resistance around $3,445–3,500. As FXStreet notes, the uptrend remains “intact” on 4H as long as dips are bought.
However, traders should watch for any break below $3,372/$3,322, which would flag a bearish structure break.
Until then, the overall bias is bullish, favoring long entries on dips into the above support zones.
1H High-Probability Trade Setups (Bullish Bias)
Setup 1 – Buy on $3,400 pivot hold: Entry zone $3,390–3,400 (at/just above 4H pivot). Stop: ~$3,380 (just below pivot, ~$10 below entry). TPs: $3,420 and $3,450. Trigger: A bullish candlestick pattern or break-and-retest of ~$3,400 (e.g. bullish engulfing or hammer on 1H). Reason: The $3,400 level is a key 4H support/resistance flip.
Holding here would confirm the uptrend continuation, targeting the recent swing highs. A 1H bullish signal (like a reversal bar) gives a clear entry.
Setup 2 – Buy on deep pullback: Entry zone $3,370–3,380 (around 4H higher-low). Stop: $3,360. TPs: $3,400 (the pivot) and $3,420. Trigger: A strong 1H bullish candle or double-bottom forming near zone. Reason: This area lines up with the 4H demand/Fib zone ($3,350–3,372).
It represents a higher-low in the 4H structure. A bounce here would signal buyers stepping in at a key support.
Setup 3 – Buy after breakout of $3,445: Entry zone $3,450–3,455 (above recent high). Stop: ~$3,440. TPs: $3,480 and $3,500. Trigger: A clean 1H candle close above $3,445 (breakout) and retest. Reason: A push above $3,445 (June high) would form a new 4H BOS, suggesting continued momentum. Buying on the breakout retest captures follow-through to the next targets.
(Each setup uses a small $~10 stop relative to gold’s price. Always wait for the specified trigger pattern before entering.)
Takeaway:
On the 4H chart, gold remains bullish while above ~$3,372/$3,350. Key zones to watch are $3,372–3,350 (buy zone) and $3,400–3,445 (sell/resistance). For now, favor long entries into support, and confirm with clear 1H signals before trading.

XAUUSD: Accumulation in process,Waiting for Bullish DistributionHello,
Today, we will analyse the key points of each significant move.
Following the price’s all-time high at $3500, it experienced a sharp decline and failed to maintain that level. A substantial 2400 pips would have resulted in significant losses for many accounts. Initially, it was perceived as a minor correction, with the expectation of further price appreciation. However, this assumption proved incorrect. After reaching an even higher peak, the price invariably undergoes a more substantial correction.
At 3260, substantial bullish volume surged into the market, necessitated by the presence of a fair value gap. Subsequently, the price experienced a decline, reflecting the prevailing bearish trend, which favoured the bears. However, at 3200, a pivotal level representing a discounted price point, bull volume surged. This powerful bullish impulse propelled the price to 3432, ultimately confirming the bullish trend. AB=CD there recurring pattern emerged weekly. When the price reached the 3432 level as a fair value gap, the CD pattern commenced.
AB=CDTheHeyIndeed, we have identified a recurring pattern. It appears to be an equal move in any direction, and it has manifested precisely as anticipated. We were aware that the price would reject at 3120, and it did so accordingly. Currently, the market is in our favour. Upon market opening, it exhibited a positive gap, propelling the price to 3450. However, it subsequently declined, reaching 3384.
Presently, we find ourselves in the accumulation phase, poised for distribution. This distribution is anticipated to be substantial, potentially leading to another record high, potentially reaching 3650.
Moving forward, the price could continue towards our target from its current position. Alternatively, there exists a possibility that it may drain the sell-side liquidity and reverse from 3360-3370.
Our take-profit levels are set at 3450, 3490, 3520, and finally, 3600. When entering the market, it is advisable to employ a short time frame. It is important to note that this analysis is merely our opinion, and market conditions may deviate from expectations.
We extend our best wishes for success and safe trading. If you wish to demonstrate your support, you may consider liking, commenting, or sharing this analysis with others.
Sincerely,
Team Setupsfx_

GOLD Intraday Chart for 17 June 25Hello Traders,
as you can see that market was going down very badly and it's actually stuck below 3400 Psychological Level
Definitely we are sellers now as long as market sustain below 3400 Psychological Level
below 3380 level GOLD will move towards 3360 or even 3350
Disclaimer: Forex is Risky

Citigroup predicts a decline in gold prices? Blacklisted?Information summary:
Citigroup analysts predict that by the second half of 2026, gold will fall back to around $2,500-2,700, with a significant reduction in investment demand, improved global economic growth prospects, and a decline in the factors that led to the rise in gold prices due to the Fed's interest rate cut.
My point of view is: blacklist Citigroup. Since last year, they have predicted that the highest point of gold prices will exceed $4,000, and they have constantly changed the forecast point in the middle, and now they even point out that the price will fall below $3,000, which is completely unreliable.
Market analysis:
In the early Asian session, it also rose strongly, and it seems that there is a lot of upward momentum, but $3,405 is the pressure position for the top and bottom conversion, and the rise in the morning is a lure. At this position, it fell rapidly, reaching a minimum of around $3,373.
The Asian market seemed to rebound strongly in the morning, but the MA5 and MA10 moving averages showed a downward trend. This kind of market cannot wait for a decline to go long, but it is also a repeated wash-out shock. The first focus below is the 3375-3370 area, followed by 3360. The short-term trend is still dominated by wash-out shocks.
The short-term important focus position is around 3405. 3405 is used as the dividing point between long and short positions. A short-selling strategy is carried out near this position. Pay attention to the 3375-3360 area below.

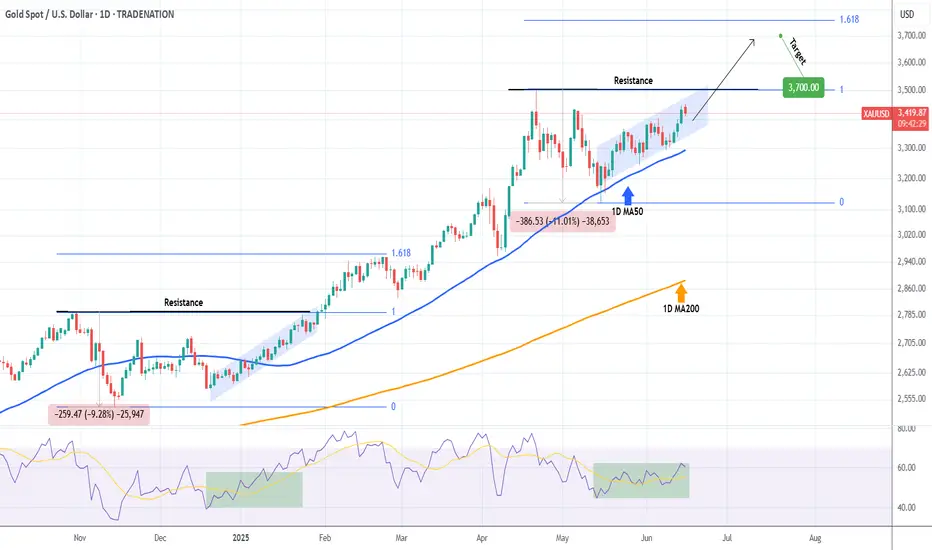
XAUUSD Strong break-out ahead to $3700.Gold (XAUUSD) is trading within a Channel Up, while being supported by the 1D MA50 (blue trend-line). This is similar to the December 19 2024 - January 30 2025 Channel Up, which when it broke above the previous Higher High Resistance, it rose straight to the 1.618 Fibonacci extension.
As a result, as long as the 1D MA50 supports, we are looking for a medium-term bullish break-out, possible by the end of July, targeting at least 3700.
-------------------------------------------------------------------------------
** Please LIKE 👍, FOLLOW ✅, SHARE 🙌 and COMMENT ✍ if you enjoy this idea! Also share your ideas and charts in the comments section below! This is best way to keep it relevant, support us, keep the content here free and allow the idea to reach as many people as possible. **
-------------------------------------------------------------------------------
Disclosure: I am part of Trade Nation's Influencer program and receive a monthly fee for using their TradingView charts in my analysis.
💸💸💸💸💸💸
👇 👇 👇 👇 👇 👇
XAUUSD:[GOLD]: First Drop And Then Reverse! Comment Your Views! Gold touched $3350 but was rejected at that level, dropping around 3288. The price shows some minor support at this region, which we’re currently monitoring. If it breaks through, it could touch our buying zone, reversing the trend. You can set three targets based on your own analysis and bias. Please use accurate risk management while trading.
If you’d like to contribute, here are a few ways you can assist us:
- Like our ideas
- Comment on our ideas
- Share our ideas
Team Setupsfx_🚀❤️
#XAUUSD[GOLD]:+2200 Pips Big Move! | Setupsfx_|Gold is currently accumulating in smaller timeframes, which suggests it’s in the early stages of a significant move. It’s possible that the price will reverse from either of the entry zones. There are three take-profit areas you can target, but only if they align with your view. This is an educational post, so please don’t blindly follow it – do your own analysis.
Like and comment for more!
Team Setupsfx_

GOLD D1 Chart Shorter Term UpdateHello Traders,
Gold D1 Chart just shared with you with crucial zone for now GOLD is facing war scenarios and keep goin in Buy Direction further you may check Israel & Iran War updates time to time for the latest scenarios
All eyes on for now 3500 Psychological Level we may expect some selling from 3500 but keep in mind but if war scenarios gets heat up then GOLD will may rise towards 3600/3700 or 3800 Psychological Levels
for downside only if market breaks below 3400 Psychological then it will move towards 3350 or even 3300 Psychological Level
Disclaimer: Forex is Risky

GOLD (XAUUSD): Waiting For Another Breakout
Following the latest news, I think you would agree with me that
Gold will most likely rise more.
Your technical confirmation can be a bullish breakout of the underlined
blue resistance and a daily candle close above 3435.
It will be an important trigger that will push the prices way up to a current ATH.
❤️Please, support my work with like, thank you!❤️
I am part of Trade Nation's Influencer program and receive a monthly fee for using their TradingView charts in my analysis.

Gold Market Analysis and Trading Recommendations for TodayYesterday, gold surged then pulled back in a washout move triggered by CPI data, before rebounding again in the evening on news-driven sentiment, closing the daily chart bullish. This morning's opening saw further rally breaking new highs, confirming strong bullish momentum. Today's strategy remains buying on dips with the uptrend.
On the 4H chart, gold stabilized at the mid-Bollinger band before rebounding with consecutive bullish candles. Moving averages are bullishly aligned and Bollinger bands are widening—all signaling strong bullishness. However, as the triangle consolidation range remains unbroken, chasing the rally is unadvised. Focus on dip-buying: key supports at 3,345–3,340 and 3,325; resistances at 3,385 and 3,400, where potential shorting opportunities may be considered based on price momentum.
XAUUSD
buy@3340-3350
tp:3370-3380
Investment itself is not the source of risk; it is only when investment behavior escapes rational control that risks lie in wait. In the trading process, always bear in mind that restraining impulsiveness is the primary criterion for success. I share trading signals daily, and all signals have been accurate without error for a full month. Regardless of your past profits or losses, with my assistance, you have the hope to achieve a breakthrough in your investment.

Gold Weekly Chart May Form a Mid-Term Bearish Pattern (3142)Gold faced resistance near 3338 and has pulled back,
but the 2-hour chart still suggests that the rebound isn’t over yet, with short-term targets at 3340–3350.
—
📌 For Long Position Holders:
If you're stuck in long positions, consider adding near 3326–3316 support
to average down the cost and prepare for an exit on the next rebound.
⚠️ However, be mindful of your account risk —
If your position is deeply in the red or the account is under pressure, closing out early might be the smarter move.
—
📅 Key Focus This Week: Weekly Chart Signals Critical
🔸 Price is currently testing weekly MA10 — a break below it would target MA20 around 3142
🔸 On the daily chart, MA60 is at 3234, and if support near 3388 breaks,
combined with weak rebound volume, a bearish trend could be confirmed.
In that case, even the 3273 support may fail under bearish momentum.
—
📣 Bottom Line: The bullish setup isn’t invalidated yet,
but caution is crucial when trading long —
📉 If momentum fades, adjust your strategy quickly to protect capital.

Gold: Market Analysis and Trading StrategiesSo far, although the price has risen, it has not yet broken through the upper resistance, and the lower support remains intact. Overall, the market is still in a narrow range of consolidation. From a technical perspective, the 2-hour chart shows a bullish bias, indicating a potential for continued upward movement in the short term.
However, if during this consolidation phase the price breaks below the key support at 3309, it is likely to further test the support zone around 3296–3288.
At this stage, traders can consider entering light long positions and gradually add to them on dips to reduce the average entry price. For more conservative traders, it's advisable to wait until a clear breakout occurs before taking action.
Watch the 3338–3352 area for potential short opportunities as it's a key resistance zone, and the 3303–3288 range for long entries as it offers strong support. Trading near these levels generally carries lower risk and a higher probability of profit.

XAUUSD rising while Inflation dropping. Historically BULLISH!Gold (XAUUSD) has been practically on a non-stop aggressive rise since the late 2022 Low. What's more interesting is that during this 2.5-year Bull run, the U.S. Inflation Rate (red trend-line) has been on a sharp decline, which is something you wouldn't traditionally expect out of a save haven asset like Gold.
On the contrary, Gold has been historically used as a hedge against high inflation, so when Inflation drops, you would have technically expected for Gold to drop too (and vice versa).
Since 1970, there have only been another 4 (relatively long) time periods when Inflation declined while Gold increased. On all occasions, Gold extended the rise by at least 1 year even when Inflation reversed.
In our opinion, the current divergence looks more like 1970 - 1972 and 2008 - 2009. This suggests that Gold is still within a Bull Cycle and has some more room to rise before a new Bear Cycle starts. Long-term we remain bullish on Gold.
-------------------------------------------------------------------------------
** Please LIKE 👍, FOLLOW ✅, SHARE 🙌 and COMMENT ✍ if you enjoy this idea! Also share your ideas and charts in the comments section below! This is best way to keep it relevant, support us, keep the content here free and allow the idea to reach as many people as possible. **
-------------------------------------------------------------------------------
💸💸💸💸💸💸
👇 👇 👇 👇 👇 👇

GOLD: Bullish Bias Holds, But Mind the Unfilled GapGold dipped below 3300 today and bounced back, though the gap near 3289 remains unfilled.
This shows buying interest is active, but also reveals that some sideline capital is still waiting for a full retest.
Combined with selling pressure on the rebound, it’s clear that bullish strength is currently limited.
—
🔍 Two Possible Scenarios from Here:
1️⃣ If support proves firm during consolidation, bulls may regain momentum and push higher
2️⃣ If support fails, price is likely to fill the 3289 gap before launching the next leg up
📌 Current Trade Outlook:
✅ Bullish trend remains intact
✅ Regardless of the short-term path, the direction is upward
✅ Watch resistance at 3331, with a key zone near 3348
—
⚠️ Note: The daily chart structure still needs further correction.
If volume remains weak after a second dip and a failed bounce follows, bears may take over again — in that case, the next downside target would be around 3258–3228
📩 Conclusion: Stay long-biased, but react flexibly to support strength and volume shifts.
6/9 Gold Analysis and Trading SignalsLast Friday, gold experienced a sharp drop, briefly testing the 3300 level. From a technical standpoint, the market has started to show early signs of bottom formation, which could materialize either as a double bottom / multiple bottom pattern, or through a direct upside breakout.
If the former unfolds, we expect a stronger and more sustainable rebound.
If it turns into a straight bullish leg, traders should be cautious of potential exhaustion in the rally, which may invite a renewed bearish attack.
📊 Key Macro Focus This Week:
Markets will be primarily influenced by data releases on Wednesday through Friday, including:
Monthly CPI
Initial Jobless Claims
Inflation Expectations
As a result, Monday's trading will be dominated by technical patterns, with a bias toward a corrective rebound. The strategic focus should be on buying near support, with short-term opportunities to sell near key resistance.
📌 Monday Trading Plan:
✅ Buy in the 3303–3286 zone (early base-building area)
✅ Sell in the 3343–3353 zone (overhead resistance)
🔄 Intraday pivot levels for tactical entries:
3338 / 3326 / 3317 / 3309
