XAUUSD Can it really get to $8000???Gold (XAUUSD) has been practically on a non-stop rally since the last time it tested its 1M MA50 (blue trend-line) 2 years ago (October 2023). It is no coincidence that the result of such a test was an aggressive rally, as this level has historically been Gold's long-term Support and what separates its Bull from its Bear Cycles.
More specifically, Gold has started trading within a multi-decade Channel Up since the August 1993 High. It first Bear Cycle (red Rectangle) started then end finished the moment it touched the pattern's bottom. Shortly after, the price broke sustainably above the 1M MA50, confirming the new Bull Cycle in the form of an internal (green) Channel Up.
This phase peaked a little above the 3.618 Fibonacci extension. That was when the latest Bear Cycle started, which again broke below the 1M MA50 and has been very similar in symmetrical terms to the first one. The new Bull Cycle started after the August 2018 Low.
With the use of the Time Cycles, we can estimate that in October 2029 the current long-term Bull Cycle might end. This doesn't mean that there won't be a sizeable correction until then, but the long-term bullish trend should stay intact.
By October 2029, contact with the Channel's top should have hit $8000, which is still marginally below the current 3.618 Fibonacci extension. This suggests that each of Gold's Time (Super) Cycle is approximately 18 years.
If such a continuous rise is materialized that doesn't only gives meaning to Gold's use as a 'safe-haven' but should also tell us a lot about future inflation and deliver a warning to economies and especially central bank strategy implementation.
-------------------------------------------------------------------------------
** Please LIKE 👍, FOLLOW ✅, SHARE 🙌 and COMMENT ✍ if you enjoy this idea! Also share your ideas and charts in the comments section below! This is best way to keep it relevant, support us, keep the content here free and allow the idea to reach as many people as possible. **
-------------------------------------------------------------------------------
💸💸💸💸💸💸
👇 👇 👇 👇 👇 👇
Xauusdsignals

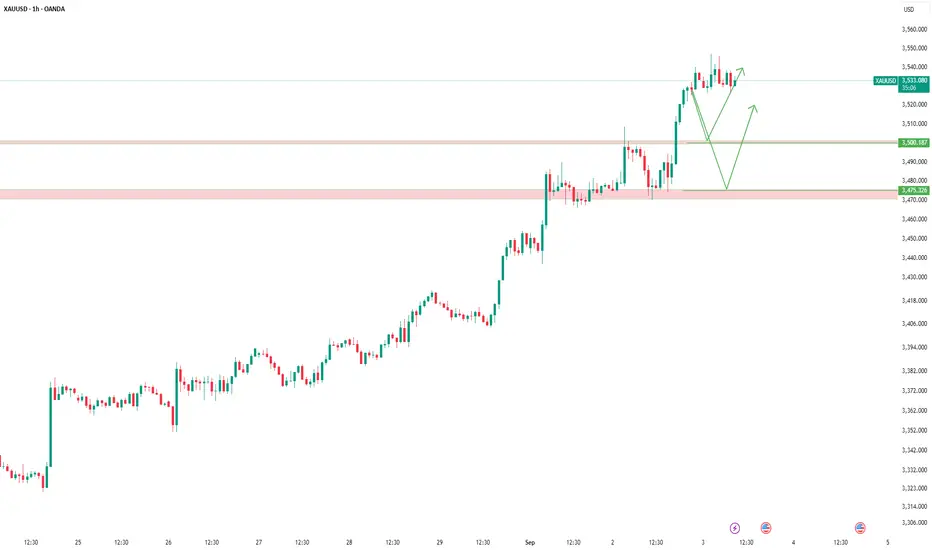
Gold head and shoulders top appears, beware of falling risksSeveral US data released an hour ago were all bullish for gold, including the crucial ADP and initial jobless claims figures. However, gold's price hasn't seen much of a rally.
I think this is because some investors are taking profits on the one hand, and on the other hand the data's impact on the September rate cut is decreasing.
I believe a September rate cut is inevitable, but the hype has been excessive. Gold prices have been rising for some time, and this has already been largely priced in.
In addition, the one-hour chart shows that if gold prices fall from 3550, a head and shoulders top pattern will form, with 3350 being the final shoulder.
So, I believe shorting gold is a viable option as long as it fails to hold above 3550.
📣If you have different opinions, please leave a message below to discuss

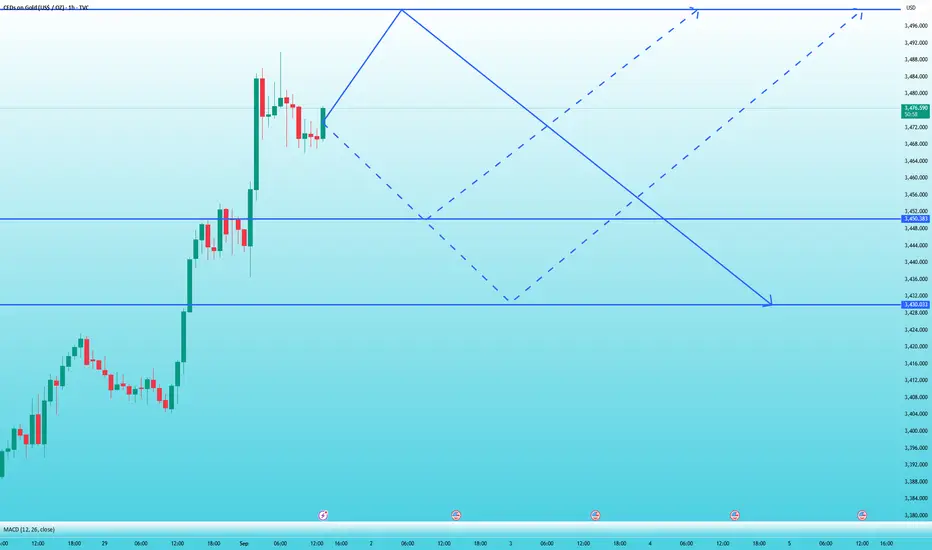
Waiting for Gold PullbackWe’re waiting for gold to retest the broken level, giving us a buying opportunity.
The $3500 and $3475 levels look like solid spots for long entries 📈.
As always, we don’t dictate where the market should go—we just follow it:
If the levels break to the downside, we’ll simply wait for a pullback to short 📉.
One of the keys to success is moving with the market, not stubbornly relying on a few lines drawn on the chart.
✅ If the market wants to go up—great, we’re with it.
✅ If it wants to drop—that’s fine too, we’re still with it.
Levels are just tools to help us align with the market—not holy lines that must work.
Everything in trading is probabilities 🎯, and our levels work about 85% of the time.
Gold (XAU/USD) 3 September, 20251. Macro Outlook (Daily)
Gold continues to maintain a bullish macro structure, with consecutive higher highs (HH) and higher lows (HL) defining the trend. The most recent Break of Structure (BOS) above the $3500 handle confirms sustained upward momentum. Liquidity remains positioned above $3560 – $3575, where equal highs and untested buy-side liquidity are waiting to be taken.
The daily bias is therefore firmly bullish unless $3490 is broken, in which case deeper retracements may emerge.
2. Swing Structure (4H)
On the 4H chart, gold is respecting bullish order flow:
Liquidity below $3515 – $3505 remains vulnerable for inducement sweeps.
A fresh Fair Value Gap (FVG) $3518 – $3508 is unmitigated.
A bullish Order Block (OB) $3512 – $3500 serves as structural demand.
Together, these form a discount zone in alignment with the daily bias, offering high-probability continuation setups.
3. Execution Refinement (1H)
The 1H chart sharpens execution:
OTE retracement cluster $3520 – $3510 aligns with the 61.8–78.6% retracement of the last impulse.
Asia low at $3528 has been swept, providing inducement for London and NY session continuation.
Anchored VWAP from the weekly open sits at $3518, reinforcing institutional demand.
This confluence tightens the execution-ready buy zone for today.
4. Execution-Ready Zones
🔵 Primary Buy Zone (Golden Zone)
Entry: $3520 – $3510
Stop Loss: $3495
Rationale: Supported by daily bullish bias, fresh 4H OB, 4H FVG, 1H OTE, liquidity sweep, VWAP alignment, round number support, and resting liquidity.
Bias: High-probability long setup, >8 institutional confluences.
🔵 Secondary Buy Zone
Entry: $3505 – $3495
Stop Loss: $3480
Rationale: Deep discount, OB extreme, and structural inducement.
Bias: Backup long zone if deeper retracement occurs.
🔴 Primary Sell Zone
Entry: $3560 – $3575
Stop Loss: $3585
Rationale: Liquidity grab above equal highs, premium array, and supply confluence.
Bias: Countertrend fade, scalp only.
🔴 Secondary Sell Zone
Entry: $3595 – $3610
Stop Loss: $3625
Rationale: Weekly high liquidity, premium overextension, and 161.8% extension cluster.
Bias: Opportunistic fade; not suitable for swing shorts.
5. Risk Management & Profit-Taking Strategy
Instead of rigid pip targets, traders should adopt liquidity-based scaling:
Partial exits at session highs/lows (Asia, London, NY).
Major targets at daily/weekly liquidity pools (equal highs, equal lows, imbalance fills).
Leave runners open toward higher-timeframe liquidity magnets — notably $3800.
This approach ensures alignment with institutional order flow while capturing both intraday and swing opportunities.
🌟 Golden Zone of the Day
$3520 – $3510 (Buy Zone)
Backed by 8+ institutional confluences across Daily, 4H, and 1H.
Provides the highest-probability entry point for continuation of the prevailing bullish trend.
6. Strategic Conclusion
Gold’s current price action confirms institutional bullish order flow. Demand zones in the $3520 – $3510 region represent the most compelling setup for today, offering clean alignment across Daily, 4H, and 1H.
Countertrend shorts remain viable only at liquidity clusters near $3560 – $3575 and $3595 – $3610, but should be managed conservatively given the macro bullish context.
Professional traders should prioritize long exposure, scaling out at liquidity levels while leaving runners toward untested buy-side objectives higher up the curve.
📌 Institutional Note: Unless the $3490 level is breached, the path of least resistance remains higher, with liquidity objectives above $3560 – $3575 as the next upside magnet.

Start shorting gold in a swing trade, target: 3435-3415Gold has just broken through the 3500 level and continued to near 3509. Bullish momentum is strong. Currently, gold has significantly deviated from technical indicators and is driven entirely by market sentiment. However, from a trading perspective, it's difficult to easily find a suitable entry point to participate in a long gold trade.
However, since yesterday's 3480 level, I've been increasing my short positions in gold and planning swing trading. Although there has not been a decent pullback yet, there are still reasons to support my shorting of gold!
1. While prices above 3500 have broken through historical highs, this is still uncharted territory, and bulls may be more cautious and hesitant.
2. Market expectations for a rate cut are currently growing, but after the Fed implements the cut, gold could experience a significant pullback, creating a "buy the expectation, sell the reality" phenomenon.
3. Although sentiment is currently driving the market, and technical indicators are completely distorted, there's still room for a technical pullback once market sentiment returns to rationality.
4. Based on current signs, gold may be accelerating towards its peak.
These are the reasons why I'm continuing to increase my short positions in gold. As a swing trade, while the holding period may be extended, my target for the short position remains firmly in the 3435-3415 range. If gold breaks below this range, the trend could extend to 3400-3390.
Of course, during swing trades, the longer holding period doesn't prevent us from executing short-term, daytime long trades. For short-term, daytime long trades, the current support area worth watching is 3485-3475. We can wait for gold to retrace to this area and then participate in gold long trades.

Gold Bulls or Bears — Who Wins the Next Move on XAU/USD?🏴☠️ XAU/USD “Gold Heist Layer Plan” 💰🔑 (Day/Scalping Trade)
Dear Money Bandits & Thief OG’s, 🎭💎
The vault is open, and today’s Gold vs U.S Dollar (XAU/USD) robbery plan is set!
🎯 Thief Plan: Bullish
We rob the market with layered entries — not one bullet, but multiple shots at the vault.
👉 Thief Strategy = Layering 🎯 (multiple buy/sell limits stacked like laser traps).
Entry (Layered Loot):
💰 3370.0
💰 3360.0
💰 3350.0
(Add more layers based on your pocket size — the deeper you stack, the fatter the loot)
Stop Loss (Thief Exit Door):
🛑 @3320.0 (Adjust your SL with your own thief instincts & bankroll).
Target (Escape Point 🚓):
Police barricade spotted at 3440.0 🛑🚨
Our team escapes before that with bags full at 3430.0 🎒💸
🔐 Thief Notes:
This isn’t one single smash & grab. We layer the vault with limit orders — building positions slowly, stealing piece by piece.
Day traders & scalpers: only ride with the bullish getaway car 🚗💨.
Manage your loot with trailing SL — don’t let the cops take it back.
📢 Stay sharp, thieves:
Markets change fast. Keep eyes on fundamentals, news traps & sentiment shifts 📰⚡.
💎 If you vibe with this Thief Robbery Plan, smash that ❤️ & 🚀 Boost button — join the Thief Gang and let’s steal profits together, one layer at a time. 🏆💸

Whether gold can break through 3500 becomes the keyGold fell at the opening today before rising. Following the US Court of Appeals for the Federal Circuit's ruling that Trump's tariffs were illegal, the market rebounded strongly, reaching a high of 3489, edging closer to its all-time high.
Our sell order on Friday was hit by the stop loss of 3460 because we did not close the profit in time, which unfortunately ended our continuous profit streak.
As the gold price approaches its historical high, the resistance it faces from above will certainly become stronger. It is very critical whether it can break through 3500 in the next two days. If it fails to break through, it will face a decline.
Therefore, you must not chase the current rise in gold, at least before it breaks through 3500 or retreats to the support below.
The US market is closed today for Labor Day, reducing liquidity and volatility. Therefore, I don't anticipate many good trading opportunities. Everyone should relax and take it easy. I'll notify you if I see a good opportunity.
Gold near 3500, Who Wins—Bulls or Bears?Today, after gold touched around 3437 during the retracement, it was pushed up to around 3490 again by market sentiment. The bullish momentum was extremely strong and it is currently in a strong bullish trend. According to the current gold trend, there may be room for continuation above. However, in the transaction, I have made it clear that I will no longer aggressively chase the rise of gold!
First, gold has risen sharply under the influence of fundamentals, and it is difficult to follow up in time on the technical level, resulting in a technical pullback demand for gold; in addition, gold has shown obvious signs of acceleration during the rise, and the market often easily has turning points after acceleration, and although gold is in an obvious bullish trend, it is still under considerable pressure before breaking through the previous high of 3500. These are the reasons why I am unwilling to continue chasing the rise in gold. The most important point is that since the market expectations of interest rate cuts have increased, a large amount of buying has appeared to push up gold prices before the Federal Reserve announced the interest rate cut. It is very likely that the phenomenon of "buying expectations and selling facts" will occur.
Therefore, in the current transaction, I do not advocate continuing to chase gold at high levels. On the contrary, in the 3475-3495 area, I will consider creating as many short positions as possible as a swing trade, and be ready to welcome gold to retreat to the 3435-3415 area at any time.
Of course, because swing trading requires a certain period of time, we can still participate in intraday short-term trading during the execution of swing trading, follow the mainstream trend and try to go long on gold with the support area. The support area we must first pay attention to is in the 3460-3450 area. If gold first touches this area during the retracement process, we can consider going long on gold in intraday short-term trading.
CAPITALCOM:GOLD FX:XAUUSD TVC:GOLD FOREXCOM:XAUUSD OANDA:XAUUSD

XAUUSD about to make new ATH and head to $3800Gold (XAUUSD) is on a huge rebound following the double bounce on its 1W MA20 (red trend-line), a level which has been previously associated with the start of very strong rallies.
The 2-year Channel Up that started back in October 2023 has always formed a consolidation Triangle before the next Bullish Leg and on the three past occasions that was initiated after a 1W MA20 contact.
Assuming we 'just' repeat the minimum +22.41% Bullish Leg, we are targeting at least $3800 before the current peaks.
-------------------------------------------------------------------------------
** Please LIKE 👍, FOLLOW ✅, SHARE 🙌 and COMMENT ✍ if you enjoy this idea! Also share your ideas and charts in the comments section below! This is best way to keep it relevant, support us, keep the content here free and allow the idea to reach as many people as possible. **
-------------------------------------------------------------------------------
💸💸💸💸💸💸
👇 👇 👇 👇 👇 👇

PLAN NEXT WEEK XAUUSD 3500Related Information:!!!
📌A sustained move beyond this level could allow Gold to reclaim the key $3,400 mark, which, if decisively breached, may negate the bearish outlook and shift the short-term bias in favor of bullish traders. XAU/USD could then advance towards the intermediate resistance at $3,434–$3,435, on its way to the $3,451–$3,452 region — or the nearly two-month high reached last week — and potentially the all-time high around the psychological $3,500 level.
Personal opinion:!!!
🎯 Gold price recovered to break through 3450 to gain liquidity and continue the uptrend
Important price zone to consider : !!!
🌟Resistance zone point: 3440 zone
Sustainable trading to beat the market

GOLD XAUUSD - Pullback Expected before the Next Leg UpGold (XAUUSD) has been on a solid bullish run, consistently pushing higher after each minor retracement. Now, we’re eyeing a potential pullback toward a key support zone at 3420–3400, where buying interest is likely to resurface.
If price action confirms a bounce from this zone, we could see a continuation of the uptrend toward 3450, and if momentum holds, possibly stretching to 3490–3500.
🔻 Trade Setup – Long Opportunity on Pullback
Entry: Buy Gold (XAUUSD) at 3420
Add-on Dip: 3400
Targets: 3450, then 3490–3500 (marked on chart)
Invalidation: Daily close below 3385
📌 Risk/Reward Outlook
This setup presents a tight risk with attractive upside potential. As always, stick to solid risk management and size your positions based on your personal trading plan.
👍 Agree with this view?
Drop a like, leave your comments, and let’s discuss this setup together!
Your feedback keeps the community sharp and growing. 🔥
Happy Trading,
– The InvestPro Team

XAU/USD – Bullish Breakout: Buy Dips Toward $3,409 Target📊 XAU/USD (Gold) – 2H Analysis
Gold has just broken out of its descending channel, showing a clear change of character (CHOH) around the $3,348–$3,358 support zone. This breakout suggests bullish momentum is taking control after weeks of compression.
Key Observations:
✅ Support Zone: $3,348–$3,358 is now a strong demand zone (previous rejection area flipped to support).
✅ Moving Averages: Price is above both the EMA 70 ($3,342) and EMA 200 ($3,346), strengthening the bullish bias.
✅ Projection: A potential continuation rally toward $3,409 (major liquidity target).
⚠️ Risk: If the support zone fails, price could re-test $3,334 or even $3,326.
Trading Plan (Short-Term):
Entry (Buy): Around $3,358–$3,348 (support retest).
Stop Loss: Below $3,342 (under EMAs).
Target 1: $3,390
Target 2: $3,409
👉 In summary: Gold is in a bullish reversal phase, and buying dips into the support zone offers the best risk-reward setup.

8/29: Sell in the 3446–3458 ZoneGood evening, everyone!
After testing the 3419–3427 resistance zone, gold pulled back briefly, then found support and broke higher, keeping the 1D uptrend intact. However, after such a sharp short-term rally, a pullback is likely.
📌 Key Supports: 3433–3428–3423
📌 Trading Plan: Short first, then buy
Main sell zone: 3446–3463
Look for short-term buys near support retests
Watch resistance reaction at 3438–3448
Heading into the weekend, news-driven uncertainty may increase — risk management is essential.

Gold (XAU/USD) Technical Outlook - 29 August 2025Gold remains in a highly reactive zone, with price currently consolidating near the $3410 handle. Institutional order flow shows a battle between bulls defending discount demand zones and bears attempting to exploit premium supply levels. By combining Daily, 4H, and 1H confluences, today’s analysis outlines the most execution-ready buy and sell zones with defined entries, stop-loss levels, and profit targets.
🔹 Primary Buy Zone – $3388 to $3396
This is the highest-probability demand area for today. On the Daily timeframe, the zone sits within a deep discount region of the last bullish leg, aligning with the broader macro bias. The 4H chart reveals a fresh, unmitigated bullish order block, while the 1H structure confirms a BOS (Break of Structure) and liquidity sweep beneath equal lows.
Momentum indicators support this view — RSI is approaching oversold levels, and MACD momentum is shifting bullish. Volume also highlights absorption, suggesting institutional accumulation.
Entry: $3392
SL: $3384
TP1: $3415
TP2: $3428
🔹 Secondary Buy Zone – $3365 to $3372
If the primary demand fails, the next strong support sits around $3365–$3372. This zone overlaps with a Daily breaker block and coincides with the 50% retracement of the previous swing leg. On 4H, liquidity is pooled just below $3370, while 1H imbalance (FVG) aligns with demand.
RSI divergence also strengthens the bullish probability here.
Entry: $3368
SL: $3358
TP1: $3390
TP2: $3410
🔹 Primary Sell Zone – $3425 to $3435
This is the strongest intraday supply zone. On the Daily timeframe, price approaches a premium level of the current retracement, while 4H charts show a fresh supply zone formed from institutional distribution. The 1H chart reveals liquidity buildup above $3428, creating an engineered high.
RSI is flashing bearish divergence at this level, with volume showing prior rejection and imbalance — confirming potential sell-side pressure.
Entry: $3430
SL: $3438
TP1: $3410
TP2: $3395
🔹 Secondary Sell Zone – $3448 to $3458
This zone sits higher, acting as a fallback supply level. It overlaps with a Weekly supply zone, while 4H structure confirms old consolidation highs resting here. If tapped, price is likely to engineer liquidity before displacement. ATR also shows exhaustion at this level, making it a potential reversal point.
Entry: $3453
SL: $3463
TP1: $3430
TP2: $3410
🏆 Executive Summary – Golden Zone
The Primary Buy Zone ($3388–$3396) is nominated as today’s Golden Zone. This area aligns with Daily discount, 4H unmitigated demand, and 1H structural confirmation. With multiple confluences (order block, BOS, liquidity sweep, RSI, MACD), it presents the highest reward-to-risk opportunity.
Golden Execution Idea:
Buy $3392 → SL $3384 → TP $3428 (≈1:4 RR)
Final Thoughts
Gold is currently positioned at a critical juncture, with well-defined buy and sell zones framing today’s opportunities. Traders should stay disciplined, execute only on confirmed setups, and remain aware of liquidity manipulation around key levels. The $3388–$3396 Golden Zone offers the most institutionally aligned trade for today, but alternative supply and demand levels provide structured backup scenarios.

GOLD Resistance Ahead!
HI,Traders !
#GOLD is trading in an
Uptrend and Silver shot
Up sharply today and it
Is now locally overbought
So after the retest of the
Horizontal resistance above
At 3436.05 from where we
Will be expecting a local
Bearish move down !
Comment and subscribe to help us grow !

I might be the first to start shortingAgainst the backdrop of strengthened expectations of interest rate cuts and Trump's continued tough stance, gold rose above the 3400 mark and continued to above 3410. The upward momentum was relatively strong and market sentiment was optimistic. But the more this happens, the more dangerous it feels! In fact, from a short-term perspective, the foreseeable target area above is: 3415-3425 area, which has only 100-150pips of room for growth from the current gold price. So I think there is no need to continue chasing long gold for the time being.
From the current structure, although gold is in a fluctuating upward structure, the trading volume is gradually decreasing after gold broke through 3410, proving that as gold continues to rise, the market has gradually become more cautious. Judging from the candlestick pattern, the trend line constructed from the highs of 3500 and 3440 is currently facing resistance near 3415, while the resistance of the trend line constructed from 3452 and 3440 is currently near 3425. Therefore, the current more obvious resistance area is in the 3415-3425 area. In comparison, there is a larger retracement space below, firstly in the 3395-3385 area, and then in the 3375-3365 area.
Therefore, at this stage, I will no longer aggressively chase the rise of gold; instead, I will start shorting gold in batches above 3410, and then patiently wait for gold to retrace!

Gold (XAU/USD) – 30m – AMD (Accumulation / Manipulation / DistriGold (XAU/USD) – 30m – AMD (Accumulation / Manipulation / Distribution)
🔹 Phase 1: Accumulation
The market showed a period of range-bound price action in the lower zone, where liquidity was building up.
This phase indicates that smart money was collecting positions, creating the base for the next move.
The price respected the liquidity trendline and showed a gradual shift of demand.
---
🔹 Phase 2: Manipulation
A clear stop-hunt / liquidity grab occurred above the accumulation range.
This move is characterized by a false breakout above the consolidation zone, designed to trap early buyers.
The spike in volume and quick rejection signals the transition into distribution.
---
🔹 Phase 3: Distribution
Price moved into the 3,406 – 3,410 area, marking the distribution zone.
This is where supply overtakes demand as institutional players offload positions.
Strong rejection candles confirm sellers are active here.
Risk of reversal is high, and any long trades are considered risky at this point.
---
🔹 Outlook & Trading Plan
If price holds below 3,406, we can expect a downward continuation toward 3,377 and potentially the 3,368 liquidity pool.
Any short entry should ideally align with rejection signals in the distribution phase.
If the market breaks and sustains above 3,410, it invalidates the distribution setup and indicates continuation of bullish momentum.
---
✅ Bias: Bearish under 3,406
🎯 Targets: 3,377 – 3,368
❌ Invalidation: Above 3,410
Analysis: mohsen mozafari nejad
Adminstration of persiaux king academy

Watch Resistance at 3391–3398, Avoid Chasing HighsGold rebounded strongly from 3352 support today, breaking through the 3358–3366 resistance and rallying to 3386 before consolidating. During this phase, multiple tests of the 3368 support held firm, and price has now returned above 3380, keeping the overall bias bullish.
⚠️ However, caution is warranted: resistance is not only near 3386 but also at the 3391–3398 zone, where fresh selling pressure is likely. The upside looks limited, making blind chasing risky.
📌 Suggestion: Focus on sell opportunities around resistance. For larger accounts with proper position sizing, chasing a short-term rally may be manageable; but for smaller accounts, chasing highs carries significant risk and is not recommended.
These are my personal views for reference only. Please evaluate carefully based on your own situation. If you’d like more tailored guidance, feel free to reach out.

Gold (XAU/USD) 27 August 2025Gold continues to trade in a well-defined structure, with buyers defending higher-lows while sellers attempt to cap upside momentum near the $3400 handle. Today’s analysis blends the Daily → 4H → 1H confluences to outline execution-ready trading zones with clear invalidation and profit objectives.
🔵 Demand Zones – Where Buyers Are Positioned
📍 Primary Buy Zone: $3368 – $3373
This zone carries the strongest institutional weight for the day:
Daily higher-low structure remains intact above $3365.
4H bullish order block + fresh BOS confirmation.
ICT’s Optimal Trade Entry discount (0.618–0.705 retracement).
RSI bullish divergence on 1H; MACD slope turning positive.
Strong absorption wick confirmed at $3370 on the last sweep.
📌 Trade Plan:
Entry: $3368 – $3373
SL: Below $3360
Targets: $3395 → $3410
📍 Secondary Buy Zone: $3350 – $3355
A deeper liquidity-driven fallback demand level:
Untested 4H demand block from breakout leg.
Daily demand base aligning with sell-side liquidity resting below $3355.
MACD crossover and ATR volatility expansion on 1H support demand.
📌 Trade Plan:
Entry: $3350 – $3355
SL: Below $3345
Targets: $3380 → $3400
🔴 Supply Zones – Where Sellers Are Positioned
📍 Primary Sell Zone: $3402 – $3408
The first line of resistance for intraday traders:
4H lower-high structure aligning with Daily resistance.
Fresh bearish order block and FVG imbalance inside zone.
RSI divergence (bearish) on both 4H & 1H timeframes.
Thin volume node above $3400 → prone to rejection.
📌 Trade Plan:
Entry: $3402 – $3408
SL: Above $3415
Targets: $3388 → $3370
📍 Secondary Sell Zone: $3420 – $3426
A liquidity sweep zone with higher timeframe supply:
Daily supply block remains unmitigated.
Buy-side liquidity pool resting above $3420.
ATR extension = capped intraday volatility.
VWAP overextension favors mean reversion.
📌 Trade Plan:
Entry: $3420 – $3426
SL: Above $3435
Targets: $3400 → $3385
🟡 Executive Summary – The Golden Zone
Today’s Golden Zone is the Primary Buy Zone ($3368 – $3373).
It aligns across Daily (higher-low support), 4H (fresh bullish OB), and 1H (execution refinement). Backed by 6+ confluences, this zone offers the highest-probability continuation trade, targeting the $3410 region.
✅ Bias: Maintain bullish stance above $3365. Look for dip buys around $3368–$3373, while fading exhaustion only at defined sell zones above $3402.

Gold (XAUUSD) Set to Hit Resistance | Sell on Rise SetupGold (XAUUSD) is approaching a critical resistance zone between 3492 and 3494, where sellers have previously stepped in to push prices lower. We anticipate a similar reaction this time, presenting an opportunity to enter a short position on any upward move into this prime supply area.
🔻 Short Trade Setup – Fade the Rally
Entry: Sell Gold (XAUUSD) at 3392
Add-On: Sell more Gold (XAUUSD) if price rises to 3399
Targets: Refer to chart for detailed target zones
Invalidation: If daily closes above 3406, consider the setup invalid
📉 Risk-Reward Profile
This setup offers an attractive risk-reward ratio, particularly for short-term traders looking to capitalize on a potential rejection at resistance. Maintain tight stops and disciplined position sizing to manage risk effectively.
Gold (XAUUSD) has enjoyed a strong rally, but the odds now appear to favor a pullback. Watch price action and momentum closely within the resistance zone for confirmation.
👍 If you find this idea useful, please like and share your thoughts in the comments. Let’s build a community of sharp traders sharing insights!
🔔 Follow for more high-probability trade setups and market analysis.
Happy Trading,
– The InvestPro Team

Final Bear Profit—Then Gold Turns BullishSupported by Trump's statement and geopolitical tensions, gold continued to rise to around 3394 and is currently fluctuating narrowly around 3390.
Although the upward momentum of gold seems strong, the bulls are not resolute during the rise. Instead, they will launch an attack again after repeatedly testing the support. It is expected that the market is not highly unanimous in its agreement on the continuation of the strong bull market stimulated by the news, so the short-term volatility of gold will be exacerbated during the rise.
As gold continues to rise, it is clearly under pressure in the 3400-3410 area in the short term. Moreover, the bullish sentiment of gold has obviously weakened before facing this area, so we must consider that gold may still retreat after being under pressure in the short term. Below, we should first note the short-term support area of 3385-3375. If gold fails to effectively break below this area during a pullback, it will likely retest 3400.
Therefore, in short-term trading. At present, we can consider shorting gold appropriately in the 3390-3400 area. If gold retreats as expected, we will first observe the performance of gold in the 3385-3375 area. If it cannot effectively fall below this area, we can adjust the trading strategy and re-enter the long trade!

GOLD Local Short!
HI,Traders !
#GOLD is going up now
But will soon hit a horizontal
Resistance of 3394.70 from
Where we will be expecting a
Local pullback and we will
Be expecting a local move down !
Comment and subscribe to help us grow !

GOLD Bullish Breakout!
HI,Traders !
#GOLD made a bullish
Breakout of the falling resistance
And the breakout is confirmed
So we are bullish biased
And we will be expecting
A further bullish move up !
Comment and subscribe to help us grow !
