Gold Strategy Analysis for Next WeekGeopolitical Front: Multiple regional conflicts escalate, risk premium continues to accumulate
The Israeli-Palestinian conflict has reached a boiling point: Israel's military strikes on Gaza have continued to intensify, resulting in over 11,000 Palestinians killed, with children accounting for over 40%. The humanitarian crisis has drawn global condemnation. Although a hostage exchange agreement was reached between the two sides, Netanyahu explicitly stated that "after eliminating Hamas, we will fully control Gaza", indicating a clear trend of prolonged conflict; Hezbollah has issued a warning to the United States about a naval strike, and the risk of conflict spillover has significantly increased.
The intensity of the Russia-Ukraine conflict has risen: The Russian army has eliminated approximately 4,825 Ukrainian soldiers within a week, achieving breakthroughs in several directions such as Kupiansk and Donetsk. The Ukrainian ammunition depot has been destroyed, and NATO's assistance to Ukraine has been limited due to funding issues (the Pentagon has only 1 billion US dollars left for aid to Ukraine), and the balance of the conflict continues to tilt, making the demand for geopolitical risk aversion difficult to abate.
Global credit system turmoil: Moody's has downgraded the outlook for the US rating to negative, and in addition to the policy divergence of the Federal Reserve, the credit foundation of the US dollar has been impacted, and the attractiveness of gold as the "ultimate value storage tool" has significantly increased.
Next week's trading strategy and analysis
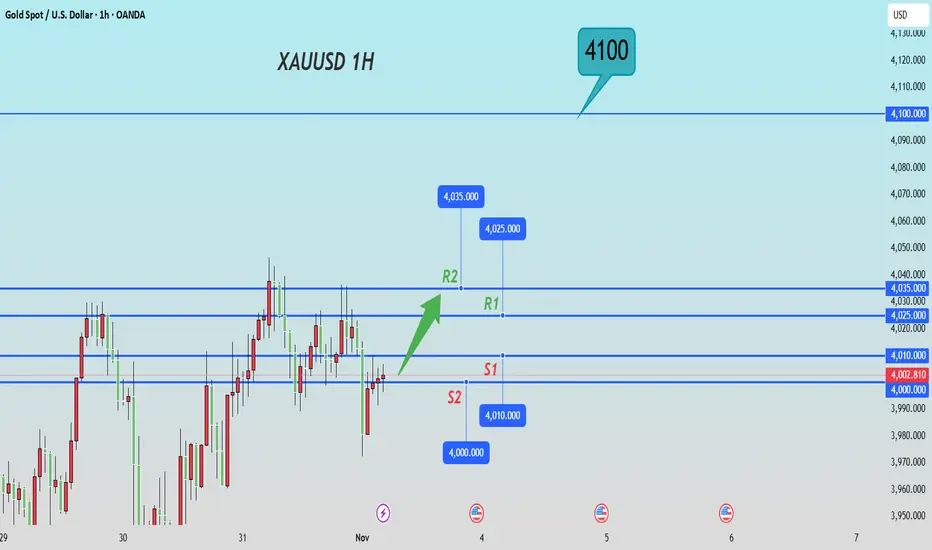
buy:4000-4010
tp:4025-4035-4100
sl:3995
Xauusdsignals
Gold Price Outlook – Trade Setup (XAU/USD)📊 Technical Structure
OANDA:XAUUSD Gold is consolidating near $4,000, following a rebound from the $3,948–3,957 support zone. The price faces strong resistance between $4,008–4,016, where there is a possibility to retrace back to the trendline. A rejection from this zone could confirm a short-term pullback toward support, while a decisive breakout above $4,023 may open the door to $4,050 and beyond.
🎯 Trade Setup
Entry: $4,008 – $4,016 (resistance retest)
Stop Loss: $4,023
Take Profit: $3,957 / $3,948
Risk-Reward Ratio: ≈ 1 : 3.8
🌐 Macro Background
Gold extended its recovery for the second consecutive day amid renewed safe-haven demand, but the upside remains capped by the Fed’s hawkish stance. As FXStreet’s Haresh Menghani noted: “Gold trades with a positive bias for the second straight day, though remains capped below $4,050 amid mixed fundamental cues.” 【FXStreet】
The U.S. government shutdown concerns continue to weigh on sentiment, softening the Dollar slightly and supporting gold’s defensive bid. However, Fed Chair Powell’s hawkish tone—stating that another December rate cut “is not a foregone conclusion”—keeps the USD underpinned and limits further gold gains.
In addition, the de-escalation in U.S.–China trade tensions has improved risk appetite, reducing safe-haven flows. This mixed backdrop leaves gold oscillating within a tight range ahead of key FOMC member speeches and month-end flows.
🔑 Key Technical Levels
Resistance: $4,008 – $4,016
Support: $3,948 – $3,957
Psychological Level: $4,000
📌 Trade Summary
Gold trades near $4,000, balancing safe-haven support and Fed-driven headwinds. The short-term bias favours selling near resistance ($4,008–4,016) targeting the $3,957 zone, with stops above $4,023. A sustained close above $4,023 would invalidate this bearish bias.
⚠️ Disclaimer
This analysis is for reference only and does not constitute trading advice. Trading involves significant risk, and proper risk management is essential.

Gold Price Outlook – Trade Setup (XAU/USD)📊 Technical Structure
TVC:GOLD Gold rebounded from the $3,931–3,937 support zone, regaining traction above $3,950. The chart shows potential upside toward the $3,981–3,988 resistance zone, though price is still within a short-term range. If buyers maintain momentum, a break above $3,988 could open the way to $4,000. Conversely, failure to hold above $3,931 may trigger renewed downside pressure.
🎯 Trade Setup
Entry: $3,937 – $3,931 (support retest)
Stop Loss: $3,929
Take Profit: $3,981 – $3,987
Risk-Reward Ratio: ≈ 1 : 5.67
🌐 Macro Background
Gold attracted safe-haven bids after snapping a four-day losing streak. As FXStreet’s Haresh Menghani notes: “The US Dollar drifts lower amid shutdown concerns, lending some support to Gold.” 【FXStreet】
The USD weakened despite the Fed’s hawkish stance, pressured by economic uncertainty from the prolonged U.S. government shutdown.
The Trump–Xi meeting offered a softer equity market tone, reflecting lingering geopolitical caution.
The Fed cut rates by 25 bps as expected, but Chair Powell rejected expectations of another December cut, limiting Gold’s upside.
Traders now await FOMC member speeches for clues on the future rate-cut path.
This combination leaves Gold supported by safe-haven demand but capped by Fed’s hawkish tilt.
🔑 Key Technical Levels
Resistance: $3,981 – $3,988
Support: $3,931 – $3,937
Psychological Level: $4,000
📌 Trade Summary
Gold holds firm above $3,950 with renewed safe-haven flows, but faces resistance near $3,985. A bullish setup favours buying dips into support ($3,931–3,937) with targets at $3,987. Caution is warranted as Fed commentary could inject volatility.
⚠️ Disclaimer
This analysis is for reference only and does not constitute trading advice. Trading involves significant risk, and proper risk management is essential.

GOLD Will Go Down!HI,Traders !
#GOLD is making a
Bullish rebound after a
Bearish breakout but will soon hit a new
Horizontal resistance
Of 4038.09 from where
We will be expecting a
Further move down !
Comment and subscribe to help us grow !

GOLD Bearish Bias!
HI,Traders !
#GOLD made a bearish
Breakout of the key
Horizontal level of 4189.93
Which is now a resistance
AndAfter retesting that area we
will be expecting
A further move down !
Comment and subscribe to help us grow !

GOLD (XAUUSD): Short Trade Before the FED
I see an intraday pullback trade on Gold ahead of
FOMC & FED Interest Rate Decision today.
The price will likely retrace from the underlined resistance,
following a confirmed bearish imbalance and a formation
of a double top pattern.
Expect a bearish movement at least to 3988 level.
❤️Please, support my work with like, thank you!❤️
I am part of Trade Nation's Influencer program and receive a monthly fee for using their TradingView charts in my analysis.

ANFIBO | XAUUSD - Bullish Head & Shoulder [10.29.2025]Hi traders, Anfibo's back!
XAUUSD Analysis – Daily Trading Plan
Overall Picture:
OANDA:XAUUSD recently reached a new ATH near $4,400/oz, before undergoing a healthy correction back to the $3,890 support level following an exceptionally strong rally fueled by geopolitical tensions. After this retracement, gold is now consolidating around the $4,000 zone, showing signs of breaking above the descending trendline on the H1 timeframe — a signal that short-term bullish momentum may be reemerging.
From a structural standpoint, this pullback appears to be part of a technical correction within an ongoing uptrend, not a trend reversal. Currently, the market is stabilizing and setting up for a potential new wave upward. I’m personally watching for a Head & Shoulders (H&S) formation to develop — this could offer optimal Buy and Sell opportunities depending on which neckline breaks first.
I still believe gold is likely to revisit the $4,200 area soon , as long as the $3,890 support holds firm and global risk sentiment continues to favor safe-haven assets.
Trading Plan for Today:
>>> SELL ZONE:
ENTRY: 4135 - 4150
SL: 4165
TP: 4045 - 4010 - 4000
>>> BUY ZONE:
ENTRY: 4000 - 4010
SL: 3990
TP: 4135 - 4150 - 4200
Risk Management:
- Prioritize Buy setups following the higher-timeframe trend; Sell only for intraday scalps.
- Maintain a minimum Risk:Reward ratio of 1:2.
- Avoid entries during major geopolitical or economic announcements.
- Monitor the Head & Shoulders pattern closely — confirmation will guide the next major move.
Conclusion:
Gold has completed a healthy correction after its parabolic surge to $4,400, and the market is now regrouping around the $4,000 zone, with early signs of renewed bullish momentum. As long as $3,890 remains intact, the broader trend remains bullish, and I expect a potential rebound toward $4,200 in the near term.
Patience and precision are key here — waiting for the Head & Shoulders formation to confirm will provide the best entry signals for both sides of the market. Until then, the bias remains bullish with a short-term recovery underway.
GOODLUCK, LOVE U GUYS!

ElDoradoFx PREMIUM – GOLD ANALYSIS (29/10/2025, LONDON SESSION)1. Market Overview
Gold recovered strongly from 3,918 lows, printing a clean bullish reversal overnight during Asia, now trading near 3,990–3,998.
The market structure has shifted short-term bullish after a clear CHoCH and BOS, but price is testing heavy resistance at the psychological 4,000 level and the H1 supply zone (3,995–4,013).
London session opens at a decisive point — momentum favors buyers, but a rejection at 4,000–4,013 could trigger a short-term pullback before continuation.
⸻
2. Technical Breakdown
🔹 Daily (D1):
• Price bounced from 3,918 forming a bullish rejection candle.
• RSI turning upward near 50, showing recovery strength.
• Long-term uptrend intact above the 100 EMA (3,842) but short-term correction not complete.
✅ Bias: Neutral to bullish while above 3,918.
🔹 H1:
• Market showing a confirmed CHoCH above 3,965 with bullish momentum candles.
• Currently retesting the descending trendline and 200 EMA (4,000–4,013) zone.
• RSI near 58, MACD histogram positive but slowing — possible short-term exhaustion.
⚠️ Bias: Bullish but watch for rejection at 4,000–4,013.
🔹 15M–5M:
• Clear bullish wave with strong EMA alignment (8 > 20 > 50).
• Structure forming higher highs and higher lows.
• Minor divergence appearing near 3,998, indicating potential retracement to 3,965–3,955.
🎯 View: Buy pullbacks into key retracement zones.
⸻
3. Fibonacci Analysis (Swing 3,918 → 3,998)
• 38.2% = 3,972.6
• 50.0% = 3,958.6
• 61.8% = 3,945.0
🟩 Fibonacci Golden Zone: 3,958 – 3,945
Confluence: prior H1 resistance turned support + trendline retest zone.
⸻
4. High-Probability Trade Scenarios
🟩 Bullish Scenario (Primary Bias)
• Buy Zone: 3,972 → 3,958 (Golden Zone)
• Confirmation: Bullish engulfing or CHoCH on 5M
• Targets: 3,991 → 4,004 → 4,013 → 4,030
• Stop Loss: Below 3,945
• Notes: Structure remains bullish as long as 3,945 holds.
🟥 Bearish Rejection (Countertrend)
• Sell Zone: 4,004 – 4,013 (H1 Supply + EMA Confluence)
• Confirmation: Rejection candle / Bearish divergence
• Targets: 3,974 → 3,959 → 3,945
• Stop Loss: Above 4,020
⚡ Breakout Setup
• Buy Breakout: Above 4,013 (retest holds) → Target 4,030 → 4,070
• Sell Breakout: Below 3,945 → Target 3,918 → 3,904
⸻
5. Fundamental Watch
• No major UK data early; focus remains on USD Index (DXY 106.2).
• US 10-year yields stabilizing; if yields drop, gold could push above 4,000.
• Market sentiment cautiously bullish ahead of mid-week U.S. news.
⸻
6. Key Technical Levels
Type Levels (USD)
Resistance 3,998 / 4,004 / 4,013 / 4,030 / 4,074
Support 3,972 / 3,958 / 3,945 / 3,918
Golden Zone 3,958 – 3,945
Break Buy Trigger > 4,013
Break Sell Trigger < 3,945
⸻
7. Analyst Summary
Gold shows strong intraday bullish momentum but faces resistance at 4,000–4,013.
If London retraces to 3,972–3,958, this area becomes the Golden Opportunity Zone for continuation buys.
A breakout above 4,013 confirms trend reversal to 4,030–4,074.
Failure to hold 3,945 will re-expose 3,918 lows.
⸻
8. Final Bias Summary
Main Bias: Bullish
Secondary Bias: Short-term sell at 4,013 only if strong rejection
Golden Zone (Buy): 3,958 – 3,945
Breaking Price: Above 4,013 for buys / Below 3,945 for sells
London Outlook: Expect minor dip, then bullish continuation if support holds.

XAUUSD/GOLD 1H BUY PROJECTION 29.10.25It looks like you’ve uploaded a trading chart with marked levels and annotations. Here’s a quick breakdown of what’s visible:
Structure: The price had been in a downtrend, then broke the descending trendline, indicating a potential change of character.
Monthly Low Retested: The blue box labeled “MONTHLY LOW RETESTED” shows the area where price retested a previous low and found support.
Bullish Engulf Confirmed: Suggests a bullish reversal candlestick pattern forming near support.
Parallel Uptrend Channel: The two upward-sloping blue lines outline a new ascending channel, implying a short-term bullish bias.
Trade Setup:
Entry Zone: Around 3,950–3,960
Stop Loss: Below ~3,935
Take Profit / Resistance R1: Around 4,000–4,020
Bias: The chart suggests a long (buy) setup, expecting a move upward toward resistance within the parallel channel.
Would you like me to help you analyze the risk/reward ratio or validate the technical setup (e.g., confluence with higher timeframe structure or indicators)?

The Ultimate GOLD & SILVER Outlook || 5 Trade Setups + FOMC UpdaWelcome to Trade with Decrypters!
📊 DETAILED & COMPLETE ANALYSIS (5 TRADE SETUPS) — Gold & Silver Outlook
1️⃣ Central Bank Buying
* Q1–Q2 2025 net: 410t (+15% YoY)
* August: +19t
* BRICS hold 6,000t (21% of global reserves)
* Top buyers: 🇵🇱 Poland +90t | 🇨🇳 China +35t
* Motive: USD hedge + BRICS 2026 currency prep
📈 Outlook: Sustained demand supports 10–15% long-term gold upside
2️⃣ ETF Inflows & Sentiment
* Q3 inflows: $26B | AUM $445B (+25% YoY)
* Holdings: 3,200t
* Asia: +37t | US: Neutral
* Gold RSI: 68 (Support: $3,800 | Resistance: $4,000)
* Silver RSI: 72 (Support: $32)
🎯 Projection: Gold → $4,000/oz (Q4, +1%) | Silver → $35/oz (+9%)
3️⃣ Macro & Geopolitical Events
* Fed cuts: 75bps → 3.75%
* USD: -8% | CPI: +3.2%
* Tariffs add +0.5% global inflation (→ 4.2%)
* BRICS trade pacts counterbalance USD weakness
* Gold already +57% YTD on 20% risk premium
📊 Outlook: Trade wars + Fed easing = 5–7% metals gain H1 2026
4️⃣ Silver Deficit
* 2025 deficit: 118M oz
* Supply: 1.02 Boz | Demand: 1.20 Boz
* Industrial share: 59% (EVs China +25%, Solar +30%)
* Recycling: 20%
📈 Projection: 150M oz deficit (2026) → Silver +15%
5️⃣ Futures & Options Flow
* CME Gold OI: 550k (+10% MoM)
* Silver OI: 180k (+8%)
* GVZ: 18%
* Call/Put ratio: 2:1 | Net long: 65k gold calls
📊 Outlook: OI rise + call bias = 20–25% vol breakout Q1 2026
🔮 Fundamentals & Forecast
* Gold: 450t CB buying + de-dollarization →
🎯 $4,200/oz (end-2025, +12%) | 🎯 $5,000 (2026)
* Silver: 118M oz deficit + 59% industrial →
🎯 $38/oz (end-2025, +18%) | 🎯 $60 (2026)
⚡ Drivers: Fed easing, 4.2% inflation, US deficit, BRICS shift → strategic metals outperformance
🏦 FOMC Update (Oct 29, 2025)
* Decision: 2:00 PM ET
* 98%+ chance of 25bps cut → 3.75–4.00%
* Powell press conference: 2:30 PM ET
* Dot plot & QT update expected
* Markets volatile → cut likely supportive for Gold, Silver, Stocks & Crypto
Disclaimer: This analysis is for educational purposes only. Not financial advice.

Gold Price Outlook – Trade Setup (XAU/USD)📊 Technical Structure
Gold price (XAU/USD) is trading near $3,965, with the upside capped at the $3,981–$3,990 resistance zone. The chart shows a recent rejection at resistance and sellers stepping in. Unless bulls break above $3,990, the bias remains bearish with a retest of $3,923–$3,915 support zone likely.
🎯 Trade Setup
Entry: $3,81–$3,989 (near resistance)
Stop Loss: $3,993
Take Profit: $3,930 / $3,915
Risk-Reward Ratio: ≈ 1 : 4.53
🌐 Macro Background
Gold is under renewed pressure as US–China trade optimism undermines safe-haven demand. U.S. President Trump said a trade deal with China could be finalized this week, which boosted market sentiment. As Kitco’s senior analyst Jim Wyckoff noted: “The U.S.-China trade tensions have really diminished, with a possible trade deal later this week after a summit meeting between Presidents Xi and Trump. That’s bearish for safe-haven metals.” 【FXStreet】
On the monetary policy side, the Federal Reserve is expected to cut interest rates by 25 bps, lowering the Fed Funds Rate to 3.75%–4.00%. CME’s FedWatch tool shows markets have priced in nearly a 100% probability of this move, with further easing expected in December. While this provides some support to gold, trade optimism currently outweighs Fed dovishness.
🔑 Key Technical Levels
Resistance: $3,981 – $3,990
Support: $3,923 – $3,915
Psychological Level: $4,000
📌 Trade Summary
Gold remains capped below $3,990 and is at risk of further declines toward $3,930–$3,915. Short positions near resistance are favoured, unless Fed surprises with a deeper cut or US–China trade talks collapse, which could flip sentiment.
⚠️ Disclaimer
This analysis is for reference only and does not constitute trading advice. Trading involves significant risk, and proper risk management is essential.

ElDoradoFx PREMIUM – GOLD ANALYSIS (29/10/2025, ASIA SESSION)Gold (XAUUSD) closed the US session near 3,950 after rejecting from the descending trendline and the intraday 200EMA cap around 3,960–3,970.
The current structure shows a corrective rebound inside a broader bearish leg, with D1 still pointing down but short-term exhaustion visible around 3,885–3,900.
Asia opens with minor consolidation below resistance, setting the stage for either a continuation breakdown or a temporary pullback to 3,970–3,990 before sellers re-enter.
⸻
2. Technical Breakdown
Daily (D1)
• Still in a clear corrective phase after failing to hold 4,100–4,140 resistance.
• Price now hovering above the 100-day EMA at 3,842, which acts as medium-term support.
• RSI at 47 – neutral but with downside pressure.
Bias: Bearish while below 3,996; looking for retracement sell setups.
⸻
1H Chart (H1)
• Price rejected from descending trendline near 3,970–3,980.
• Currently consolidating near 3,950, with structure forming a wedge under the 50EMA and 200EMA.
• MACD histogram turning flat, RSI recovering from 27 → 45 range.
Bias: Neutral-to-bearish; a rebound toward 3,970 may offer short opportunities.
⸻
15M Chart (M15)
• Micro bullish correction from 3,886 → 3,960, now forming lower highs.
• Momentum fading near 200EMA (3,955–3,960).
• RSI oscillating around 50; MACD decreasing – indicating loss of short-term momentum.
View: Expect a liquidity sweep into 3,970–3,985, then potential sell reaction.
⸻
5M Chart (M5)
• Tight consolidation between 3,948–3,960; lower timeframe CHoCH visible.
• EMA stack is compressing, hinting at volatility buildup.
• A clean break below 3,945 could trigger a new push to 3,920/3,900.
Short-Term View: Scalpers may watch for fake-out above 3,960 or breakout below 3,945.
⸻
3. Fibonacci Analysis (Last Swing: 4,019 → 3,886)
• 38.2% = 3,936
• 50% = 3,952
• 61.8% = 3,967
✅ Golden Zone = 3,952 – 3,967 → current price zone (high confluence).
⸻
4. High-Probability Trade Scenarios
🟥 Bearish Continuation (Primary Bias)
• Sell Zone: 3,952 – 3,970 (Fibonacci + 15M EMA confluence)
• Trigger: Bearish engulfing or 5M structure break below 3,945
• 🎯 Targets: 3,925 → 3,905 → 3,886 → 3,860
• 🛑 SL: Above 3,975–3,980
⸻
🟩 Bullish Reversal (Countertrend)
• Buy Zone: 3,910 – 3,920 (intraday demand)
• Trigger: Clear 5M CHoCH + bullish engulfing
• 🎯 Targets: 3,940 → 3,955 → 3,970
• 🛑 SL: Below 3,900
⸻
5. Fundamental Watch
• Asia session quiet — focus remains on USD and US yields after yesterday’s strong data.
• DXY remains elevated near 106.20 → limits upside on gold.
• Traders should anticipate low volatility early, followed by possible retracement during London buildup.
⸻
6. Key Technical Levels
Type Levels (USD)
Resistance 3,952 / 3,970 / 3,985 / 3,996
Support 3,930 / 3,910 / 3,886 / 3,860
Golden Zone 3,952 – 3,967
Break Sell Trigger <3,945
Reversal Trigger >3,970
⸻
7. Analyst Summary
Gold remains trapped below major EMA resistance and inside a corrective wedge.
The Golden Zone (3,952–3,967) aligns perfectly for fresh sell entries if momentum confirms.
Unless bulls reclaim 3,980+, the probability favors continuation toward 3,910 → 3,886.
Preferred Strategy:
Sell retracement from 3,952–3,970 (with confirmation).
If price breaks 3,945 → sell continuation.
Avoid buys unless 3,970 breaks and holds.
⸻
8. Final Bias Summary
Primary Bias: Bearish
Secondary Bias: Countertrend buy only from 3,910 support
High-Probability Zone: 3,952 – 3,967
Breakout Confirmation: Sell below 3,945
Invalidation: Above 3,980
⸻
🥇 ElDoradoFx PREMIUM 3.0 – PERFORMANCE 28/10/2025 💸
📊 Precision entries. Consistent gains.
━━━━━━━━━━━━━━━
🟢 BUY LIMIT +45 PIPS
🟢 BUY +80 PIPS
🟢 BUY +30 PIPS
🟢 BUY +90 PIPS
🟢 BUY +110 PIPS
🔻 SELL +60 PIPS
🟢 BUY +110 PIPS
📱 BTC BUY +600 PIPS
━━━━━━━━━━━━━━━
🏆 GOLD TOTAL: +525 PIPS
🪙 BTCUSD BONUS: +600 PIPS
💰 TOTAL DAILY PROFIT: +1,125 PIPS
📊 8 Signals → 8 Wins | 0 SL
🎯 Accuracy: 100% ✅
━━━━━━━━━━━━━━━
🔥 Flawless day! Every setup hit target with precision — GOLD and BTC both in perfect sync.
👏 Congratulations if you profited! ✅✅✅🚀🚀🚀

#XAUUSD: Massive Drop Is In Making! Bears In ControlDear all,
We are seeing significantly increased bearish volume since yesterday now we think price is likely to remain bearish for couple of days or week so price could make major correction. Please wait for price to settle down.
Good Luck
Team Setupsfx_

#XAUUSD: +6000 Pips Swing Move In Making, Patience Pays!
Gold prices have fallen sharply as the DXY has regained strength. Following the recent significant sell-off, we can anticipate the potential direction of the price. Three key targets can be considered if the price moves in our favour. The first is a nearby target at $4000 which would represent a gain of 1100 pips. Subsequent targets should be determined according to your trading plan.
There are two potential entry points; if the first is invalidated the second should be considered.
We wish you the best of luck and trade safely.
Team Setupsfx 🚀❤️

ElDoradoFx PREMIUM – GOLD ANALYSIS (28/10/2025, LONDON SESSIONGold extended its bearish continuation during Asia, breaking below 3,940, confirming dominance of sellers. London opens with price sitting near 3,935–3,940, still within the bearish structure that began at 4,106.
Momentum is strongly negative, with EMAs (50/100/200) aligned downward and RSI below 40 across all intraday frames. The market remains inside a descending channel — each recovery is being sold aggressively.
⸻
2️⃣ Technical Breakdown
🔹 Daily (D1)
• Fourth consecutive bearish candle confirms strong downside momentum.
• RSI (46) still neutral but leaning bearish; MACD histogram fully red.
• Price approaching potential higher-timeframe support near 3,900–3,880.
Bias: Bearish correction still in play until 3,880 or D1 reversal candle appears.
🔸 H1
• Structure: clean lower highs (4,106 → 4,048 → 3,997) and lower lows (3,971 → 3,935).
• RSI (27) deeply oversold, signaling possible micro bounce but no reversal yet.
• 100/200 EMA above at 3,990–4,040 acting as strong resistance.
Bias: Bearish below 4,000, corrective pullback likely capped at 3,995–4,010.
🔹 M15
• Extended downtrend channel remains active.
• Every minor pullback rejected under 3,950–3,960.
• MACD shows no bullish divergence yet; sellers still in control.
Bias: Sell pullbacks near resistance levels.
🔹 M5
• Micro CHoCH confirmed lower highs.
• RSI near 30 with weak attempt to rebound.
• Short-term liquidity zone forming 3,930–3,940, potential area for retest before continuation.
Bias: Bearish to neutral; short rallies only if confirmed rejection on M5–M15.
⸻
3️⃣ Fibonacci Analysis (Golden Zone)
Last H1 swing: High 4,106 → Low 3,935
• 🔸 38.2% → 3,990
• 🔸 50% → 4,009
• 🔸 61.8% → 4,028
✅ Golden Zone = 3,990 – 4,028
This zone aligns with the H1 supply area and EMA confluence, making it the optimal retracement level to rejoin the bearish trend.
⸻
4️⃣ High-Probability Trade Scenarios
📉 SELL SCENARIO (High Probability)
• Entry: 3,990 – 4,028 (Golden Zone)
• Stop-Loss: 4,035 – 4,045
• Targets: 3,955 → 3,935 → 3,910 → 3,885
• Confluence: EMA cluster, Fib 61.8%, trendline resistance
• Bias: Strong short continuation if rejection occurs inside Golden Zone
⸻
⚡ BREAKDOWN SELL
• Trigger: Clean H1 candle close below 3,930
• Entry: 3,928 – 3,935 on retest
• Stop-Loss: Above 3,945
• Targets: 3,912 → 3,900 → 3,885
• Bias: Follows continuation of bearish momentum below weak low.
⸻
🟢 COUNTERTREND BUY (Low Probability)
• Trigger: Bullish BOS + strong engulfing candle above 3,960
• Entry: 3,960 – 3,965
• Stop-Loss: 3,940
• Targets: 3,985 → 3,995 → 4,009
• Bias: Only if London forms a liquidity sweep under 3,930 with strong reclaim.
⸻
5️⃣ Fundamental Watch
• No major Asia data; London expected to move with USD Index (DXY) flows.
• DXY above 106 favors continued gold weakness.
• Traders monitoring US GDP & PCE later this week, meaning liquidity could tighten today.
• Expect volatility spikes near London–NY overlap as large players position early.
⸻
6️⃣ Key Technical Levels
Type Price Levels
Resistance 3,960 / 3,975 / 3,990 / 4,009 / 4,028
Support 3,935 / 3,924 / 3,910 / 3,885 / 3,872
Golden Zone 3,990 – 4,028
Breakdown Trigger < 3,930
Bullish Reclaim Trigger > 3,965
⸻
7️⃣ Analyst Summary
The bearish structure remains dominant across all timeframes. Momentum favors continuation toward 3,910–3,885, with the best entry region at 3,990–4,028 Golden Zone.
If London opens with liquidity sweeps below 3,930, wait for a quick retracement to sell at premium pricing.
Only strong reclaim above 3,965 could trigger a short-term intraday recovery to 3,990–4,009 before sellers step in again.
⸻
8️⃣ Final Bias Summary
📉 Primary Bias: Bearish – Sell rallies into 3,990–4,028
📈 Secondary Bias: Bullish only above 3,965 (confirmed reclaim)
🎯 Targets: 3,955 → 3,935 → 3,910 → 3,885
✨ Golden Zone: 3,990 – 4,028
🛑 Invalidation: H1 close above 4,045
⸻
— ElDoradoFx PREMIUM 2.0 Team 🚀
⸻

Gold Price Outlook – Trade Setup (XAU/USD)📊 Technical Structure
OANDA:XAUUSD Gold (XAU/USD) continues to trade under bearish pressure, dropping to the $3,980–3,940 range, marking its lowest in three weeks. The chart highlights:
Resistance Zone: $3,975 – $3,981 (aligns with a descending trendline).
Support Zone: $3,936 – $3,943, with $3,930 as key downside level.
Price action shows lower highs, suggesting sustained bearish momentum. A corrective bounce into the resistance zone could be met with fresh selling interest.
📌 Trade Setup
Entry: $3,975 – $3,981 (near resistance & trendline)
Stop Loss: $3,986
Take Profit 1: $3,945
Take Profit 2: $3,936
Risk/Reward: ≈ 1 : 3.72
🌍 Macro Background
Gold’s decline is largely driven by renewed US–China trade optimism, which has reduced safe-haven demand. As reported, officials from both sides agreed on a trade deal framework ahead of Trump–Xi talks this week, pressuring gold prices despite weaker USD and dovish Fed expectations. Meanwhile, traders remain cautious ahead of the FOMC meeting (Oct 28–29), where markets have priced in a 96% chance of a 25 bps Fed rate cut.
Adding to the downside pressure, the People’s Bank of China (PBoC) paused gold purchases, while China’s imports fell 17.6% in September, further reducing demand support. However, US Treasury yields remain soft, and JPMorgan projects long-term bullish momentum for gold, forecasting an average $5,055/oz in Q4 2026.
🔑 Key Technical Levels
Resistance: $3,975 / $3,981
Support: $3,943 / $3,936
Breakdown Target: $3,900
📋 Trade Summary
Gold remains under pressure, trading below $4,000 with bearish momentum intact. Short-term rallies toward resistance offer opportunities to sell, targeting the $3,930–3,940 support zone. Market focus shifts to the FOMC decision and US–China talks, which could define gold’s next breakout direction.
⚠️ Disclaimer
This analysis is for reference only and does not constitute trading advice. Trading involves significant risk, and proper risk management is essential.

ElDoradoFx PREMIUM – GOLD ANALYSIS (28/10/2025, ASIA SESSION)Gold closed the US session around 3,982 after extending its sell-off from 4,048, confirming strong bearish continuation from the 4,38x top. The current structure remains heavy, with the H1 100/200 EMA acting as dynamic resistance and repeated rejections near 3,997–4,002.
Momentum indicators across intraday timeframes still favor sellers, but Asia may open with a brief corrective retracement before the next bearish leg toward 3,958–3,945 liquidity zones.
⸻
2️⃣ Technical Breakdown
🔹 Daily (D1)
• Third consecutive bearish daily candle confirming continuation of the mid-term correction.
• Price now trades around 3,982, testing the mid-range zone between 3,880–4,020.
• RSI slipping near 50, signaling room for more downside before oversold conditions.
• MACD histogram remains negative but moderating — corrective phase within broader uptrend.
🧭 Bias: Bearish continuation inside medium-term correction; key support 3,880.
⸻
🔸 1H Chart (H1)
• Structure: Clear lower highs from 4,12x → 4,072 → 4,048 → 3,997.
• Strong break of structure below 3,985 → 3,971 confirms downtrend intact.
• Price remains below all EMAs and the descending trendline.
• RSI ~37 (slightly oversold); MACD momentum still negative.
📉 Intraday Bias: Bearish below 4,021; corrective only if price reclaims that level.
⸻
🔹 15M Chart (M15)
• Descending channel clearly defined; price rejected twice near 3,997–4,002.
• Pullbacks shallow, suggesting weak buyer interest.
• MACD histogram fading after short correction — selling pressure resuming.
⚠️ Short-term Bias: Sell rallies until clean BOS above 4,021.
⸻
🔹 5M Chart (M5)
• Micro downtrend confirmed with CHoCH back to the downside at 3,996.
• Price consolidating near 3,982, forming minor liquidity base pre-Asia open.
• RSI ~36; momentum weak but potential short-term rebound toward 4,000 before next drop.
🔎 Micro Bias: Intraday pullback expected; structure favors new lower high formation near 4,009–4,021.
⸻
3️⃣ Fibonacci Analysis – Golden Zone
Last H1 swing: High 4,048 → Low 3,971
• 38.2% → 3,998
• 50% → 4,009
• 61.8% → 4,021 ✅
✨ Golden Zone = 4,009 – 4,021
This zone aligns with the descending trendline, the H1 EMA cluster, and prior supply rejection — making it the highest-probability short area for continuation.
⸻
4️⃣ High-Probability Trade Scenarios
🟢 Bearish Continuation Setup (Preferred Scenario)
✅ Sell Zone: 4,009 – 4,021 (Golden Zone)
🎯 Targets: 3,985 → 3,971 → 3,958 → 3,945
🛑 Stop-Loss: Above 4,028–4,032
📈 Reasoning: Structural alignment with EMAs, Fib confluence, and trendline resistance.
⸻
⚡ Momentum Breakdown Setup (Continuation Trade)
✅ Sell Trigger: Break & retest below 3,971
🎯 Targets: 3,958 → 3,945 → 3,930 → 3,920
🛑 Stop-Loss: Back above 3,985
📈 Reasoning: Structural breakdown confirmation and liquidity grab continuation.
⸻
⚪ Countertrend Buy Setup (Low Probability)
✅ Buy Trigger: Clean 15M BOS + retest above 4,021
🎯 Targets: 4,034 → 4,048 → 4,072
🛑 Stop-Loss: Below 4,009
📈 Reasoning: Short-term recovery if DXY weakens or liquidity imbalance above 4,02x forms.
⸻
5️⃣ Fundamental Watch
• Asia session quiet: no tier-1 data expected.
• Focus remains on USD index drift and post-US yield sentiment.
• If DXY holds firm above 106, gold downside pressure persists.
• Watch early Shanghai open flows — potential liquidity sweep near 3,971 before NY continuation.
⸻
6️⃣ Key Technical Levels
Type Levels
Resistance 3,997 / 4,009 / 4,021 / 4,034 / 4,048
Support 3,985 / 3,971 / 3,958 / 3,945 / 3,930
Golden Zone 4,009 – 4,021
Break Sell Trigger < 3,971
Break Buy Trigger > 4,021
⸻
7️⃣ Analyst Summary
The market remains structurally bearish across all intraday frames, with strong EMA alignment and trendline rejection confirming continuation bias. Asia session likely sees a corrective bounce into the 4,009–4,021 Golden Zone, where the best-quality short setups align.
Only if buyers reclaim and hold above 4,021 will momentum shift for a potential relief rally toward 4,048/4,072. Otherwise, expect renewed pressure targeting 3,971 → 3,958 → 3,945.
⸻
8️⃣ Final Bias Summary
📉 Primary Bias: Bearish → Sell rallies into 4,009–4,021
📈 Secondary Bias: Bullish only above 4,021 (retested hold)
🎯 Targets: 3,985 → 3,971 → 3,958
✨ Golden Zone: 4,009 – 4,021
🛑 Invalidation: H1 close above 4,032
⸻
🥇 ElDoradoFx PREMIUM 2.0 – PERFORMANCE 27/10/2025 🥇
📅 Smart setups. Steady profits.
━━━━━━━━━━━━━━━
🔻 SELL +220 PIPS
🟢 BUY +145 PIPS
❌ BUY -60 PIPS (SL)
🔻 SELL +210 PIPS
━━━━━━━━━━━━━━━
💰 GOLD TOTAL PIPS WON: +515 PIPS
📊 4 Trades → 3 Wins | 1 SL
🎯 Accuracy: 75%
━━━━━━━━━━━━━━━
🔥 Solid and precise session — trend moves respected technical zones perfectly.
👏 Congratulations if you profited! ✅✅✅🚀🚀🚀

XAUUSD Best level to sell is this.Gold (XAUUSD) has turned bearish, at least on the short-term, as it broke below its 4H MA50 (blue trend-line) for the first time in a month and is headed for its 4H MA200 (orange trend-line).
Having made a Double Top at the start of the downtrend, the pattern that seems to be emerging is a Channel Down, with the last such formation seen in April - May.
So far the 4H RSI sequences between the two patterns are identical, so we expect a rebound now, which can give us the most optimal level to short again near the top of the Channel Down.
A break above 0.786 invalidates this, but as long as it holds, our Target will be the -0.236 Fibonacci extension at 3920 just like on May 15, which also hit its 1D MA50 (red trend-line).
-------------------------------------------------------------------------------
** Please LIKE 👍, FOLLOW ✅, SHARE 🙌 and COMMENT ✍ if you enjoy this idea! Also share your ideas and charts in the comments section below! This is best way to keep it relevant, support us, keep the content here free and allow the idea to reach as many people as possible. **
-------------------------------------------------------------------------------
💸💸💸💸💸💸
👇 👇 👇 👇 👇 👇

XAUUSD/GOLD SELL LIMIT PROJECTION 27.10.25Pattern Context
There’s a descending triangle or M-pattern that has been broken to the downside.
Labels such as “BREAKED M PATTERN NECKLINE HERE” and “BREAKED TRIANGLE PATTERN” indicate bearish structure.
Trade Setup
The chart projects a sell limit order in the region around 4,062–4,083 (highlighted red zone).
Stop loss is above the recent high — around 4,083.185.
Entry appears to be at the retest zone near 4,062.189 (“BREAKER ZONE RETEST & SELL”).
The target (take-profit area) points toward temporary support at approximately 4,031.150, suggesting a bearish continuation.
Trend Lines
A broken uptrend line and triangle breakout support the short bias.
The blue uptrend line and black triangle structure confirm the confluence zone where the retest and rejection may occur.
Summary of Bias
Direction: Bearish (Sell setup).
Confirmation: Triangle & M-pattern breakdown, retest expected.
Risk Management: Stop above 4,083; target near 4,031 (risk-reward ratio ≈ 1:2 depending on entry).

Gold Price Outlook – Trade Setup (XAU/USD)📊 Technical Structure
OANDA:XAUUSD Gold (XAU/USD) is consolidating within a symmetrical triangle formation. The resistance zone lies between $4,104 – $4,113, while the support zone is marked at $4,050 – $4,055. The price has repeatedly tested both zones, suggesting market indecision. A breakout from this tightening structure could dictate the next directional move.
📌 Trade Setup
Entry: $4,061 (near trendline support)
Stop Loss: $4,050 (below support zone)
Take Profit: $4,113 (resistance)
Risk–Reward (R:R): ≈ 1 : 4.36
🌍 Macro Background
Renewed optimism surrounding US-China trade talks has reduced safe-haven demand, leading to gold’s decline near $4,065 earlier today. US Treasury Secretary Bessent confirmed that both sides reached a framework for discussion, with China expected to delay its rare earth policy by one year. At the same time, markets are nearly certain the Federal Reserve will deliver a 25 bps rate cut at the October FOMC meeting, with another cut possible in December. While trade optimism weighs on gold, rate-cut expectations continue to provide a safety net for the metal.
🔑 Key Technical Levels
Resistance: $4,104 / $4,113
Support: $4,055 / $4,061
Upside Target (if breakout): $4,130 – $4,150
📋 Trade Summary
Gold is trapped in a tightening triangle between $4,055 and $4,113. Traders may look for long entries on dips near $4,061 with targets at $4,113, aligning with Fed rate-cut expectations. However, renewed US-China optimism caps the upside. A decisive break below $4,050 would invalidate the bullish outlook and open the door toward $4,020.
⚠️ Disclaimer
This analysis is for reference only and does not constitute trading advice. Trading involves significant risk, and proper risk management is essential.

XAU/USD: Wave 5 is already starting or the bulls' last hope?XAU/USD: Wave 5 is already starting or the bulls' last hope?
📈 Weekly Scenarios
Bullish scenario: Price holds above ~$4,056-4,000, breaks through ~$4,267 → start of waves (5) up → target ~$4,380-4,455+.
Consolidation: Price moves between ~$4,000 and ~$4,267, forming a base before the next major move.
Bearish scenario: Break of support at ~$4,000 with volume confirmation → start of correction → target ~$3,820-3,943.
✅ Conclusion
On the weekly timeframe, gold is at a key milestone: either a strong profitable rally (wave 5) begins, or a correction reverses.
Main signals: holding above ~$4,000 and breaking through ~$4,267 is the way to the upside; a break below ~$4,000 is a signal for caution.

XAU/USD Metals Outlook: Bullish Path with Layered Buy Entry Plan🔥 XAU/USD: Thief’s Gold Heist Strategy Map (Swing/Day Trade) 💰
🎯 Asset: XAU/USD (Gold vs. U.S. Dollar) — The Shiny Metal’s Wealth Hunt!📈
Market: Metals Market
🏆 Strategy Vibe: Bullish Bandit Plan with a Thief-Style Layering Twist! 😎
🕵️♂️ The Thief’s Bullish Plan: Steal the Gold!
We’re diving into the XAU/USD market with a bullish swing/day trade setup using a slick Thief Layering Strategy. This involves stacking multiple buy limit orders to catch the price at key levels. No boring single entries here — we’re building a multi-layered trap to snag those pips! 🪤
📊 Key Setup Details
🎯 Entry Levels:
Deploy the Thief Layering Strategy with multiple buy limit orders at:
💰 3760
💰 3780
💰 3800
Pro Tip: Feel free to add more layers based on your risk appetite! Stack those limits like a master thief planning a heist. 😏
🛑 Stop Loss:
Thief’s SL set at 3720.
Note: Dear Ladies & Gentlemen (Thief OG’s), this SL is my take — you’re the boss of your trades! Set your stop loss based on your risk tolerance. Trade smart, steal smarter! 💡
🎉 Take Profit Target:
Aim for the Electric Shop High Voltage Trap at 3920. This zone screams strong resistance, overbought signals, and a potential trap for the unprepared. Escape with your profits before the market zaps you! ⚡️
Note: Thief OG’s, this TP is my suggestion. Grab your profits at your own pace and risk level — make it rain when you’re ready! 💸
🔗 Related Pairs to Watch (Dollar-Based Correlations)
Keep an eye on these USD-based pairs for market synergy and correlation:
FX:USDJPY : A stronger USD could pressure gold prices, so watch for inverse moves. If USD/JPY spikes, XAU/USD might dip. 📉
OANDA:USDCHF : Another safe-haven pair. If CHF strengthens, it could signal risk-off vibes impacting gold. 👀
TVC:DXY (U.S. Dollar Index): Gold often moves inversely to the dollar. A rising DXY could cap XAU/USD’s upside — stay sharp! 🧠
OANDA:XAGUSD (Silver): Gold’s shiny cousin often follows XAU/USD’s lead. Check for confirmation in silver’s price action. ✨
Why Watch These? Correlations help you spot market sentiment. If USD strengthens across pairs, gold’s bullish run might face resistance. Use these as your Thief’s Radar to time your entries! 🕵️♀️
🔑 Key Points of the Thief Strategy
Layering Entries: Multiple buy limits spread risk and increase chances of catching a favorable entry. Think of it as setting multiple traps for the price! 🪤
Risk Management: The suggested SL at 3720 keeps losses tight, but adjust based on your account size and risk tolerance.
Resistance Watch: The 3920 zone is a high-voltage trap with overbought signals. Secure profits early to avoid getting caught in a reversal. ⚡️
Market Context: Gold thrives in uncertainty, so keep an eye on global events, Fed news, or inflation data that could spark volatility. 📡
⚠️ Disclaimer
This is a Thief-Style Trading Strategy crafted for fun and educational purposes. Trading involves risks, and past performance doesn’t guarantee future results. Always conduct your own analysis and trade at your own risk. Stay sneaky, stay safe! 😎
✨ If you find value in my analysis, a 👍 and 🚀 boost is much appreciated — it helps me share more setups with the community!
#️⃣ #XAUUSD #GoldTrading #ThiefStrategy #SwingTrading #DayTrading #BullishSetup #ForexTrading #TradingView
Gold Trade Set Up Oct 24 2025Price has shifted to bearish structure in London session so for CPI i am expecting a run of SSL first to induce sellers, followed by internal 5m-15m bullish structure to then run up to sweep BSL and fill the daily FVG
