Start shorting gold in a swing trade, target: 3435-3415Gold has just broken through the 3500 level and continued to near 3509. Bullish momentum is strong. Currently, gold has significantly deviated from technical indicators and is driven entirely by market sentiment. However, from a trading perspective, it's difficult to easily find a suitable entry point to participate in a long gold trade.
However, since yesterday's 3480 level, I've been increasing my short positions in gold and planning swing trading. Although there has not been a decent pullback yet, there are still reasons to support my shorting of gold!
1. While prices above 3500 have broken through historical highs, this is still uncharted territory, and bulls may be more cautious and hesitant.
2. Market expectations for a rate cut are currently growing, but after the Fed implements the cut, gold could experience a significant pullback, creating a "buy the expectation, sell the reality" phenomenon.
3. Although sentiment is currently driving the market, and technical indicators are completely distorted, there's still room for a technical pullback once market sentiment returns to rationality.
4. Based on current signs, gold may be accelerating towards its peak.
These are the reasons why I'm continuing to increase my short positions in gold. As a swing trade, while the holding period may be extended, my target for the short position remains firmly in the 3435-3415 range. If gold breaks below this range, the trend could extend to 3400-3390.
Of course, during swing trades, the longer holding period doesn't prevent us from executing short-term, daytime long trades. For short-term, daytime long trades, the current support area worth watching is 3485-3475. We can wait for gold to retrace to this area and then participate in gold long trades.
Xauusdtradeidea

XAU/USD Bullish Setup – Buy from POI Zone Towards 3545 TargetXAU/USD (15M Chart) Analysis
Trend Analysis:
Price is in a clear uptrend, supported by higher highs and higher lows above the EMA 70 & EMA 200. Both EMAs are pointing upward, confirming bullish momentum.
POI & FVG Zone:
A POI/FVG buying zone (highlighted in pink) is marked between 3481 – 3491, acting as a strong demand area for re-entry if price retraces.
Chart Pattern:
Price has broken out of a rising wedge formation and is retesting the breakout zone, showing potential continuation to the upside.
Support & Resistance:
Support: 3481 – 3491 zone (FVG & EMA confluence).
Resistance/Target: 3545.608 (major target point).
Entry & Risk Management:
Entry: Buy near 3491 or 3481 (within POI/FVG zone).
Stop Loss: Below 3480 (to protect against false break).
Target: 3545 (approx. +55 points).
Strategy Confirmation:
Trend-following: Bullish continuation above EMAs.
FVG/POI: Perfect re-entry buying zone.
Breakout strategy: Price broke wedge → retest → continuation expected.
Risk-Reward Ratio: Around 1:4, favorable trade setup.
✅ Summary:
XAU/USD remains bullish above EMAs. Ideal trade is to buy the dip at 3481–3491 zone with a target at 3545 and stop loss below 3480. Multiple strategies align for upside continuation.

Gold near 3500, Who Wins—Bulls or Bears?Today, after gold touched around 3437 during the retracement, it was pushed up to around 3490 again by market sentiment. The bullish momentum was extremely strong and it is currently in a strong bullish trend. According to the current gold trend, there may be room for continuation above. However, in the transaction, I have made it clear that I will no longer aggressively chase the rise of gold!
First, gold has risen sharply under the influence of fundamentals, and it is difficult to follow up in time on the technical level, resulting in a technical pullback demand for gold; in addition, gold has shown obvious signs of acceleration during the rise, and the market often easily has turning points after acceleration, and although gold is in an obvious bullish trend, it is still under considerable pressure before breaking through the previous high of 3500. These are the reasons why I am unwilling to continue chasing the rise in gold. The most important point is that since the market expectations of interest rate cuts have increased, a large amount of buying has appeared to push up gold prices before the Federal Reserve announced the interest rate cut. It is very likely that the phenomenon of "buying expectations and selling facts" will occur.
Therefore, in the current transaction, I do not advocate continuing to chase gold at high levels. On the contrary, in the 3475-3495 area, I will consider creating as many short positions as possible as a swing trade, and be ready to welcome gold to retreat to the 3435-3415 area at any time.
Of course, because swing trading requires a certain period of time, we can still participate in intraday short-term trading during the execution of swing trading, follow the mainstream trend and try to go long on gold with the support area. The support area we must first pay attention to is in the 3460-3450 area. If gold first touches this area during the retracement process, we can consider going long on gold in intraday short-term trading.
CAPITALCOM:GOLD FX:XAUUSD TVC:GOLD FOREXCOM:XAUUSD OANDA:XAUUSD

GOLD M15 DIRECTION Hello Welcome Back 🙏
Gold Selling Area > 3485
Reason > Strong Resistance & CRH Strategy
Gold Buying Area > 3354, 3345
Reason > Bullish FVG , CISD Strategy
Hope You Got It , Dont Forget To Follow Us And Boost The Post

I might be the first to start shortingAgainst the backdrop of strengthened expectations of interest rate cuts and Trump's continued tough stance, gold rose above the 3400 mark and continued to above 3410. The upward momentum was relatively strong and market sentiment was optimistic. But the more this happens, the more dangerous it feels! In fact, from a short-term perspective, the foreseeable target area above is: 3415-3425 area, which has only 100-150pips of room for growth from the current gold price. So I think there is no need to continue chasing long gold for the time being.
From the current structure, although gold is in a fluctuating upward structure, the trading volume is gradually decreasing after gold broke through 3410, proving that as gold continues to rise, the market has gradually become more cautious. Judging from the candlestick pattern, the trend line constructed from the highs of 3500 and 3440 is currently facing resistance near 3415, while the resistance of the trend line constructed from 3452 and 3440 is currently near 3425. Therefore, the current more obvious resistance area is in the 3415-3425 area. In comparison, there is a larger retracement space below, firstly in the 3395-3385 area, and then in the 3375-3365 area.
Therefore, at this stage, I will no longer aggressively chase the rise of gold; instead, I will start shorting gold in batches above 3410, and then patiently wait for gold to retrace!

Gold Shows Potential Breakout at $3,390Gold (XAU/USD) has been exhibiting mixed price action over the past few weeks. On the 4-hour chart, we notice a critical resistance trendline forming a descending pattern that has contained price movement for some time. The current price stands at $3,390.26, indicating a potential breakout scenario.
Key Levels to Watch
Resistance: $3,400 – A level that has repeatedly capped upward movements.
Support: $3,325 – The lower boundary of recent price consolidation.
Immediate Buy Level: $3,390.54
Immediate Sell Level: $3,390.32
The price is currently testing the descending trendline, suggesting a possible upward momentum if bulls sustain above this level. Traders should be cautious of a false breakout, as consolidation is still evident around $3,375 – $3,400.
RSI Analysis
The Relative Strength Index (RSI) 14-period shows the momentum hovering near the 60-65 zone, indicating moderately strong buying pressure but not yet overbought. Previous RSI peaks near 70 triggered minor pullbacks, highlighting the importance of this indicator for spotting reversals.
ZigZag Indicator Insight
The ZigZag 5 10 indicator highlights the swing highs and lows, helping traders visualize the trend reversal points. The recent formation suggests a potential shift toward an upward trend if the current breakout holds above the resistance.
Trading Strategy
1. Bullish Scenario:
Entry above $3,400 with a target near $3,450.
Stop loss around $3,375 to manage risk.
2. Bearish Scenario:
If the breakout fails and price dips below $3,375, short positions could target $3,325.
Confirm with RSI moving below 50 for stronger conviction.
Conclusion
XAU/USD is showing signs of a potential bullish breakout after a prolonged period of consolidation. Traders should monitor the $3,400 resistance level closely and watch RSI behavior for momentum confirmation. With careful risk management, this could be a profitable swing trade opportunity.

Bears’ Last Chance Before the Golden Bull AwakensToday, gold has held 3373 many times during the retracement process, proving that the current market is still dominated by bulls. Currently, gold has touched above 3390 again, showing that buying power is still continuing. This is also the reason why we have been long on gold in the 3378-3374 area many times today, mainly based on the fact that gold is currently in an obvious bullish structure.
But we need to note that although gold continues to rise, it is not strong. Most of the time it still fluctuates at a high level. It may be that the market is not highly unanimous in its agreement on the continuation of the strong bull market stimulated by the news, so the short-term volatility of gold will be exacerbated while it is rising.
In addition, gold is becoming more cautious as it approaches 3400. In comparison, there is still a certain amount of suppression in the area around 3400, so we must take into account that gold may still retreat after being under pressure in the short term, so I think it is necessary for us to try to short gold again in the 3395-3405 area; once gold retreats as expected, the first test will be the short-term support in the 3385-3375 area. If the support in the 3385-3375 area is effective during the test, then gold may be able to break through the 3400 mark in one fell swoop, or even continue to the 3410-3420 area.
So, in short-term trading. At present, we can consider shorting gold appropriately in the 3395-3405 area. If gold retreats as expected, we will first observe the performance of gold in the 3385-3375 area. If it cannot effectively fall below this area, we can adjust the trading strategy and re-enter the long trade!

Final Bear Profit—Then Gold Turns BullishSupported by Trump's statement and geopolitical tensions, gold continued to rise to around 3394 and is currently fluctuating narrowly around 3390.
Although the upward momentum of gold seems strong, the bulls are not resolute during the rise. Instead, they will launch an attack again after repeatedly testing the support. It is expected that the market is not highly unanimous in its agreement on the continuation of the strong bull market stimulated by the news, so the short-term volatility of gold will be exacerbated during the rise.
As gold continues to rise, it is clearly under pressure in the 3400-3410 area in the short term. Moreover, the bullish sentiment of gold has obviously weakened before facing this area, so we must consider that gold may still retreat after being under pressure in the short term. Below, we should first note the short-term support area of 3385-3375. If gold fails to effectively break below this area during a pullback, it will likely retest 3400.
Therefore, in short-term trading. At present, we can consider shorting gold appropriately in the 3390-3400 area. If gold retreats as expected, we will first observe the performance of gold in the 3385-3375 area. If it cannot effectively fall below this area, we can adjust the trading strategy and re-enter the long trade!

Explosive Rally Ahead: Gold Eyes a 3400 BreakoutThere is no doubt that as long as gold is above 3350, the current gold market will maintain a strong bullish structure. After today's sideways trading, gold has clearly established a support platform in the 3370-3360 area. Although it has repeatedly fallen back under pressure in the 3380-3390 area, it has rarely fallen below the short-term support platform of 3370-3360. In addition, the candlestick charts have repeatedly shown long lower shadows, proving that the buying momentum is strong and the market bullish enthusiasm is high! Therefore, in short-term trading, we can try to go long on gold based on the 3370-3360 support level.
However, it's important to note that gold has repeatedly come under pressure at the 3380-3390 resistance level. If gold consistently fails to break through this resistance level during its upward trend, bullish sentiment could be affected. Therefore, gold may need to retest support before any further gains. If it falls below the 3370-3360 level during this retest, it could extend to the 3355-3350 level, which is strong support in the short term. Therefore, if gold falls below the 3370-3360 level, it could retest the 3355-3350 level, prompting bulls to launch a counterattack.
Therefore, in the short term, given that gold maintains a bullish structure, I would primarily consider going long on gold.
1. Consider initiating a long position in gold in the 3370-3360 area; first, see if gold can break through the 3380-3390 area as expected.
2. If gold retests the support area, consider resuming a long position in the 3355-3350 area.

Gold’s Next Move = Your Next ProfitOn Friday, gold prices soared due to Powell's dovish remarks, reaching a high of around 3379, and the candle chart showed signs of a V-shaped reversal. From a technical perspective, gold still has the potential to continue to rise, and as of now, gold has not effectively fallen below 3360. While effectively curbing the downward space, it also shows that a certain amount of buying momentum is still continuing.
However, gold has not yet effectively broken through the 3380-3390 area, and the upper space has not been completely opened. If gold cannot break through this area, the bullish momentum may gradually weaken in the short term. In order to accumulate enough momentum to break through this area, gold may usher in a pullback in the short term.
First, we should focus on the 3355-3345 area below. As long as gold remains above this area, the overall bullish pattern will remain. Therefore, this area is the entry area where we should try to go long on gold for the first time after gold pulls back.
Therefore, we currently have two trading options:
1. When gold first hits the 3380-3390 area, consider shorting gold.
2. When gold first hits the 3355-3345 area, consider longing gold.

XAUUSD TOP-DOWN ANALYSIS Let’s break this down top-down from the daily → 1H → 15M using my framework (market structure, inducement, POI).
---
1. Daily (D1)
Market Structure : The daily chart shows Gold in a range after a bullish rally earlier this year. Price has been consolidating between $3,300 – $3,400 with multiple liquidity sweeps inside this sideways structure. No clear strong trend recently, but bias leans bullish as price is holding above mid-range.
Inducement : Recent dips into the $3,300 zone (range low) induced liquidity by running sell-side stops, then price rejected sharply.
POI : A bullish daily demand/order block sits around $3,300 – $3,320 (the wick that swept liquidity and launched higher).
🔑 Daily Bias : Bullish within range, targeting upper range liquidity ($3,400+).
---
2. H1 (1H)
Market Structure : On H1, price was bearish until it swept $3,320 liquidity, then launched upward with a strong impulsive move (clear displacement). Market structure has now flipped bullish as a new HH (higher high) was printed around $3,372.
Inducement : The sweep below $3,320 grabbed liquidity from sellers and late shorts, fueling the impulsive bullish move.
POI : The bullish order block/FVG left behind from that displacement sits around $3,335 – $3,345.
🔑 H1 Bias : Bullish, retracement expected into OB/FVG before continuation.
---
3. M15 (15M)
Market Structure : On M15, price is consolidating after the large pump. Minor liquidity is sitting above $3,372 (recent high) and below $3,355–$3,345 (fresh OB zone).
Inducement : Price may pull back to induce liquidity from breakout buyers before tapping into the OB/FVG below.
POI : The cleanest intraday POI is the bullish FVG/OB at $3,345 – $3,355 zone.
---
🎯 Trade Setup
Type: Buy setup (continuation)
Entry: $3,350 (mitigation of M15/H1 OB + FVG)
SL: $3,335 (below OB and sweep low)
TP1: $3,380 (range high liquidity)
TP2: $3,400 (daily range high liquidity sweep)
➡️ RR ~ 1:3.5 (fits your 3RR rule).
---
✅ Summary :
Gold is bullish after a liquidity sweep on the daily & H1. Best play is to wait for a retracement into the $3,345 – $3,355 OB/FVG zone for longs targeting $3,380 – $3,400.

XAUUSD 15m – EW Short SetupHi fellow traders,
On the 15m XAUUSD chart, I am applying Elliott Wave principles to identify a short opportunity. The current structure suggests a continuation to the downside after the corrective move.
An additional confluence here is the red-shaded supply zone, which aligns with my projected entry area and strengthens the setup.
I am entering at 3347.26, with a Stop Loss at 3351.87 and a Take Profit at 3322.53, targeting the next support level.
Good luck and trade safe.

XAUUSD Setup: Key Levels to Watch Before the Next Big Swing1. Chart Type & Indicators
Instrument : XAUUSD (Gold vs USD)
Timeframe: Likely Daily or 4H (based on structure)
Indicators:
Zig Zag (5, 10) – Helps visualize swing highs/lows and trend reversals.
RSI (14) with signals marked (R for Reversal points).
Price: 3,338.34 USD (at the time of the snapshot).
2. Trend Structure (Price Action)
Previous High: Around 3,500.
Current Price: 3,338, which is down ~4.6% from the recent high.
Key Swings:
Uptrend from 3,167 → 3,499 (+10.5%).
Correction down to 3,120 (-10.8%).
Subsequent swings are smaller, showing reduced volatility.
Observation:
Price is consolidating in a range between 3,250 and 3,450 after a strong rally.
ZigZag indicates lower highs and lower lows recently, signaling a mild downtrend.
3. RSI Analysis
Current RSI: 45.18 (Neutral zone, slightly bearish bias).
Overbought zone (70+) was tested multiple times in the past but failed to hold, causing corrections.
Recent green dot (R) indicates possible oversold bounce near 30 RSI in early August.
Observation:
RSI is not yet bullish, suggesting the price could range or test support before trending up.
4. Key Levels
Resistance Zones:
3,450 – 3,500 (major resistance from previous highs).
Support Zones:
3,300 – 3,250 (strong demand zone).
Below that, 3,120 acts as major support.
5. Volume
Higher volumes were observed during the strong rally (March-April).
The recent volume is lower, indicating a weakening trend strength.
6. Possible Scenarios
Bullish Scenario:
If the price breaks above 3,450 with strong momentum, it can retest 3,500 and potentially move beyond.
Bearish Scenario:
If the price falls below 3,300, we could see 3,250 and 3,120 next.
7. Trading Plan
Long Position: Only on breakout above 3,450 with volume confirmation (target 3,500–3,600).
Short Position : If price closes below 3,300 (target 3,250–3,120).
Range Trading: Between 3,300–3,450 (buy dips near 3,300, sell near 3,450).
Summary: Market is in sideways consolidation after a strong uptrend. RSI suggests neutral to slightly bearish. Watch for a breakout above 3,450 or a breakdown below 3,300.

Gold on Fire: Bulls Eye an Unrelenting Surge to 3365–3375Although gold has been weak recently, we have still achieved impressive results in gold long trading because it touched 3375 and 3358 twice during the rebound process. We have made a total profit of more than 900 pips in the long trading, which can be said to be a very successful transaction in the short term.
At present, gold maintains an overall volatile market, but in the short term, gold has never effectively fallen below the 3330-3320 area. What is more obvious is that the dense trading area below is concentrated in the 3330-3310 area, so the buying support below is strong, which greatly limits the downward space of gold; in addition, gold touched around 3358 during today's rebound, and once broke through Friday's intraday high, which to a certain extent strengthened the market bullish sentiment. Therefore, when gold retreats again, there may be more buying funds willing to enter the market.
In terms of fundamentals, the ceasefire and peace between Russia and Ukraine have not yet been settled, and the geopolitical situation remains tense; and the market's expectations for the Federal Reserve to cut interest rates are gradually strengthening. Against this background, gold still has the possibility of rising again.
Therefore, in the short term, I still prefer to trade gold long. We can consider buying gold in the 3340-3330 area, first looking at the target 3365-3375 area, and even continuing the upward trend to around 3380.

technical analysis of the XAUUSDPrice: Around $3,345 currently.
Chart Indicators
Zig Zag (5, 10): Helps highlight major swing highs and lows.
RSI (Relative Strength Index): 14-period with levels at 70 (overbought) and 30 (oversold).
Recent Low: Around $3,247 (late July).
Lower highs and lower lows indicate short-term bearish trend.
Price broke below a minor swing support around $3,380 and is now testing $3,345.
Zig Zag Pattern: Suggests corrective moves but overall downward bias after recent top at 3,438.
RSI Analysis
Recently peaked near 70 (overbought zone) during mid-August high.
Currently near 50 (neutral), showing consolidation after a sell-off.
Signal: No clear divergence, but bearish momentum eased after recent drop.
Key Support & Resistance
Support Levels:
$3,320–3,330: Near-term support zone.
$3,247: Major previous swing low (strong support).
Resistance Levels:
$3,380–3,400: Immediate resistance (recent broken support).
$3,438: Last swing high (strong resistance).
Volume Analysis
Downward move from $3,438 to $3,345 happened with moderate volume, suggesting steady selling pressure but not a panic drop.
Possible Scenarios
Bullish Scenario (Reversal or Pullback)
Price needs to hold above $3,330 and break $3,380 to target $3,420–3,438.
RSI moving above 60 would strengthen bullish momentum.
Bearish Scenario (Continuation)
If price breaks below $3,330, next target is $3,300, then $3,247.
RSI dropping toward 30 would confirm strong bearish momentum.
Trade Idea (Not Financial Advice)
For Bulls: Wait for a break & close above $3,380 for a potential long entry.
For Bears: Watch for a break below $3,330 for a potential short toward $3,247.
Stop-loss: Use nearby swing highs/lows for risk management.
Overall Sentiment:
Currently neutral to slightly bearish, as price is below key resistance and forming lower highs.

Last chance to go long on goldAlthough the initial jobless claims and PPI data were bearish for gold, it still failed to break below 3340-3330 area. After touching 3340, it rebounded to around 3356, demonstrating that a significant amount of buying capital was still entering the gold market during the pullback, limiting the downside while also providing strong support.
Although gold has experienced several setbacks in its short-term upward trend, the bullish pattern has not completely failed. It remains within an ascending triangle structure in the short term. As long as this structure remains intact, gold could potentially rebound to the 3365-3375 area, or even to the 3380-3390 area, leveraging structural support.
Currently, there is a fierce game between bulls and bears in the short term for gold, which brings considerable difficulties to our short-term trading, but why do I keep insisting on going long on gold? What I want to say is that when you are uncertain in the short term, you can zoom in on the chart period and observe. In fact, the trend is clear at a glance, but there are some twists and turns in the short term!
Therefore, in the short term, I still advocate seeking to go long on gold with the 3345-3335 area as support, first looking at the target 3365-3375 area. If gold breaks through this area strongly during the rebound, the upward trend can continue to around 3380.

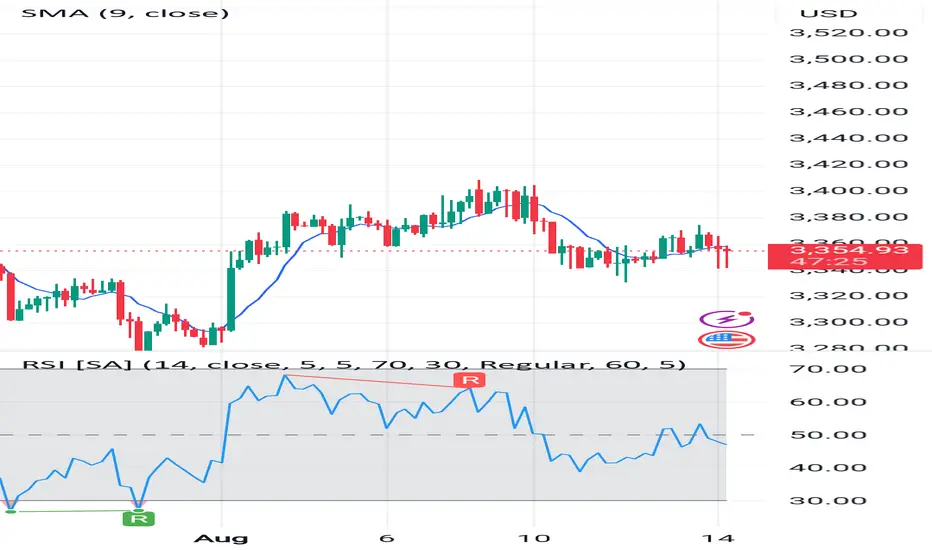
XAUUSD (4H timeframe) technical analysis based on your chartCurrent Market Price
Sell Price: 3,354.08
Buy Price: 3,354.29
Very tight spread, indicating high liquidity.
Indicators Used
SMA (9-period) – Price is currently below the SMA, suggesting short-term bearish momentum.
RSI (14) – Currently around ~50, indicating a neutral zone (neither overbought nor oversold).
Recent RSI Trend – It recently dropped from ~65 to ~45, showing weakening buying pressure.
Price Action
Recent price movement shows:
A sharp drop from ~3,400 to ~3,325.
A small recovery attempt, but failing to break above SMA 9, showing sellers are still in control.
Candlestick patterns show lower highs and lower lows, a classic bearish sign.
Support & Resistance Levels
Immediate Resistance: ~3,375 (SMA 9 area & recent rejection zone).
Immediate Support: ~3,325 (recent bounce area).
Major Resistance: ~3,400
Major Support: ~3,300
Signal
Trend Bias: Bearish in short term.
Momentum: Weak buying strength, sellers still dominant.
Recommendation: SELL
Entry: Around 3,354–3,360 (current price zone).
Stop Loss: Above 3,375 (above SMA & last swing high).
Take Profit 1: 3,325 (near-term support).
Take Profit 2: 3,300 (major support zone).
Risk Management
Risk–Reward ratio target: at least 1:2.
Avoid over-leverage; gold can move fast on news.
📌 Summary:
The market shows weakness after a failed recovery. Price staying below SMA 9 and RSI losing momentum indicates sellers are in control. Unless price breaks above 3,375 with strong volume, the bias remains short-term bearish.
3340–3330: Bulls’ Last StandI still hold a long position in gold. Although gold has not continued its rebound and is relatively weak, it has tested around 3340-3330 many times but has never fallen below it. As long as gold remains above 3340-3330, gold bulls may sound the clarion call for a counterattack at any time.
Gold has been falling frequently and seems to be shaky, but it has always held the area near 3340-3330. I think the frequent decline of gold is a false signal to trap the short sellers. Why do I think so?
1st, the area around 3340-3330 is the support level of the bullish structure and the last line of defense. It is unlikely that gold will effectively fall below this area in the short term.
2nd, this upward trend began around 3268 and reached a high around 3409.The area around 3340-3330 is exactly the 50% retracement area of this band, which has relatively strong support.
So from a technical perspective, I think gold is currently accumulating energy, exchanging time for space. Gold bulls may explode at any time, thereby triggering a gold rally!

Gold’s Drop: The Calm Before the SurgeThe bulls have been defeated all the way, and the current lowest has fallen to around 3350. However, after gold touched around 3350, the downward momentum has slowed down. I think it is not appropriate to be overly bearish on gold in the short term.
It can be clearly seen during the day that gold started to fall from around 3401, and the decline reached $51 around 3350. In the absence of any major negative news, I believe that the intraday retracement space has reached its upper limit, and the structural support line for gold bulls happens to be in the 3350-3340 area, so the room for gold to continue to retrace will not be too large.
Moreover, gold has recently fallen under pressure several times after standing above 3340, proving that the upper resistance still exists. In addition, there is a certain amount of selling, which has hindered the bullish momentum to a certain extent, resulting in the lack of momentum for gold bulls. After the current pullback and technical repair, due to the increase in gold liquidity and accumulation of strength, it may be more conducive for gold to hit 3400 again or even higher targets.
Therefore, in the short term, I think it is not advisable to chase gold too much; instead, we can accumulate enough cheap chips during the gold pullback, and then wait patiently for gold to rebound and hit 3380-3390 again.

Gold’s Pullback: Fueling the Next Surge Toward 3390-3400Today is the first trading day of this week. Gold has continued to fall since the opening, and has reached a low of around 3364 so far. Through the short-term trend, we can see that gold has insufficient willingness to continue to rise above 3400 and still faces considerable resistance. It needs more support and momentum to drive it forward before it can continue to rise. Currently, gold continues to retreat to around 3364. Has the trend of gold turned into a bearish trend? I think it's too early to draw such a conclusion!
Although gold has fallen significantly, there is still strong buying support below. The 3360-3350 area has become a key support level. As long as gold does not fall below this area, the bullish structure has not been completely broken. Therefore, there is still sufficient energy for gold to continue its rebound. This decline in gold is intended to increase liquidity and accumulate more upward momentum, which will help gold stabilize at 3400 and move towards higher targets!
Therefore, for short-term trading, I think we can still continue to try to go long on gold, but after all, the decline in gold has been so large. For short-term trading, we can appropriately lower the rebound expectations to the 3380-3390 area.

Next Stop 3420? Gold Bulls Push the Limit!Gold has shown a step-by-step rise in the short term, and has stood above 3,400 many times, and the bullish force is relatively strong. However, correspondingly, after gold stood above 3400, it fell under pressure several times, so the shape was not particularly good, which increased the risk of pullback in the short term.
However, we do not need to worry. Gold is still running in an ascending wedge structure. Although it has been under pressure and fallen back several times during the attack on 3400, the bullish structure has not been effectively destroyed so far. Moreover, with the sharp increase in gold buying, the 3380-3370 area below has become an obvious intensive trading area, which has greatly limited the gold retracement space.
In addition, after gold broke through 3340, market sentiment tended to be optimistic. If gold experiences a short-term pullback, more funds will flow into the gold market, especially for those who have missed out on long trades before, who will rush into the gold market even more frantically. Under the resonance of the current technical structure and market optimism, gold still has the potential to hit 3400, and bulls are even expected to stand firm at 3400 and make further efforts.
So in terms of short-term trading, I still advocate that gold pullbacks are buying opportunities. And I cherish the opportunity to enter the market and go long in the 3385-3375 area, and am optimistic that gold will hit 3400 again, and may even continue the bull trend to the 3420-3430 area.
OANDA:XAUUSD FOREXCOM:XAUUSD TVC:GOLD FX:XAUUSD CAPITALCOM:GOLD

Gold Poised for a Surge: 3400 in Sight, 3430 Within ReachToday, gold retreated to a low of around 3350 before rebounding again, reaching a high of around 3390. During this process, we seized the opportunity to go long on gold near 3356 and closed the trade by successfully hitting TP: 3380, making a profit of 240 pips!
Although gold retreated after reaching 3390, I had originally planned to short gold near 3395, but gold didn't reach that level during the rally, so our shorting plan had to be shelved. Currently, it's trading in a narrow range around 3380. Clearly, I'm not considering shorting gold after a pullback.
Although gold retreated to around 3350 during the day, it did not destroy the current bullish structure of gold. In addition, gold regained the 3370-3375 area again during the rebound, and the gold bulls became even stronger. Therefore, I have now lost the desire and interest to short gold. Gold has currently reached a high near 3390. Given its current structure and strength, I don't believe 3390 is the current high. Gold is likely to attempt to break through 3400, and even has the potential to continue its rise to the 3420-3430 range. As the center of gravity of gold shifts upward, the current short-term support has moved up to the 3375-3365 area; and the relatively strong support is located in the 3360-3350 area.
Therefore, for short-term trading, I prefer to start trying to go long on gold after it retreats to the 3375-3365 area, and expect gold to hit 3400 as expected, or even continue to the 3420-3430 area.

Bullish Outlook Intact: Gold Targeting 3400-3410Gold encountered resistance and retreated several times on its way to 3400, but it remained above 3370 during the pullback, perfectly maintaining the integrity of its volatile upward trend. Therefore, even though gold's upward momentum has weakened, I still believe that due to structural support, gold still has the potential to reach the 3400-3410 area, and may even continue its bullish trend to the 3420-3430 area.
As gold prices rise, market sentiment tends to be more optimistic, and the price behavior reflected by the candlestick chart becomes clearer. The lows of gold continue to rise, and the highs always insist on setting new highs in the process of rising. The oscillating upward structure is particularly obvious. While greatly limiting the retracement space, it also greatly consolidates the support structure below and is conducive to further rises in gold. At present, gold has been confirmed to have stabilized above 3370, so gold may not give another chance to fall back to the 3360-3350 area.
Then in the next short-term trading, the gold pullback is a buying opportunity. We focus on the opportunity to participate in long gold after gold retreats to 3380-3370. The target will first look at the 3400-3410 area, and the higher target area is in the 3420-3430 area.
