Slight fluctuations. Is a new trend brewing?Gold opened higher in Asian trading on Monday, with a moderate performance in European trading, fluctuating between $5080 and $4980. The US session also lacked a clear trend, with the $5100 level continuing to act as upward pressure.
From a structural perspective, the market is still in a bull market, as evidenced by the fact that gold has held above $4,400.
Based on the current trend, a break above $5100 would likely lead to further upward movement, while strong support lies at $4960-70. A breach of this level would necessitate a timely adjustment of strategies; always have a backup plan when trading.
Short-term trading strategy should focus on buying low and selling high, capitalizing on the time rhythm within the consolidation. Use the $4960-$70 area as strong support, buying on dips. Monitor the $5100 level closely; an upward breakout followed by a pullback could still present buying opportunities, while a downward break below $4960-$70 would require a shift to short positions.I will post more strategies in the channel.
Xauusdtrend

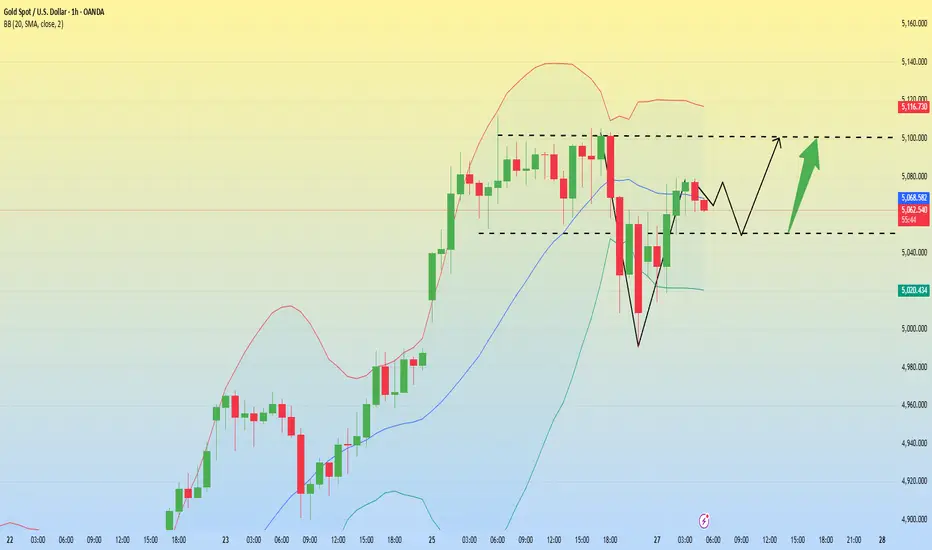
The bulls are in control. Buy after a pullback.On Monday, the gold market continued its upward trend, with prices rising sharply and reaching a high of $5,087.4 per ounce before consolidating.
Gold is currently maintaining a range-bound consolidation on the daily chart, with prices facing resistance around 5100. However, the pullback after touching the previous resistance level has been relatively weak and short-lived. The overall bullish trend on larger timeframes remains unchanged. Attention should be paid to the possibility of a second upward move after this consolidation on the daily chart.
On the 1-hour chart, after a period of narrow-range consolidation, the technical pattern is gradually completing its adjustment. Short-term moving averages are starting to turn upwards, and prices are slowly breaking out of the short-term consolidation range, suggesting potential for further upward movement during the US session.
Gold is stabilizing and consolidating, in a bottoming-out rebound pattern. If a breakout fails to materialize, further consolidation is likely.
Buy at 4980, stop loss at 4950, profit range 5020-5050-5100. Aggressive traders can buy at 5000 and add to their position at 4980. I will post more strategies in the channel.

Buy on dips before the non-farm payroll data release.Looking back at yesterday's price action, gold reached a high of $5080 and a low of $4987, ultimately closing near $5025, perfectly aligning with the core assessment of "range-bound trading." Investors who followed the strategy were able to reap steady profits amidst the volatility. This is not accidental, but rather the result of in-depth analysis of market structure, moving average systems, and market sentiment.
In early Asian trading on Wednesday, gold prices remained range-bound around $5030, technically exhibiting a "biased bullish, awaiting breakout" pattern. Looking at the 1-hour chart, the indicators are still in a bullish alignment, and the bulls and bears are still battling it out at a key level.
Given the current market environment, gold prices are likely to continue fluctuating within the $5000-$5080 range. Key levels to watch are the $5050-$5060 resistance level and the effectiveness of the $5000 psychological support level. If the price stabilizes above 5060 with increased trading volume, it may challenge the 5100 level, further opening up upward potential with a target of 5150-5300.
Strategy Recommendation:
If the price stabilizes in the 5010-5000 range, consider a small long position with a target of 5050-5080. If it rebounds to 5060-5080 and encounters upward resistance, consider shorting. The strategy remains unchanged until the release of the US non-farm payroll data; please pay attention to the trading hours.I will post more strategies in the channel.

Breaking through 5000. Will it reach 5100?After a fierce battle between bulls and bears, gold has rebounded above $5000, with bullish sentiment reviving.
Can gold sustain this strong bull run or rebound? The key lies in breaking through $5100; only then will a further rebound be possible. The previous rebound was halted at $5100, and after a second decline to $4650, it did not break the previous low of $4400, indicating that bullish sentiment in the market has not subsided.
Central banks around the world continue to increase their gold holdings, which boosts bullish confidence. In the past two years, central banks have continuously increased their gold reserves to balance the single-asset risk of US dollar assets in their foreign exchange reserves, making gold a strategic asset of choice. Therefore, the focus is on what will support the continuation of the bullish trend. Geopolitical risks provide a temporary stimulus, but a sustained bull market requires stronger fundamental factors to form a consensus.
Gold prices opened higher in the Asian session. The key is whether the European session can continue the upward trend and even break through $5100. If the European session fails to continue the upward trend and instead falls below the starting point of the Asian session's rise, it indicates that this rise is a trap, and gold needs a correction to confirm the support level.
In the short term, the key level to watch is $4930, the starting point of the Asian session's rise. Above this level, it is advisable to focus on long positions, but it is important to adjust your strategy promptly if the price falls below $4930. The market is constantly changing; follow the market, and any attempt to manipulate the market is dangerous.

Dense data. Focus on the fluctuation range.On Friday, gold staged a V-shaped reversal, strengthening due to bargain buying and a weaker dollar, ultimately closing up 4%. Next week will be a crucial week this month, with a flurry of data releases and speeches from Federal Reserve officials.
After the market experienced a sharp decline, it entered a period of wide-ranging fluctuations this week, and this volatile trend is expected to continue for some time. However, it's important to note that the short-term high of 5600 and low of 4400 are unlikely to be breached; the market will likely fluctuate between the secondary high and low points. However, there will be a lot of data next week, which will likely intensify the market correction.
From the 4-hour chart, gold is currently facing short-term resistance around 5020-5030, while the key support level is around 4800. Gold is likely to continue fluctuating within this range next week until a new driving event or data event breaks this equilibrium and establishes a new trend.
However, regardless of whether a new market trend begins, the overall bullish pattern for gold remains unchanged. Looking at the daily chart, gold's lows are rising, ultimately forming a converging pattern upwards.
In terms of trading strategy, continue to focus on the overall range, prioritizing conservative trading with strict stop-loss orders to prevent sudden market changes from causing account losses.

Volatility continues. Trading is within the 4800-4960 range.Gold briefly tested above 5020 after opening in the Asian market on Thursday, then began to pull back and correct. During the European session, it faced renewed pressure at 4940-50, and the price is currently retracing to around 4820.
This suggests that the short-term rebound in gold has ended, and it may enter a medium-term consolidation and oscillation trend.
From a medium-term perspective, we are still more inclined to see a correction in gold. Currently, the moving averages on the 1-hour chart have crossed downwards, indicating a potential for further short-term decline. Short-term resistance can be observed at 4900, with major resistance at the 4940-60 trendline and the upper boundary of the range. The lower boundary of the range at around 4800 should be watched as support.
For short-term trading, it's important to note that the main strategy for gold in the US session is to observe the continuation of the correction, but given the still very large volatility, this poses a significant challenge to trading.
Aggressive traders can buy at 4890-4900, but due to the high volatility, it is crucial to maintain extremely small positions and close positions to take profits in real-time.
If the price tests 4960-70 again, aggressive traders can sell, with a profit target of 4820-00.
It is important to note that the current volatility is extremely high. It is crucial to maintain extremely small positions and close positions promptly after achieving a certain profit to mitigate the risks of sharp price fluctuations.I will post more strategies on the channel.

Continued volatility. Trading within the 4800-5000 range.The market surged and then retreated on Wednesday, with gains in the Asian session, consolidation in the European session, and downward pressure in the US session, resulting in a positive close on the daily chart. After continuing its upward trend in early Asian trading on Thursday, the market fell sharply, with 5091 likely being the high point of the rebound.
The Asian session on Thursday saw a sharp decline. You can observe the adjustment in the European session and look for opportunities to short.
After a rapid decline, gold rebounded strongly, but has now entered a period of short-term downward fluctuation. Overall, it is still in a period of adjustment and is expected to continue to fluctuate in the short term.
In the short term, gold may begin to gradually consolidate and fluctuate. The support level to watch for gold is around 4800, while the resistance level is around 5000-5020. It is likely to continue to fluctuate and adjust before choosing a direction. Short-term trading can still be done by buying low and selling high within the range.I will post more strategies on the channel.

Sell at resistance levels or buy at support levels.Reviewing market trends, the price fell to $4400 before rebounding above $5000, rising $600 in just two days this week. After the sharp drop, a sustained rebound followed, with a retracement to $4950 confirming support, leading to a period of wide-range fluctuations before a sharp rise above $5000.
Currently, there are two key levels to watch for the gold rebound: one is the $5100 level, which was the first support level after last Thursday's sharp drop and also represents a resistance level for this rapid rebound. This area is a zone of heavy trading; if you have positions that are currently underwater from last week, consider closing them at this level.
Gold continued its upward trend in early Asian trading on Wednesday, but it's crucial to manage position sizes carefully, especially avoiding heavily leveraged long positions. The lessons learned last week are still fresh in everyone's minds; please remember this period. Gold is currently continuing its rebound, with support in the $4,980-$5,000 range and resistance in the $5,100-$5,130 range. Volatility remains high. Buying at key support levels or selling at resistance levels is advisable, with a profit of 30-40 points being ideal.I will post more strategies on the channel.

XAU/USD Weakness Aligns With USD Strength🔻 XAU/USD – GOLD vs U.S. DOLLAR
📉 Metals Market Opportunity Blueprint (Day / Swing Trade)
Bias: 🔴 Bearish Continuation Plan
Market Type: Spot Gold (XAU/USD)
🎯 Trade Framework
Entry: Any favorable price level near rejection zones
Target: 4400
📌 Reason: Prior strong institutional support zone, oversold reaction likely + liquidity trap potential → book profits, don’t get greedy
Stop Loss: 4900
⚠️ High-risk SL — manage position size wisely
⚠️ Disclaimer (OG Rule):
I don’t recommend copying only my TP or SL.
This is your capital, your psychology, your responsibility.
Take money when market gives it 💰
🧠 Technical Narrative (Why Bearish?)
📉 Higher-timeframe distribution structure
❌ Repeated rejection from premium zones
💧 Liquidity sweep potential above highs
📊 Momentum exhaustion visible on intraday + daily context
🧲 Price magnet remains below → mean reversion in play
🔗 RELATED PAIRS & CORRELATION WATCHLIST
Keep these on radar — GOLD never moves alone 👇
💵 USD-Based Pairs
DXY (U.S. Dollar Index)
🔁 Inverse correlation → Strong USD = Weak Gold
USD/JPY
📈 Risk-on USD strength often pressures Gold
EUR/USD
📉 EUR weakness usually supports USD → Gold downside
📉 Risk & Yield Proxies
US10Y / US2Y Treasury Yields
⬆️ Rising yields = Non-yielding Gold becomes unattractive
S&P 500 / NASDAQ
📊 Risk-on flows reduce safe-haven demand
🌍 FUNDAMENTAL & ECONOMIC FACTORS TO MONITOR
(These drive volatility — trade with awareness, not fear)
🏦 Federal Reserve Outlook
Hawkish tone → USD strength → Gold pressure
Rate-cut delays = bearish for Gold
📊 High-Impact U.S. Data (Always Market-Moving)
CPI / PCE Inflation
Non-Farm Payrolls (NFP)
Unemployment Rate
FOMC Statement & Press Conference
🔥 Strong data = USD bid = Gold sell pressure
❄️ Weak data = temporary Gold bounce (watch for traps)
🧭 Risk Management Reminder
Scale out profits, don’t marry trades
Respect volatility during news windows
Trade reaction, not prediction
THIEF TRADER MOTIVATION
“Market doesn’t reward intelligence — it rewards discipline.”
“Take the money. Leave the ego.”
“Survive first. Flex later.” 💰
🕶️ Trade smart. Trade light. Escape with profits.

Price rebound? Pay attention to the location of the pressure.After experiencing the sharpest decline in decades, precious metals are seeing a "rebound and recovery." Currently, the bull market appears likely to continue. The sharp fluctuations that have occurred since last week are cooling down, but this does not mean that we are completely out of danger.At least for now, the recent rapid pullback in gold and silver prices has slowed down.
Currently, after breaking through the 4900 level, the highest price reached was around 4950. Overall, the trend has been relatively strong since the Asian market opened, with clear signs of a bullish counterattack. However, the selling pressure above is also considerable, and there has been no sustained upward movement.
The first resistance level on the 1-hour chart is 4950, which is also the dividing point we mentioned in the Asian session. Currently, we need to observe the trend of the US market. The entry point is not unique and needs to be adjusted in real time according to the market. We still need to pay attention to the breakout of 4950. If it cannot be effectively broken, we can short at this position. After a strong breakout, we need to pay attention to the resistance at the 5000 level.I will post more strategies on the channel.

Is the decline over? Pay attention to the 4900-4950 level.On Monday, gold continued its decline from Friday, falling from $4900 to $4400 before rebounding to above $4800, with a daily fluctuation of approximately $1000.
Has the gold price decline ended? The extent of the decline doesn't depend on support levels; currently, $4400 is being watched as a potential low point, just as $5600 was considered a high point. The actual highs and lows will only be known after the market moves.
Currently, the key factor determining the overall direction of gold is the 100-day moving average. This is the true indicator of bullish or bearish sentiment. Another important level is the breakout situation at $4900-$4950. Recent market volatility has been extremely exaggerated, with 1-minute candlesticks fluctuating by $20. The entry point is crucial in this volatile, wide-ranging market, and holding positions for extended periods is no longer the best strategy.
In the short term, the focus is on whether the price can be broken within the $4900-$4950 range. Shorting can be tested near this level. Once the price breaks through, a new strategy can be considered. The specific strategy will depend on the trend change. However, remember that $4900-$4950 will determine whether this sharp decline ends and transitions into a consolidation phase.

The huge fluctuations continued. Sell at the high point.Gold rebounded after finding support at the 4400 level, but encountered significant resistance near 4800. This clearly reveals that the market is currently in a volatile pattern of "support at low levels, but no consensus at high levels."
The current technical indicators show a struggle between bulls and bears: the narrowing of the 1-hour Bollinger Bands indicates a convergence of short-term momentum, and although the 4-hour chart shows a solid bullish candlestick, it remains under the pressure of the bearish MACD. The key transition zone is located at 4680-4650. If this area successfully transforms from resistance to support, the rebound is expected to continue and test 4858-4893; otherwise, if the rebound is weak, the market will return to a bearish trend and test lower support levels.
Looking at the 1-hour price chart, the price showed a V-shaped rebound followed by a continued weakening trend. After hitting a low of 4400, it rebounded, reaching a high of 4800 before falling again. The price fluctuated by 400 points in a short period of time. The surface trend continues the pattern of Friday's significant volatility.
Given that the longer-term indicators still favor a bearish outlook, it is not advisable to be overly optimistic about the rebound. It is recommended to use the high point as a stop-loss and sell near 4800 where the rebound is weakening, betting on a second test of support levels..I will post more strategies on the channel.

The decline continues. Pay attention to key positions.On the first trading day of this week, gold continued its recent extreme volatility, exhibiting an overall trajectory of "bottoming out and rebounding + range-bound trading". After stabilizing at a low point, a wide rebound was triggered, but it failed to break through the key resistance level of 4780, subsequently retreating again. This confirms the intense tug-of-war between bulls and bears in the current market, highlighting the short-term price movements driven by market sentiment.
Key Resistance Levels: The resistance around 4780 is a key area to watch, as it has formed a clear short-term resistance level. Secondly, the secondary resistance at 4710 should be monitored. If there is no strong rebound momentum during the European trading session, this price level may become a key reference point for short-selling strategies, serving as an aggressive short-selling entry point.
Support Levels: Focus on the two key price levels of 4585 and 4535, which offer some short-term support. 4535 serves as an extended support level. These two positions are also the core reference ranges for buying on dips in a wide-range fluctuation pattern. Buying in batches when the price first touches these levels is relatively cost-effective.
It is worth emphasizing that market risk appetite is extremely sensitive recently, and the suddenness and intensity of price fluctuations have significantly increased. Therefore, conservative investors may choose to filter out the current extreme market conditions and avoid blind participation. Investors with trading needs must strictly control their positions and stop-losses.I will post more strategies on the channel.

XAUUSDT - Bullish Continuation or Deeper Correction?XAUUSDT on the Daily (1D) timeframe remains in a medium- to long-term uptrend, but is currently undergoing a sharp corrective move (impulsive pullback) after printing a new All-Time High (ATH) around 5,626.
This decline has pushed price back into a major demand / support zone, which will be critical in determining the next directional move.
---
Trend Structure
Primary trend: Bullish (Higher High – Higher Low structure remains valid)
Current condition: Healthy correction within an uptrend
Momentum: Temporarily weakened due to heavy profit-taking from ATH
---
Pattern Explanation
1. Bullish Continuation Structure
From a higher-timeframe perspective, price continues to form:
Higher High (HH) → ATH
Higher Low (HL) → potentially forming within the yellow zone
This correction does not invalidate the bullish structure, as long as price holds above the support block.
2. Support Block / Demand Zone
📦 Yellow Block: 4,390 – 4,280
This area previously acted as a consolidation and accumulation zone
It served as the launch point for the bullish impulse toward ATH
Technically, this remains a valid demand zone for a potential bullish reaction
---
Key Levels
Nearest resistance:
4,765
5,000 (psychological level)
Major resistance:
5,400 – 5,626 (ATH zone)
Key support:
4,390 – 4,280 (Support Block)
Lower support if breakdown occurs:
4,050
3,890
---
Bullish Scenario
✅ Valid as long as price holds above 4,280
Potential developments:
Price shows rejection or base formation within the support block
A bullish reversal candle appears (pin bar / bullish engulfing / strong daily close)
Formation of a new Higher Low (HL)
🎯 Bullish targets:
4,765
5,000
Retest of ATH at 5,400 – 5,626
➡️ This scenario confirms the move as a healthy pullback within a broader uptrend.
---
Bearish Scenario
❌ Valid if a strong daily close occurs below 4,280
Potential developments:
The support block fails to absorb selling pressure
Bullish market structure begins to break
Price enters a deeper correction or trend-weakening phase
🎯 Bearish targets:
4,050
3,890
Worst-case scenario: retest of lower demand around the 3,600 area
➡️ A breakdown would shift bias from bullish continuation to neutral-bearish correction.
---
Conclusion
XAUUSDT is currently at a critical decision zone.
The yellow support block at 4,390 – 4,280 will determine whether:
The bullish trend continues toward new ATHs, or
Price undergoes a deeper corrective phase
As long as this support holds, the overall bias remains bullish.
#XAUUSDT #GOLD #GoldAnalysis #PriceAction #SupportResistance #BullishContinuation #CryptoTrading #MarketStructure

An epic drop. Analysis for next week.Gold prices plummeted on Friday, hitting a low of 4682 before rebounding to close at 4883. In just one week, the price fell from a record high of 5600 to a low of over 900 dollars, making it an epic crash.
Gold prices have recently fluctuated wildly due to international turmoil and the influence of the Federal Reserve. Judging from the closing trend, gold prices are likely to continue to fluctuate and decline next week. However, this doesn't necessarily mean a lack of confidence in gold's upward trend. Simply put, the rally at the beginning of the week deviated from technical analysis, and Friday's decline was a correction of the previous gains. Remember, no matter how strong the bullish trend is, it cannot escape correction and retracement.
From the 4-hour chart, the short-term resistance level to watch is 4970-4990, while the short-term support level is 4830-35. The key focus is on whether the low point is broken. After a sharp drop, a short period of consolidation and adjustment is needed.
Trading Recommendations:
Short at 4970-90 (small position), add to position at 5000-5020, stop loss at 5035, target 4830-35, hold if it breaks through.

Huge fluctuations. Be wary of another sharp pullback.The gold market is never smooth sailing; volatility is the norm, and both rises and falls present challenges. Don't be impatient due to sudden surges, nor underestimate yourself because of brief pullbacks. Every market correction filters out the steadfast, and every adjustment prepares the ground for a new market trend. Anchor your direction with rationality, cultivate confidence with patience, and don't let short-term fluctuations disrupt your rhythm!
On Thursday, gold bulls tested the 5600 level, but the US session suddenly collapsed, with a rapid drop of 400 points in one hour and 212 points in five minutes – a truly breathtaking moment. Friday saw a similar pattern, reaching a high of around 5450 before quickly falling back to around 5111 in the early Asian session. Short-term fluctuations were tens of dollars per minute, making short-term trading extremely difficult. Currently, the technical picture shows a large range-bound movement, offering no favorable trading environment.
Under such violent volatility, any trade can be wiped out instantly. What we need to do now is patiently wait for market sentiment to cool down, for volatility to return to rationality, and for the trend to emerge clearly.
Friday will see the announcement of the new Federal Reserve Chair, with Kevin Warsh currently the frontrunner. If elected, his election would significantly boost the dollar and US Treasury yields, which would put downward pressure on gold prices. Therefore, everyone should be wary of another sharp price correction on Friday.I will post more strategies in the channel.

Interest rate decision. Will the high point be surpassed again?The gold market has recently continued its strong upward momentum. As a globally recognized safe-haven asset, gold prices have hit new historical highs for eight consecutive days, successfully breaking through the $5250 mark and reaching the psychological barrier of $5300 during Wednesday's Asian trading session.
This phenomenon not only reflects the complexity of the current economic and geopolitical environment but also highlights investors' heightened sensitivity to uncertainty. Market funds continue to flow into gold due to the impact of decisions made by US President Donald Trump, while changes in the Federal Reserve's policy outlook further reinforce this trend.
Later interest rate decisions, even if the data is bearish, should not have a significant impact, as the market remains in a bull market. Currently, there is strong support around 5250-5230, which has now become a key support level. As long as this level is not broken, the market remains in an uptrend.
In summary, the short-term trading strategy for gold today should primarily focus on buying on dips, with selling on rallies as a secondary approach. The key resistance level to watch in the short term is 5290-5310, while the key support level to watch is 5250-5230.The gold market has recently continued its strong upward momentum. As a globally recognized safe-haven asset, gold prices have hit new historical highs for eight consecutive days, successfully breaking through the psychological barrier of $5250 and reaching $5300 during Wednesday's Asian trading session.
This phenomenon not only reflects the complexity of the current economic and geopolitical environment but also highlights investors' high sensitivity to uncertainty. Influenced by decisions made by US President Donald Trump, market funds continue to flow into the gold market, and changes in the Federal Reserve's policy outlook further reinforce this trend.
Later, even if the interest rate decision data is bearish, the impact should be limited, as the market is still in a bull market. Currently, the strong support level is around 5250-5230, which acts as a support-resistance flip point. As long as this level is not broken, the upward trend remains intact.
In summary, the short-term trading strategy for gold today is primarily to buy on dips and sell on rallies. The key resistance level to watch in the short term is 5290-5310, while the key support level to watch for buying opportunities is 5250-5230. I will post more trading strategies in the channel.

The market is strong. 5240 is not the end point.In the blink of an eye, the price of gold has reached $5,200. Gold no longer gives people time to think. A rise of $100 is as easy as breathing air. Just two days ago, people thought $5,000 was outrageous, but now that seems like a thing of the past. As for how high it can rise, no one can predict. As long as Trump is present, the US debt crisis exists, and geopolitical risks do not ease, the market's risk aversion will not be alleviated.
January is almost over, and the market delivered a perfect performance in the first month of 2026. The accelerated rise is impossible to keep up with, and the overall trend will continue to push prices higher. The Fed's interest rate decision was priced in, and nobody cares whether there will be a short-term rate cut. The market enthusiasm continues to push up gold prices as the rate cut cycle has not ended.
Current prices have no technical indicator relevance, and price analysis is becoming less important. The more people buy, the faster the price rises, which will further accelerate the increase in gold prices.
In the short term, the outlook for gold remains bullish. Pay attention to the 15-minute chart for potential pullbacks and look for entry points to go long during the trading session. The support level is between 5150 and 5170. As gold price volatility increases, stop-loss levels should be adjusted accordingly. With the market surging,I will post more strategies in the channel.

Pay attention to short-term resistance. Buy on dips.Gold Technical Analysis: The technical indicators show an upward channel, but short-term overbought conditions warrant caution. The technical chart shows that gold is currently in a clear short-term upward channel. Although it failed to break through the upper rail and fell back, the rapid rebound indicates that the bulls still dominate.
In terms of indicators, the MACD histogram has turned negative and continues to widen, indicating a weakening of short-term momentum; the RSI has reached 70.84, entering the overbought zone and beginning to decline, suggesting that bulls may face consolidation pressure. However, as long as the price stays within the channel, the overall upward trend remains intact. The technical outlook remains generally bullish, but short-term attention should be paid to the volatility risks brought about by the Federal Reserve's decision.
With multiple positive news factors converging, gold prices still have significant upside potential, and the current gold market is experiencing a confluence of favorable factors. Despite the potential for short-term uncertainty from the Federal Reserve's decision, the path of least resistance for gold prices in the medium term remains upward, and the possibility of breaking through $5100 and continuing to rise is increasing.
In summary, the short-term trading strategy for gold today is primarily to short on rallies and buy on dips. The key short-term resistance levels to watch are 5100-5150, and the key short-term support levels are 5020-5050..I will post more strategies in the channel.

Waiting for the adjustment to complete. Continue to push upwardsOn Monday, gold prices gapped higher, opening above $5090, repeatedly breaking through market expectations. The focus now shifts to the Federal Reserve's January interest rate decision. A rate cut is unlikely at this time, given that Powell is embroiled in legal issues and only has three months left in his term. A significant or dramatic rate cut is improbable; the appointment of a new chairman and their policy stance will be key.
On the 1-hour chart, gold opened higher and continued to rise before entering a consolidation phase. Short-term moving averages are trending upwards, and the correction was relatively limited. After touching the intraday low of $5013 per ounce, the price rebounded quickly, demonstrating strong buying support. The Bollinger Bands are widening, maintaining the characteristics of an upward trend, with the price trading above the middle band, which acts as dynamic support. There is no sign of weakness or a break below the middle band.
In terms of momentum indicators, the MACD indicator shows a continued bullish crossover, although the red energy bars have slightly contracted, reflecting a short-term slowdown in bullish momentum – a rhythmic adjustment within an upward trend, not a sign of momentum exhaustion. The RSI is in the 60-70 range, not yet reaching extreme overbought levels, indicating some technical room for further upward movement. Overall, the upward channel on the 1-hour chart remains intact, and the consolidation is accumulating momentum for the subsequent trend. No obvious bearish volume signals appeared during the pullback.
The technical structure shows high-level consolidation within the $5100 range. In the short term, the direction of gold is still predominantly bullish, and a break above $5090-$5100 would further propel the price upwards.I will post more strategies in the channel.
The trend remains intact. Target price: 5150-5200.Gold prices rose to around 5111 today but encountered resistance and pulled back. It is currently continuing its correction. It is not recommended to chase the rally at the high point, as the bulls have just pulled back and are adjusting, and the technical indicators suggest that the price needs to consolidate below. The overall trend remains bullish; the strategy is to buy on dips and patiently wait for entry opportunities after the pullback.
Based on historical patterns of similar price movements, the theoretical target after this breakout points to the $5300-$5400 area. Gold prices have surged past the psychological level of $5,000 and are now heading towards that target area. Weekly momentum indicators still provide support: the MACD maintains a bullish signal, and while the RSI is high, it hasn't shown extreme exhaustion, indicating continued upward momentum.
The key support level has moved up to the recent breakout zone of $5000-$5040, with the most crucial support located at the breakout point of $4970. As long as the price holds above this area, the trend structure remains intact, and the path of least resistance remains upward.
Short-term strategy recommendation:
Buy at 5050-55, add to position at 5040, stop loss at 5030, target 5100-5120, and after a breakout, watch for 5150-5200.I will post more strategies in the channel.

Breaking through 5100. Aiming for even higher levels.For the past month, gold prices have consistently gapped higher at the open of Asian trading for four consecutive weeks. This time, due to Trump's tariffs on Canada, gold prices broke through the $5000 resistance level after the open, surging towards $5100. Risk aversion is amplified exponentially during a bull market.
Now, observing the 15-minute chart is sufficient for gold. Price fluctuations are becoming increasingly volatile. The volatility of gold hasn't changed, but because the base price has increased, a 3% fluctuation now represents $150. Even slightly positive news can send the price up by $100. Looking back at the high point reached, it has now become the support line for the pullback and a lower point.
The short-term direction for gold prices remains bullish. The support zone is concentrated in the $5030-$5520 range. The key to the rapid rise in Asian trading lies in its continuation during European trading. The $5100 level will likely be broken soon; after the breakout, watch for $5120-$5130.I will post more strategies in the channel.

The upward trend continues. Above 5000.On Friday, the market closed at $4987, after reaching a high of $4990 during the US trading session before consolidating until the close. The market is likely to continue its bullish trend next week, and reaching the 5000 level should be within reach.
Currently, the daily chart continues to show a bullish candlestick pattern with a lower shadow, supported by five consecutive days of gains. In the short term, the market is full of strong upward momentum. This is partly due to geopolitical factors, and partly due to continued buying of gold by major institutions, which keeps the price of gold so firm.
From a technical perspective, the MACD continues to show increasing volume, indicating strong bullish momentum. The Bollinger Bands are widening upwards, and the price is steadily climbing along the upper band. On the 4-hour chart, gold prices are consolidating at high levels, with the Bollinger Bands widening, indicating strong bullish momentum and continued upward potential in the short term. The key resistance level remains at the psychological $5000 mark, which may create some pressure. Short-term traders should be wary of potential pullbacks and patiently wait for entry opportunities after any retracement. The support level below is around 4945-4950.
Trading Strategy:
Buy at $4945-$4950, add to position on a pullback to $4925, stop loss at $4915, target $4990-$5000, hold if the price breaks through.I will post more strategies in the channel.
