XEC/USDT — Descending Triangle: Breakout Toward or Breakdown?XEC/USDT is currently moving in a critical consolidation phase after a prolonged downtrend since early 2025. On the 2D timeframe, the chart clearly forms a descending triangle, with a consistent downtrend line pressing the price lower, while buyers are still defending a strong support zone at the bottom.
---
🔎 Technical Overview
Main Pattern: Descending Triangle (statistically bearish continuation, but direction requires confirmation).
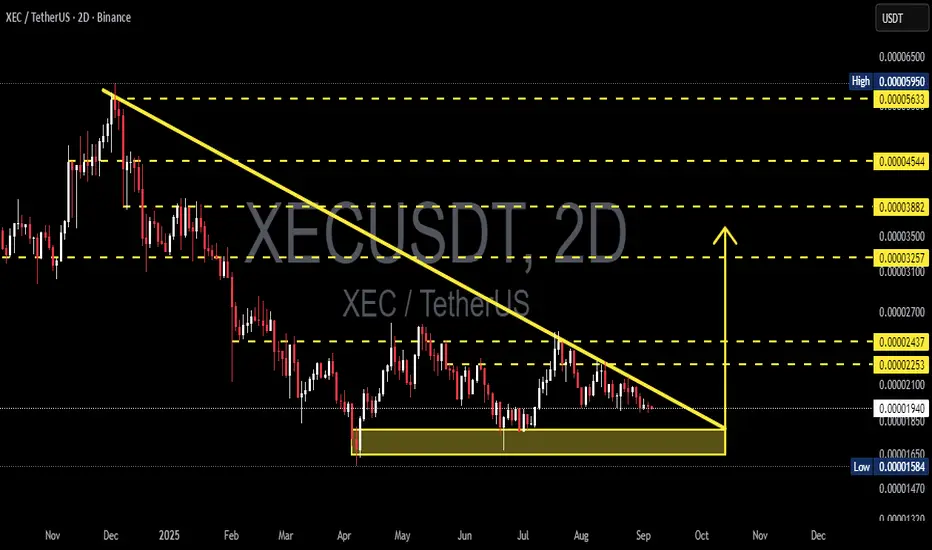
Key Support Zone (yellow box): 0.00001584 – 0.00001850 → tested multiple times as buyers’ defense.
Downtrend Line: Pressuring price since early 2025, showing persistent selling pressure.
Current Price: around 0.00001940.
First Resistance Zone: 0.00002253 – 0.00002437 (critical breakout area).
Higher Resistances: 0.00003257, 0.00003882, 0.00004544, up to 0.00005633.
---
🟢 Bullish Scenario
If the price breaks above the downtrend line and closes above 0.00002253–0.00002437 with strong volume, the descending triangle may fail as a bearish setup and instead flip into a bullish reversal signal.
Measured Move Target: ~0.00003106.
Next Resistance Targets: 0.00003257, 0.00003882, and 0.00004544.
Upside Potential: +60% to +120% from current levels if momentum follows through.
Retest of the broken trendline as new support would add extra confirmation.
---
🔴 Bearish Scenario
If price fails to hold and closes below 0.00001584 on the 2D chart with strong volume, the descending triangle confirms its bearish continuation pattern.
Downside Target (measured move): ~0.00000730.
Downside Risk: More than -60% from current price levels.
After breakdown, a small pullback to retest the old support as resistance is highly possible before further decline.
---
📌 Key Notes
Volume is crucial: A breakout/breakdown without significant volume risks becoming a false move.
Confirm via 2D close: Intraday wicks can be misleading; use 2D candle close for validation.
Risk management:
For bullish setups → stop-loss below support zone.
For bearish setups → stop-loss above retest zone.
Market context: Altcoins like XEC are highly influenced by BTC’s dominance and overall crypto liquidity — always check the bigger picture.
---
📝 Conclusion
XEC is now at a make-or-break level. The descending triangle could resolve into two extremes: a bullish reversal breakout toward 0.000031–0.000038, or a bearish breakdown toward ~0.000007.
As long as price trades inside the triangle, the best approach is to wait for breakout or breakdown confirmation before taking major positions. Aggressive traders may prepare for breakout + retest entries, while long-term investors might see this support zone as an accumulation range — but with strict risk management.
---
#XEC #XECUSDT #CryptoAnalysis #TradingView #Altcoin #ChartPattern #DescendingTriangle #BreakoutTrading #CryptoStrategy
Xecusdtanalysis
XECUSDT 1WXEC ~ 1W Analysis
#XEC This is the lowest support for now. Buy gradually from here if you still have a Conviction on this Coin with a minimum target of 20%+.

XECUSDT 1WXEC ~ 1W
#XEC If you still have Conviction on this coin,. This support block would be a very good buying place for now,. With a minimum target of 20%++

XECUSDT Update 1WXEC Update ~ 1W
#XEC We got a very good entry on this support block,. and the price takes our Limit order. Minimum 20%+ target Take profit gradually.

XECUSDT 1WXEC ~ 1W
#XEC If you still have Conviction on this coin. Buy gradually when retesting this support block. with a minimum target of 20%++
