This Is Not a Reversal: #XMR’s Structure Signals downside
Yello Paradisers! Are you aware that #XMRUSDT is currently in one of the most deceptive Elliott Wave phases, where the price looks stable, but the structure strongly suggests another sharp downside move is still ahead?
💎#XMR after the sharp decline from the all-time high, has been unfolding a textbook structure inside a dominant descending channel. From a higher-timeframe Elliott Wave perspective, the market is clearly positioned within wave 4 of the larger impulsive decline. This is a critical phase, as wave 4 corrections are designed to exhaust late participants before the final continuation leg unfolds.
💎The current price action is forming an ascending corrective channel, but it is important to understand that this move is not impulsive. Structurally, this advance fits perfectly as an ABC/WXYXZ complex correction, developing entirely within the boundaries of the broader bearish descending channel. This tells us that the market is correcting in time and structure, not reversing the trend. In professional Elliott Wave terms, this is a classic setup before wave 5 continuation to the downside.
💎Market participation further validates this count. Volume has been consistently decreasing throughout the ascending channel, indicating a lack of real buying interest. This contrasts sharply with the previous sell-offs, which were accompanied by expanding volume, confirming that sellers remain in control of the primary trend. Corrective advances with declining volume are a strong hallmark of wave 4 behavior.
💎Momentum also aligns perfectly with this interpretation. RSI is showing a hidden bearish divergence between the last two swing highs, a signal that momentum is resetting in favor of the prevailing downtrend rather than building strength for a reversal. Hidden divergence in wave 4 environments typically precedes strong trend continuation moves.
💎From a structural level perspective, $420 remains the key resistance zone and aligns with the upper boundary of the corrective formation. On the downside, $277 acts as an important interim support, while $230 is the major support area and a logical downside objective once wave 5 begins. A decisive breakdown of the ascending corrective channel would confirm the completion of wave 4 and activate a high-probability wave 5 continuation scenario.
If you want to be consistently profitable, you need to be extremely patient and always wait only for the best, highest-probability trading opportunities. Strive for consistency, not quick profits. Treat the market as a businessman, not as a gambler. This is the only way you can get inside the winner circle of Paradisers.
MyCryptoParadise
iFeel the success🌴
XMRUSDT

XMR Trade Setup – Eyes on the Reversal ZoneXMR is currently ~50% below its ATH, with recent price action unable to hold above the critical $410 resistance. This breakdown has opened the door to further downside, with the next major support zone becoming a key area to watch. If sentiment improves, this zone could act as a reversal base.
🔍 Potential Entry Zone: $323 – $343
This range aligns with historical demand and may attract fresh buyers. It's where I'm looking for a reaction before confirming any setup.
🎯 Targets:
TP1: $410
TP2: $480
TP3: $620
🛑 Stop-Loss: $296
Below key structure – protects against deeper breakdowns.
Waiting for confirmation in the zone. Risk management is key.
🕒 Patience wins. Let price come to you.

Monero at support, I get a feeling that it isn't overJust as there is a reaction at resistance; whenever a strong resistance level is hit, the market always produces a retrace or correction. In reverse, when the action reaches support a reversal can happen even if only a small one.
Monero is now trading at support after three red weeks. The session that produced the all-time high can also be considered negative.
Now, trading at support, there can be a reversal and this reversal can lead to a challenge of the same resistance from last month. It works in two ways.
If the bullish reversal stops around $600-$650 we know a lower high will result followed by lower prices. If the rise can go beyond this level, we know the ATH range can be tested as resistance once more.
If Monero can go toward a new all-time high fully depends on price action—live. It is hard to make such a prediction because the market already produce outstanding growth so anything goes.
Lower high, double-top or higher high, the chart calls for a reaction at support. This means some sort of bullish action before XMRUSDT moves lower. There is growth potential on this chart.
Since the entire market is turning bullish now, this supports the signals here present for a new rising wave.
Namaste.

#XMR Just Flipped Control – Bears Are Running Out of Time
Yello Paradiser!, are you aware that #XMR has been signaling the exhaustion of its bearish cycle long before the recent breakout even occurred? The structure has been quietly transitioning from distribution into accumulation, and the market is now starting to reveal that change.
💎#XMR shows a clear deceleration of downside momentum from one descending channel into another. In Elliott Wave theory, this behavior is commonly seen during the late stages of a corrective or impulsive decline, particularly as wave 5 begins to lose strength. This structural compression strongly suggests that the downtrend was nearing completion.
💎The recent breakout from the descending channel is technically critical. Price has decisively crossed above the top of wave 4, which confirms a Change of Character (CHoCH). A bullish divergence on the RSI between wave 3 and wave 5. This is a classic confirmation of wave 5 termination and increases the probability that a trend reversal is already in progress.
💎The breakout occurred with a sharp and impulsive move to the upside, which is characteristic of a wave 1 or wave A advance. Such price behavior reflects strong demand entering the market and confirms that buyers have regained control of the short-term structure.
💎From here, two primary Elliott Wave scenarios remain valid. #XMR may be starting a new impulsive bullish cycle in the form of a 1–2–3–4–5 structure, or it may be developing a corrective ABC or WXY rally within a larger-degree bearish trend. Regardless of the macro labeling, both scenarios point toward one more strong upside expansion before any meaningful correction occurs.
💎Key resistance is located at the top of the larger-degree wave 4, around the $650 region. This level represents the natural target for the current advance and could be exceeded if the move develops impulsively. On the downside, major structural support is located near $410.
Strive for consistency, not quick profits Paradisers. Treat the market as a businessman, not as a gambler. This is the only way you will make it far in your crypto trading journey. Be a PRO💰
MyCryptoParadise
iFeel the success🌴

#XMR Triangle Is Almost Complete — The Final Flush Could Be Brut
Yello Paradiser! Are you watching closely, or are you going to be late again to one of the cleanest wave-based setups on #XMR? We may be approaching the final stages of a larger corrective cycle, but the trap is being set — and only those with patience and discipline will be ready when the real move begins.
💎#Monero has been unfolding in a textbook five-wave decline from its major high near $800, and right now, we are deep in wave 4 of an extended wave 5 — a critical stage where most traders either overcommit too early or get completely shaken out before the actual reversal. The current structure is forming a contracting triangle, which is a classic characteristic of wave 4. These patterns are notorious for building tension and compressing volatility before a sharp final move in the direction of the prevailing trend.
💎The price action is also perfectly respecting a well-defined descending channel, reinforcing the idea that the broader bearish structure remains intact. This channel, along with the triangular consolidation, suggests that there’s one final flush to come — the terminal wave 5 of the extended fifth — which could complete the entire corrective cycle from the macro top.
💎Our projected completion zone for this entire move lies in the $400–$420 region. This area isn’t just a psychological round number zone; it also represents the convergence of structural channel support and historically reactive levels from earlier phases of the trend. This makes it a high-probability demand zone, where we expect long-term buyers to step in, especially if broader market sentiment hits capitulation.
💎It’s important to highlight that the invalidation level for the current count is sitting around the $600 mark. A sustained move above that level would negate the triangle and invalidate the current interpretation of this being a final wave 4–5 sequence. Until then, however, the structure remains technically valid and offers a clear road map.
💎As with all wave 4 triangles, we must remain extremely cautious. These patterns are designed to frustrate both sides of the market, producing multiple fake breakouts and whipsaws. Acting prematurely — especially in a late-stage wave structure — can be extremely dangerous, and most traders lose capital here not because they’re wrong, but because they’re impatient.
💎If the final wave 5 unfolds as expected, we’ll likely see sharp liquidation and emotional selling that clears out weak hands. That would align with the psychology of a terminal move — marked by panic, exhaustion, and climax volume. It’s at that moment, when everyone gives up, that we’ll begin hunting for the reversal confirmation.
💎A big liquidation event, which will first take both longs and shorts and fully get rid of all inexperienced traders before the real move happens, is very close to happening again, so make sure you are playing it safe, Paradisers. It will be a huge money-maker for some and a total disaster again for the majority.
Stay focused Paradisers , follow the structure, and avoid emotional decisions. As always — timing and disciplined execution will separate those who succeed from those who just watch the market move without them.
MyCryptoParadise
iFeel the success🌴

Structure Still Bullish On XMR (3D)📈 Bullish Market Structure
From the point where the green arrow is marked on the chart, price has clearly entered a strong bullish phase. Based on the current price behavior, market structure, and wave development, this movement strongly resembles a Bullish Diametric pattern, which typically appears during complex corrective structures before continuation.
At the moment, price is moving inside Wave F, which is the current active leg of this pattern. Importantly, Wave F has already delivered a healthy and controlled correction, both in price and structure. This correction is constructive and aligns well with the characteristics expected in a valid Diametric formation.
🟢 Key Support Zone & Market Expectation
The green highlighted zone on the chart represents a high-probability support area. From this region, we expect price to:
Hold above support
Spend some time building a base (accumulation)
Complete a time correction rather than a deep price correction
After this consolidation phase, the market is expected to transition into Wave G.
🚀 Wave G Outlook – Bullish Continuation
In a Bullish Diametric pattern, Wave G is inherently bullish and often leads to a strong continuation move in the direction of the main trend. If the structure plays out as expected, Wave G could deliver a powerful impulsive move, pushing price toward the predefined upside targets.
🎯targets : Targets : 668$ _ 1100$
💡 Trading Strategy – Smart Risk Management
The green zone is considered an optimal DCA (Dollar-Cost Averaging) entry area
Avoid chasing price; let the market come to your levels
Scale into positions gradually to manage risk effectively
This approach allows traders to stay flexible while positioning themselves early for the anticipated bullish expansion.
❌ Invalidation Level – Risk Control Is Key
This analysis will be invalidated if:
A weekly candle closes below the invalidation level marked on the chart
A weekly close below this level would signal a structural failure of the pattern and require a full reassessment.
If you have a coin or altcoin you want analyzed, first hit the like button and then comment its name so I can review it for you.
This is not a trade setup, as it has no precise stop-loss, stop, or target. I do not publish my trade setups here.

XMR / USDT Approaching Key Support — 30% Bounce PossibleXMR / USDT is declining aggressively for a healthy retest of a key support zone. If price shows a strong reaction from this level, a clean bounce is expected, with a potential upside move of around 30%. Market conditions remain highly volatile, so proper risk management and confirmation are essential before entry.

XMR +150% Since Last Analysis | Key Levels to WatchMonero (XMR) has delivered a strong performance, rallying over +150% since our last published idea. This momentum reflects growing demand for privacy-focused assets and resilience in the altcoin sector, even as broader market sentiment remains mixed.
That said, we’re closely watching Bitcoin’s structure — continued BTC weakness could trigger a pullback in XMR. Any sustained drop in BTC may weigh on alts and send XMR back toward lower support zones before the next bullish leg.
📌 Trade Setup
Entry Zone: $480 – $501
Targets: $555 / $605 / $690
Stop Loss: $438
Maintain a disciplined approach and adjust risk management according to broader market conditions. Monitoring BTC price action will be crucial here.

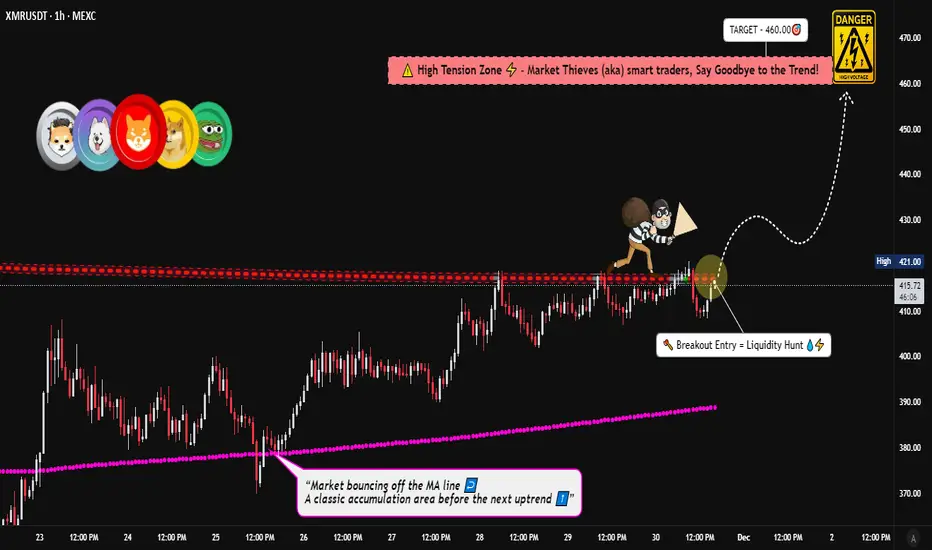
Monero Price Action Report — Breakout Strength and Target ZoneXMR/USDT Bullish Breakout Blueprint! 🚀📈 (Swing & Day Trade Plan)
Description:
Monero is awakening! 🦋 A dynamic breakout is in play, offering a clear technical setup for both swing and day traders. Here’s your professional blueprint to navigate this opportunity.
📊 Trading Thesis: Bullish Breakout
The setup is confirmed by a breakout above the key Weighted Moving Average (WMA) dynamic resistance near 420.00. This signals a potential shift in momentum and opens the door for a bullish move.
🎯 Execution Plan
🟢 Entry Zone: Any price AFTER a confirmed breakout & close above 420.00. Look for a retest of the WMA as support for an optimal risk-reward entry.
⛔ Stop Loss (Risk Management): A logical stop loss can be placed below 390.00, which is under the recent support and WMA structure.
⚠️ Disclaimer: This is my suggested SL based on my strategy. You MUST adjust your position size and stop loss based on your own risk tolerance and capital. Always wait for breakout confirmation before placing your SL.
🎯 Profit Target (Take Profit): Our primary target is the 460.00 zone. This area represents a strong historical resistance level and could coincide with overbought conditions. Secure your profits proactively!
💡 Professional Note: This is my initial target. You are free to take partial profits earlier or trail your stop. "Make money, then take money" – manage your trade actively!
🔍 Key Levels & Rationale
Bullish Trigger: WMA Breakout > 420.00
Invalidation Level: < 390.00 (Bullish structure broken)
Target Zone: 460.00 (Major Resistance & Profit-Taking Zone)
🌐 Related Pairs & Market Correlations
Diversify your watchlist! The crypto market is highly correlated. Movements in XMR often relate to these assets:
CRYPTOCAP:BTC.D (Bitcoin Dominance): 📉 A decrease in BTC.D often fuels altcoin rallies, which is bullish for XMR.
BTC/USDT: 👑 The King leads, alts follow. A strong, stable, or rising Bitcoin is generally positive for the entire crypto market, including Monero.
Privacy Coin Sector:
CRYPTOCAP:ZEC (Zcash) & NASDAQ:DASH 📊
Key Point: Watch these for sector-wide momentum. A bullish move in XMR is often mirrored in other major privacy coins, confirming a sector trend.
Major Alts:
ETH/USDT 💙 & XRP/USDT ⚡
Key Point: Strength in large-cap alts like ETH and XRP creates a risk-on environment, which is beneficial for mid-cap coins like Monero.
✅ Final Checklist Before Entering:
✅ Breakout & close above WMA (420) confirmed?
✅ Volume supporting the move?
✅ SL set according to MY risk management?
✅ Related pairs (BTC, ETH) showing strength?
Let me know your thoughts in the comments! 💬 Are you bullish or bearish on XMR?
Like & Follow 👍 for more high-quality, actionable trade ideas!
#TradingView #XMR #Monero #Crypto #SwingTrading #DayTrading #TechnicalAnalysis #Breakout #WMA #BTC #Altcoins #DeFi
XMR/USDT — Post-Parabolic Structure: Correction OnlyAfter ~900 days of accumulation in the $100–180 range, Monero rallied to $800 on the privacy-coin narrative.
RSI may not look extremely overbought at first glance, but for this asset, the current zone has historically marked reversal territory.
Can it go higher? — Yes.
Is it worth buying after such a move? — No.
Shorting vertical moves like this is a bad idea.
The only reasonable approach here is to trade a corrective bounce.
One option is to scale in using a grid starting from the 0.5 Fibonacci level, which aligns with the previous ATH at $516.
The strategy is straightforward: sell the entire position on a bounce to the next level and step aside.
📌 Important note: historically, a breakdown below the accelerated dynamic trendline (blue line) has always signaled the end of the rally — especially after a retest from below.
For medium- or long-term positions, I wouldn’t consider XMR until price returns back into the prior accumulation range.

XMRUSD: Multi-Year Monthly Breakout Signals New Macro CycleMonero (XMR) is breaking out on the monthly timeframe after a 105-month (~3,200 days) compression phase, forming a long-term ascending triangle.
Price has respected a rising support trendline since the 2016–2017 cycle while repeatedly testing a flat macro resistance zone, which has now been decisively broken with strong bullish momentum. The current monthly candle shows expansion in range and volume, signaling a potential regime shift rather than a short-term move.
Key observations:
- Multi-year higher lows against horizontal resistance
- Clean monthly close above resistance
- Long consolidation typically precedes impulsive moves
- Structure suggests price discovery phase may be beginning
If the breakout holds, XMR could be entering a new long-term bullish cycle, with upside targets extending significantly higher over the coming years.
Cheers
Hexa

Monero (XMR) Just Woke Up: Structural Breakout AnalysisWhile the market is distracted by the majors, Monero ( CRYPTOCAP:XMR ) has quietly engineered a massive structural shift on the daily timeframe.
Monero just broke its multi-month resistance with impulsive volume. The "Roof" has officially become the "Floor."
No wicks.
Pure demand.
Structure shift.
Is this the start of a new macro run? Let's wait and watch.

Monero XMR price analysisIs CRYPTOCAP:XMR preparing to break its ATH?
Looking at the #XMRUSDT chart, it feels like #Monero is approaching a critical moment.
After years of consolidation, a confirmed hold above $520 could mark the start of a real harvest season 🌾
🔓 This level may become the key trigger that shifts CRYPTOCAP:XMR into a new market phase.
🎯 So what’s the real target for #Monero?
▪️ $1250?
▪️ Or even much higher — $4300?
💰 Current market cap is around $7.9B.
Do you believe CRYPTOCAP:XMR is capable of growing to:
➡️ $23B
➡️ or even $80B?
🤔 Share your thoughts — is #Monero ready to surprise the market again?
______________
◆ Follow us ❤️ for daily crypto insights & updates!
🚀 Don’t miss out on important market moves
🧠 DYOR | This is not financial advice, just thinking out loud

XMRUSDT - Another push up… or time for a healthy reality check?Alright, XMR is absolutely trending like a maniac right now.
Strong momentum, clean structure, zero chill.
But let’s be honest — nothing goes up forever. Not even Monero.
What we’re looking for here:
• A retracement within the uptrend, not a trend reversal
• A chance to catch a better entry near the bottom
• Basically: buy fear, not euphoria
This is one of those trades where:
• If it triggers, it might take time
• Levels can shift
• And patience is part of the strategy (unfortunately 😅)
Why this makes sense:
• Similar setup to PIPPIN
• Strong trend intact
• Waiting for a pullback instead of chasing green candles like a tourist
Also — let’s talk black swan energy 🦢:
• If we get a sudden market panic
• Expect nasty wicks
• And yes, that’s actually part of the plan
We’re not predicting chaos — we’re just prepared for it.
So the idea is simple:
👉 Let XMR cool off
👉 Let panic do its thing
👉 Step in on the retracement
👉 Ride the trend continuation (if the market allows it)
This is a slow-cooker trade, not microwave money.
If it sets up, great.
If not — no FOMO, no drama.
Let’s see how it plays out 👀📊

Movement comparisonBitcoin and Monero have approximately the same amount of coins in circulation. Bitcoin has an average of 500,000 transactions daily, while Monero has around 20,000. The Monero ownership centralization is obvious, but not provable.
The two assets have significantly opposite price movement.
The LTCBTC/XMRBTC pair is at the channel top.
The XMRUSD/LTCUSD is retesting long-term support.
The channel has been violated, which possibly means a strong corrective wave in the opposite direction is coming. LTCBTC pair isn't looking great for now, but LTCUSD has been in slow upside movement with quite high usage for payments. The upcoming LitVM hype might have impact on the price, and will be produced by Lunar Digital Assets company in deal with Bitcoin OS and Litecoin Foundation. The LDA is a marketing company and they have made a lot of damage through previous projects thus exercise extreme caution.
The BTCUSD is searching for support on 1W and appears to be completing Elliot five wave impulse, and forming a running flat.
The XMRBTC is at strong long-term resistance, the BTCUSD has more momentum for breakout while grinding at the channel top, and taking under consideration the BTCUSD and XMRBTC are inversed, the BTCUSD seems a better choice for investment at this moment.
However, XMRUSD does seem like it could get a correction, but in smaller magnitude than XMRBTC, thus the XMRUSD price might stay elevated for the period while BTCUSD is in bullish rally.
Furthermore, the BTCUSD versus GOLD is also finding significant support. Countries and private companies are holding the BTCUSD positions. It is possible that in this year people will realize it is easier to keep safe and spend Bitcoin rather than physical gold. Gold appears to be a fear hedge, around 50% of yearly mined gold being used for production of jewelry while around 10% used in electronics production. Silver appreciation is fair. The world will continue further into finance digitalization. Production of physical goods should also get more appreciation in the following years.
Opinion - Good time to move XMR to BTC, even though XMR might make another leg, but less likely.

XMR keeps failing at 450 resistance, is a major breakdown comingYello Paradisers— how many times can XMRUSDT hit the same wall before it collapses for good? The rejection from the 448 to 450 zone is starting to look like more than just noise.
💎XMRUSDT respected an ascending channel for a while but that structure has now clearly broken. The recent breakdown along with an internal CHoCH signals a shift in short-term momentum. The impulsive rejection has cooled off the buyers and the current consolidation just below the broken channel shows that sellers are gaining control while buyers struggle to hold ground.
💎After the breakdown, price made a corrective attempt but was quickly rejected again around the 0.5 to 0.618 Fibonacci retracement area. This zone has now become a supply region and continues to suppress any bullish attempts. As long as price stays under that structure with no strong bullish displacement the bias remains bearish with a likely push toward lower liquidity zones and key support levels.
💎This view changes only if price closes a strong candle above the 450 resistance. That would reclaim the previous range high, cancel the bearish structure shift and signal renewed bullish strength with potential to target higher liquidity above the current range.
🎖Right now is not the time for emotional moves. Stay calm and stay focused. We are only interested in the cleanest and most high probability setups. That is how you win in this game long-term.
MyCryptoParadise
iFeel the success🌴

XMR ready to jump again 16% gain toward 465$Hi the support and resistances on the chart are based on the previous data and weekly candlesticks if KUCOIN:XMRUSDT holds this last support the potential of 16% gain is logical toward 465$

XMR in ascending channel can hit upper targets 14% gain to 400$Hi the support and resistances on the chart are based on the previous data and weekly candlesticks if KUCOIN:XMRUSDT holds this last support the potential of 14% gain is logical toward 400$

XMR Sell/Short Signal (4H)XMR has turned bearish after the change of character (CH) and, following the break of the short-term trendline, has now pulled back to a resistance zone while also sweeping a liquidity pool above the pivots.
With proper risk management and adherence to the stop-loss, this setup can be entered.
Targets are marked on the chart.
A daily candle closing above the invalidation level will negate this analysis.
Do not enter the position without capital management and stop setting
Comment if you have any questions
thank you

XMR/USDT - Rounded Bottom Signals: Breakout New Bullish Cycle?XMR has finally broken out of one of the strongest technical structures on the daily timeframe: a multi-month rounded bottom, a pattern that typically marks the transition from long distribution phases into new bullish cycles.
After establishing a stable base near $235, price has been rising gradually, forming a clean upward curvature that reflects a steady shift from selling pressure toward sustained accumulation. A rounded structure this smooth rarely appears unless buyers have been consistently absorbing supply for a long period.
Now, the market has touched and pierced the major historical resistance at $426, a level that has capped price for months. This breakout validates the pattern and suggests the market is shifting from consolidation into expansion.
The quick spike toward $471 shows aggressive buying interest but also marks this region as a liquidity cluster that will play a crucial role in determining continuation. As long as price holds above the $420–426 rim, buyers maintain full control and the bullish probability remains dominant.
Given the depth of the pattern at roughly $191, the measured breakout target sits around $615–$620, which is structurally reasonable if the breakout is confirmed and $426 flips into reliable support.
---
Pattern Explanation (Clear and In-Depth)
Pattern name: Rounded Bottom / Cup (pure cup, no handle formation).
Formation duration: Multi-month, which increases reliability.
Characteristics: stable bottom, consistent upward curvature, repeated rejections at the same horizontal level → market completing a major accumulation phase.
Breakout confirmation: daily candle closing above the rim → shift in medium-term market structure.
Large rounded bottoms like this are often precursors to trend reversals and are known for initiating strong directional moves.
---
Bullish Scenario (Primary Outlook)
1. Price forms a clean daily close above $426.
2. Ideal retest occurs at $420–430 with lower-wick support and rising volume.
3. If confirmed, continuation targets become:
$471 (local liquidity zone)
$520 (psychological resistance)
$618 (measured move) as the main structural target
4. As long as price holds above the ascending support and does not close below $420, the bullish structure remains intact.
Market narrative: buyers are controlling the tempo, and momentum is transitioning decisively upward.
---
Bearish Scenario (If Breakout Fails)
1. Breakout becomes a false breakout if price closes back below $420.
2. This would expose deeper corrective zones:
$380–400 (ascending support)
$340
$300
Even a return to the base of the pattern in a worst-case scenario
3. Bearish confirmation signals include: low breakout volume, repeated upper-wick rejections, and daily closes below the rim.
Market narrative: buyers lose control, and the asset slips back into prolonged accumulation.
---
Additional Insight
A rounded bottom of this scale is more than a pattern; it often reflects a major shift in market psychology. It typically marks the transition from weak, low-interest conditions to renewed investor engagement. When paired with a breakout at a long-standing resistance, this formation is one of the strongest signals for potential medium-to-long-term trend continuation.
For XMR, the structure shows that selling pressure that dominated earlier in the year has faded, and buyers are beginning to establish a clear advantage.
---
#XMRUSDT #Monero #CryptoAnalysis #RoundedBottom #Breakout #TechnicalAnalysis #PriceAction #MarketStructure #CryptoTrading

XMR -- Phase 2, eyeing a retap of ATH area plus more! SEED now!Monero (XMR) is outperforming other cryptocurrencies and traditional markets, with a 74% year-to-date increase, despite being delisted from major exchanges and banned in the EU. Its strong privacy features, such as untraceable transactions and upcoming updates like FCMP++, make it a preferred choice for financial privacy. Monero is widely used in peer-to-peer commerce, including dark web transactions and emerging marketplaces. Its growing adoption highlights its role as a private, decentralized alternative to traditional financial systems.
Based on recent metrics, XMR has been showing some decoupling behavior from the crypto space bringing forth a sense of price independence from the market.
Recent long term data is hinting of another basing season which hints of another accumulation period -- an impending round of growth season ahead.
We are currently on Phase 2 of this higher base shift at current price of 290.0. Phase 1 started from early 2024 on Q1 when it tapped the lows of 99.0 and went parabolic to tap the 400 zone early 2025 (12 months after). As with any overheated parabolic move, the coin was met with strong profit taking -- undergoing an extended corrective season and finally settling at the 200 range.
Now, based on recent metrics -- XMR is now ripe for another round of growth series from here on, targeting a retap of previous peak at 420 -- and eventually the ATH zone at 517.60.
Ideal seeding period is now. Based on our diagram -- discount darvas meter has been activated. Meaning, current pricing is now at bargain levels and price growth is expected from here on as we more forward.
Spotted at 290.
Interim target at previous peak 420.
Long term - ATH at 517 / then beyond at 800-1k levels.
TAYOR.
Trade safely always.

$XMR About to Rip? — Hold $420 and We Fly📊 XMR Price Update | Breakout Watch
Monero (XMR) is trading above minor resistance, showing early signs of renewed strength.
The key level to watch is $420 — a clean hold above this zone could signal the start of another leg up in the current move.
🔹 Key Levels:
Immediate Support: $420 – needs to hold for momentum continuation
Next Resistance Targets: $448 → $472 → $495
Invalidation: Drop back below $410 would weaken the setup
🔸 Outlook:
Momentum is shifting bullish as price consolidates above resistance. Sustained closes over $420 may invite breakout traders and trigger fresh buying interest.
If volume picks up, XMR could easily extend toward the $470–$490 zone in the next impulse.
🧭 Strategy:
Look for confirmation candles and volume expansion above $420 before adding exposure. Dips toward $420 may offer good re-entry opportunities as long as structure stays intact.
⚡ Suggested Catchy Titles:
“XMR Breaking Out — $420 Hold Could Ignite the Next Rally 🚀”
“Monero Waking Up: $420 Is the Key to the Next Leg Up”
“XMR Bulls Back in Control — Watch $420 for the Breakout!”

Monero’s Glow — While Markets SlowI’ve mentioned in my previous publications that Monero looks stronger than the overall market.
It feels like Bitcoin’s correction doesn’t affect it at all, even though I canceled my previous plan (despite the price not reaching my invalidation zone), because sometimes certain details on the chart raise doubts and make me reconsider my decisions. But that’s exactly how I manage my risks and avoid losses.
After reviewing my analysis again, it seems that Monero is heading toward 365.
I’m also still following my scenario marked by the orange line from one of my earlier publications on this coin.
❌ Plan invalidation level: marked on the chart with a red line at 342.90.
⚠️ Disclaimer:
This is not financial advice or a trading signal.
Always make your own decisions and never trade without a stop-loss.
