Monero Price Action Report — Breakout Strength and Target ZoneXMR/USDT Bullish Breakout Blueprint! 🚀📈 (Swing & Day Trade Plan)
Description:
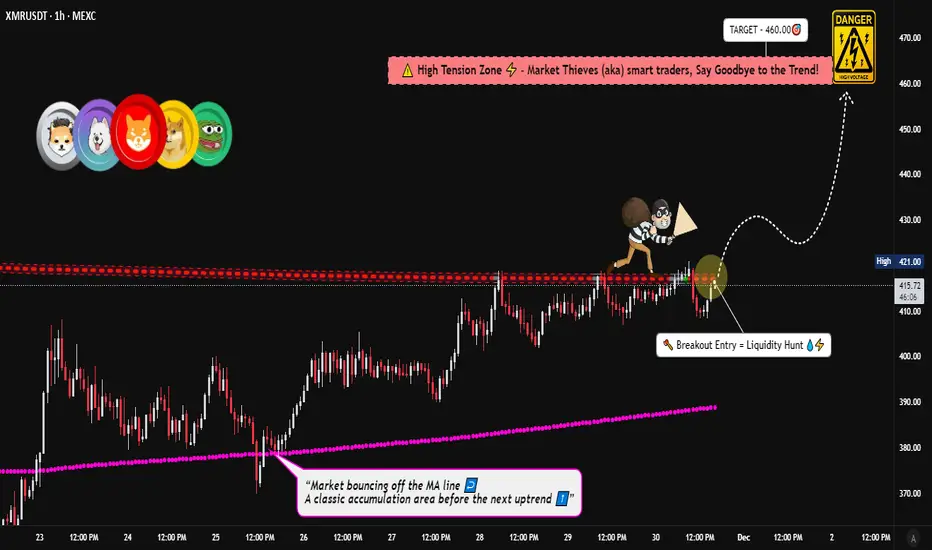
Monero is awakening! 🦋 A dynamic breakout is in play, offering a clear technical setup for both swing and day traders. Here’s your professional blueprint to navigate this opportunity.
📊 Trading Thesis: Bullish Breakout
The setup is confirmed by a breakout above the key Weighted Moving Average (WMA) dynamic resistance near 420.00. This signals a potential shift in momentum and opens the door for a bullish move.
🎯 Execution Plan
🟢 Entry Zone: Any price AFTER a confirmed breakout & close above 420.00. Look for a retest of the WMA as support for an optimal risk-reward entry.
⛔ Stop Loss (Risk Management): A logical stop loss can be placed below 390.00, which is under the recent support and WMA structure.
⚠️ Disclaimer: This is my suggested SL based on my strategy. You MUST adjust your position size and stop loss based on your own risk tolerance and capital. Always wait for breakout confirmation before placing your SL.
🎯 Profit Target (Take Profit): Our primary target is the 460.00 zone. This area represents a strong historical resistance level and could coincide with overbought conditions. Secure your profits proactively!
💡 Professional Note: This is my initial target. You are free to take partial profits earlier or trail your stop. "Make money, then take money" – manage your trade actively!
🔍 Key Levels & Rationale
Bullish Trigger: WMA Breakout > 420.00
Invalidation Level: < 390.00 (Bullish structure broken)
Target Zone: 460.00 (Major Resistance & Profit-Taking Zone)
🌐 Related Pairs & Market Correlations
Diversify your watchlist! The crypto market is highly correlated. Movements in XMR often relate to these assets:
CRYPTOCAP:BTC.D (Bitcoin Dominance): 📉 A decrease in BTC.D often fuels altcoin rallies, which is bullish for XMR.
BTC/USDT: 👑 The King leads, alts follow. A strong, stable, or rising Bitcoin is generally positive for the entire crypto market, including Monero.
Privacy Coin Sector:
CRYPTOCAP:ZEC (Zcash) & NASDAQ:DASH 📊
Key Point: Watch these for sector-wide momentum. A bullish move in XMR is often mirrored in other major privacy coins, confirming a sector trend.
Major Alts:
ETH/USDT 💙 & XRP/USDT ⚡
Key Point: Strength in large-cap alts like ETH and XRP creates a risk-on environment, which is beneficial for mid-cap coins like Monero.
✅ Final Checklist Before Entering:
✅ Breakout & close above WMA (420) confirmed?
✅ Volume supporting the move?
✅ SL set according to MY risk management?
✅ Related pairs (BTC, ETH) showing strength?
Let me know your thoughts in the comments! 💬 Are you bullish or bearish on XMR?
Like & Follow 👍 for more high-quality, actionable trade ideas!
#TradingView #XMR #Monero #Crypto #SwingTrading #DayTrading #TechnicalAnalysis #Breakout #WMA #BTC #Altcoins #DeFi
Xmrusdtlong
XMR/USDT - Rounded Bottom Signals: Breakout New Bullish Cycle?XMR has finally broken out of one of the strongest technical structures on the daily timeframe: a multi-month rounded bottom, a pattern that typically marks the transition from long distribution phases into new bullish cycles.
After establishing a stable base near $235, price has been rising gradually, forming a clean upward curvature that reflects a steady shift from selling pressure toward sustained accumulation. A rounded structure this smooth rarely appears unless buyers have been consistently absorbing supply for a long period.
Now, the market has touched and pierced the major historical resistance at $426, a level that has capped price for months. This breakout validates the pattern and suggests the market is shifting from consolidation into expansion.
The quick spike toward $471 shows aggressive buying interest but also marks this region as a liquidity cluster that will play a crucial role in determining continuation. As long as price holds above the $420–426 rim, buyers maintain full control and the bullish probability remains dominant.
Given the depth of the pattern at roughly $191, the measured breakout target sits around $615–$620, which is structurally reasonable if the breakout is confirmed and $426 flips into reliable support.
---
Pattern Explanation (Clear and In-Depth)
Pattern name: Rounded Bottom / Cup (pure cup, no handle formation).
Formation duration: Multi-month, which increases reliability.
Characteristics: stable bottom, consistent upward curvature, repeated rejections at the same horizontal level → market completing a major accumulation phase.
Breakout confirmation: daily candle closing above the rim → shift in medium-term market structure.
Large rounded bottoms like this are often precursors to trend reversals and are known for initiating strong directional moves.
---
Bullish Scenario (Primary Outlook)
1. Price forms a clean daily close above $426.
2. Ideal retest occurs at $420–430 with lower-wick support and rising volume.
3. If confirmed, continuation targets become:
$471 (local liquidity zone)
$520 (psychological resistance)
$618 (measured move) as the main structural target
4. As long as price holds above the ascending support and does not close below $420, the bullish structure remains intact.
Market narrative: buyers are controlling the tempo, and momentum is transitioning decisively upward.
---
Bearish Scenario (If Breakout Fails)
1. Breakout becomes a false breakout if price closes back below $420.
2. This would expose deeper corrective zones:
$380–400 (ascending support)
$340
$300
Even a return to the base of the pattern in a worst-case scenario
3. Bearish confirmation signals include: low breakout volume, repeated upper-wick rejections, and daily closes below the rim.
Market narrative: buyers lose control, and the asset slips back into prolonged accumulation.
---
Additional Insight
A rounded bottom of this scale is more than a pattern; it often reflects a major shift in market psychology. It typically marks the transition from weak, low-interest conditions to renewed investor engagement. When paired with a breakout at a long-standing resistance, this formation is one of the strongest signals for potential medium-to-long-term trend continuation.
For XMR, the structure shows that selling pressure that dominated earlier in the year has faded, and buyers are beginning to establish a clear advantage.
---
#XMRUSDT #Monero #CryptoAnalysis #RoundedBottom #Breakout #TechnicalAnalysis #PriceAction #MarketStructure #CryptoTrading

Monero’s Glow — While Markets SlowI’ve mentioned in my previous publications that Monero looks stronger than the overall market.
It feels like Bitcoin’s correction doesn’t affect it at all, even though I canceled my previous plan (despite the price not reaching my invalidation zone), because sometimes certain details on the chart raise doubts and make me reconsider my decisions. But that’s exactly how I manage my risks and avoid losses.
After reviewing my analysis again, it seems that Monero is heading toward 365.
I’m also still following my scenario marked by the orange line from one of my earlier publications on this coin.
❌ Plan invalidation level: marked on the chart with a red line at 342.90.
⚠️ Disclaimer:
This is not financial advice or a trading signal.
Always make your own decisions and never trade without a stop-loss.

Orange Path to Glory – Monero’s 420 StoryTwo possible routes are shown on the Monero chart, yet both tell one story — the road to 420.
❌The invalidation zone is highlighted in red at 318,74.
💭 From here, I’m expecting more likely a move down to 324-330 first, before we see Monero shining at 420. That’s the move along the orange arrow.
I’m expecting more of a downside first, only then a strong move upward. Let’s see what the chart will show us.
This is not financial advice — everyone should manage their own risks

XMRUSDT.PMEXC:XMRUSDT.P BUY
EN: 143.53 / 140.83
Sl: 136.33
TP1: 219.63
TP2: 288.93
RR: 1:20
Entry type: Limit Order!
Not a financial advice, DYOR!

XMRUSD MONERO Long Bullish can go to 190 USDAccording to our current Monero price prediction, the value of Monero is predicted to drop by -2.32% and reach $ 164.17 by July 6, 2023. According to our technical indicators, the current sentiment is Bullish while the Fear & Greed Index is showing 59 (Greed). Monero recorded 21/30 (70%) green days with 7.04% price volatility over the last 30 days. Based on our Monero forecast, it's now a good time to buy Monero.
Based on data from July 01, 2023 at 20:43, the general Monero price prediction sentiment is bullish with 25 technical analysis indicators signaling bullish signals, and 8 signaling bearish signals.
Technical Analysis Bullish
1 Monero makes 3 weeks Higher Lows and Higher Highs
2 Trend continuation Confirmation RSI
See Circles
10 Nov 2022
9th March 2022
10th June 2022
3 RSI is above 50
4 Rsi confirmation is Bullish
5 Volume is increasing Bullish
6 We have rising POCs
7 Volume Value has been shifting higher
8 Monero is currently trading above the 200-day simple moving average (SMA). The 200-day SMA has been signaling BUY for the last 8 days, since Jun 23, 2023.
The price of Monero is currently above the 50-day SMA and this indicator has been signaling BUY for the last 9 days, since Jun 22, 2023.
The most recent Death Cross in the Bitcoin market happened 30 days ago, on Jun 01, 2023. Meanwhile, a Golden Cross last occurred on Jan 09, 2023, which was 173 days ago.
Based on our technical indicators, Monero's 200-day SMA will rise in the next month and will hit $ 153.22 by Jul 31, 2023. Monero's short-term 50-Day SMA is estimated to hit $ 159.61 by Jul 31, 2023.
The Relative Strength Index (RSI) momentum oscillator is a popular indicator that signals whether a cryptocurrency is oversold (below 30) or overbought (above 70). Currently, the RSI value is at 74.32, which indicates that the XMR market is in a overbought position. The RSI indicator suggests that the price of XMR will increase.
Monero reached its highest price on Jan 9, 2018 when it was trading at its all-time high of $ 593.42, while Monero's lowest price was recorded on Jan 14, 2015 when it was trading at its all-time low of $ 0.212967. The lowest price since it's ATH was $ 26.23 (cycle low). The highest XMR price since the last cycle low was $ 514.43 (cycle high). The Monero price prediction sentiment is currently bullish, while Fear & Greed Index is showing 59 (Greed).
Monero's current circulating supply is 18.30M XMR out of max supply of 18.20M XMR. The current yearly supply inflation rate is 0.86% meaning 156,872 XMR were created in the last year. In terms of market cap, Monero is currently ranked #5 in the Proof-of-Work Coins sector, ranked #1 in the Privacy Coins sector and ranked #15 in the Layer 1 sector.
Highlights
Price has increased by 48% in the last 1 year
Outperformed 79% of the top 100 crypto assets in 1 year
Trading above the 200-day simple moving average
21 green days in the last 30 days (70%)
Trading on Binance
Trading with Euro
Yearly inflation rate is 0.86%
Monero price in US Dollar has increased by 13.08% in the last 1 month. XMR is up 10.29% against Ethereum and down -0.47% against Bitcoin in the last 1 month.
The top-performing year for Monero was 2016 when the price of XMR increased by 2,830.22% from $ 0.470402 to $ 13.78. The worst performing year for Monero was 2018 when the price dropped by -86.72% from $ 349.16 to $ 46.38. The average yearly growth of Monero over the last 10 years is 595.55% per year. Usually, Monero performs best in Q3 with an average of 59.43% gain and worst in Q2 with 11.17% gain.
Risk Analysis
Outperformed by Bitcoin and Ethereum
Down -72% from all-time high
Has medium liquidity based on its market cap
How is the price positioned in comparison to the all-time high?
The price is currently down -72% from the all-time high.
How is the price positioned in comparison to the cycle high/low?
Monero is currently trading at -67.40% below cycle high and 539.17% above cycle low.
Is the price highly volatile?
The 30-day volatility is above 30% and is currently at null%
Does it have enough liquidity based on market cap to volume ratio?
Has medium liquidity with 0.0282 volume to market cap ratio. The current market cap is $ 3.07B while the 24-hour volume is $ 86.46M
Is the total supply high in comparison with the circulating supply?
Over 101% of the total supply is in circulation.
Is the current inflation below 2% per year?
The yearly inflation rate is 0.86% meaning there were 156,872 coins generated in the last 1 year.
According to our current Monero price prediction, the value of Monero is predicted to drop by -2.32% and reach $ 164.17 by July 6, 2023. According to our technical indicators, the current sentiment is Bullish while the Fear & Greed Index is showing 59 (Greed). Monero recorded 21/30 (70%) green days with 7.04% price volatility over the last 30 days. Based on our Monero forecast, it's now a good time to buy Monero.
Comparing Monero against other important technological innovations and trends is one way of predicting where the Monero price could head over the long term. The table above shows what the Monero price would be by end of year 2024, 2025, and 2026 if its growth trajectory followed the growth of the internet, or large tech companies like Google and Facebook in their growth phase.
In the best case scenario, XMR price prediction for year 2026 is $ 3,836.33 if it follows Facebook growth. In case Monero would follow Internet growth the prediction for 2026 would be $ 440.09.
Monero Key Price Levels
Based on today's classical pivot point (P1) with the value of $ 166.97, Monero has support levels of $ 164.34, $ 160.29, and the strongest at $ 157.66. Similarly, Monero resistance levels are at $ 171.02, $ 173.65, and $ 177.70..
Monero Correlation
Over the past 7 days, Monero price was most positively correlated with the price of TRON (TRX), Stellar (XLM), Bitcoin Cash (BCH), Zcash (ZEC) and Bitcoin SV (BSV) and most negatively correlated with the price of XRP (XRP), OKB (OKB), Cardano (ADA), NEM (XEM) and Binance Coin (BNB).
Monero price is positively correlated with the top 10 coins by marketcap with a value of 0.119, excluding Tether (USDT) and positively correlated with the top 100 coins by marketcap excluding all stablecoins with a value of 0.107.
Currencies that are positively correlated with Monero indicate that the movement of one has a statistically significant weight to lead the other in the same direction. For currencies that are negatively correlated with Monero, a move in one direction for Monero would translate into a move in the opposite direction for the negatively correlated coin.
Monero Price Forecast(Probability 69%) This is just a mathematical methode to trade my own accont, Okease note that it is for educational and informative issue, and you should use stops and proper risk and money mangemnt to protect your capital.
Date Price Change
Jul 2, 2023 $ 168.17 0.06%
Jul 3, 2023 $ 169.11 0.62%
Jul 4, 2023 $ 171.83 2.24%
Jul 5, 2023 $ 170.25 1.30%
Jul 6, 2023 $ 164.17 -2.32%
Jul 7, 2023 $ 170.84 1.65%
Jul 8, 2023 $ 166.89 -0.70%
Jul 9, 2023 $ 165.08 -1.78%
Jul 10, 2023 $ 151.52 -9.85%
Jul 11, 2023 $ 158.89 -5.46%
Jul 12, 2023 $ 157.76 -6.13%
Jul 13, 2023 $ 160.38 -4.57%
Jul 14, 2023 $ 155.57 -7.43%
Jul 15, 2023 $ 151.87 -9.63%
Jul 16, 2023 $ 156.14 -7.10%
Jul 17, 2023 $ 155.08 -7.73%
Jul 18, 2023 $ 155.62 -7.40%
Jul 19, 2023 $ 157.16 -6.49%
Jul 20, 2023 $ 156.53 -6.86%
Jul 21, 2023 $ 164.10 -2.36%
Jul 22, 2023 $ 165.61 -1.46%
Jul 23, 2023 $ 169.10 0.62%
Jul 24, 2023 $ 175.47 4.41%
Jul 25, 2023 $ 176.17 4.83%
Jul 26, 2023 $ 179.92 7.06%
Jul 27, 2023 $ 185.74 10.52%
Jul 28, 2023 $ 190.11 13.12%
Jul 29, 2023 $ 183.07 8.93%
Jul 30, 2023 $ 187.35 11.48%
Jul 31, 2023 $ 187.86 11.78%

XMR/USDT - Monero: Resistance_Breakout_Confirmation◳◱ A Resistance Breakout and Confirmation has been detected on the $XMR / $USDT chart. The price has broken above a key resistance level and has been confirmed by a strong candle, indicating a potential bullish trend. The next resistance key levels are located at 160.5 | 167.8 | 184.2, and the major support zones can be found at 144.1 | 135 | 118.6. Consider entering a trade at the current price zone of 160.1 and targeting higher levels.
◰◲ General info :
▣ Name: Monero
▣ Rank: 25
▣ Exchanges: Binance, Kucoin, Bybit, Huobipro, Gateio, Poloniex
▣ Category/Sector: Payments - Currencies
▣ Overview: Aimed at privacy-preservation and fungibility, Monero is a Bytecoin code fork providing anonymous value transfer through ring signatures, stealth addresses, confidential transactions, and bulletproofs. Monero offers anonymity by default in contrast to the optional privacy preserving functionalities of its peers. In pursuit of decentralization Monero continually changes its proof-of-work algorithm in order to prevent ASICs from dominating and centralizing the mining process.
◰◲ Technical Metrics :
▣ Mrkt Price: 160.1 ₮
▣ 24HVol: 21,226,745.269 ₮
▣ 24H Chng: 4.777%
▣ 7-Days Chng: 3.18%
▣ 1-Month Chng: 0.75%
▣ 3-Months Chng: 10.72%
◲◰ Pivot Points - Levels :
◥ Resistance: 160.5 | 167.8 | 184.2
◢ Support: 144.1 | 135 | 118.6
◱◳ Indicators recommendation :
▣ Oscillators: NEUTRAL
▣ Moving Averages: STRONG_BUY
◰◲ Technical Indicators Summary : BUY
◲◰ Sharpe Ratios :
▣ Last 30D: -0.70
▣ Last 90D: 0.75
▣ Last 1-Y: 0.12
▣ Last 3-Y: 0.83
◲◰ Volatility :
▣ Last 30D: 0.53
▣ Last 90D: 0.51
▣ Last 1-Y: 0.78
▣ Last 3-Y: 0.95
◳◰ Market Sentiment Index :
▣ News sentiment score is N/A
▣ Twitter sentiment score is 0.55 - Bullish
▣ Reddit sentiment score is 0.63 - Bullish
▣ In-depth XMRUSDT technical analysis on Tradingview TA page
▣ What do you think of this analysis? Share your insights and let's discuss in the comments below. Your like, follow and support would be greatly appreciated!
◲ Disclaimer
Please note that the information and publications provided are for informational purposes only and should not be construed as financial, investment, trading, or any other type of advice or recommendation. We encourage you to conduct your own research and consult with a qualified professional before making any financial decisions. The use of the information provided is solely at your own risk.
▣ Welcome to the home of charting big: TradingView
Benefit from a ton of financial analysis features, instruments and data. Have a look around, and if you do choose to go with an upgraded plan, you'll get up to $30.
Discover it here - affiliate link -

$XMR/#USDT [#Monero]: Resistance_Breakout_Confirmation◳◱ A Resistance Breakout and Confirmation has been detected on the $XMR / $USDT chart. The price has broken above a key resistance level and has been confirmed by a strong candle, indicating a potential bullish trend. The next resistance key levels are located at 159.7 | 169.6 | 193.3, and the major support zones can be found at 136 | 122.2 | 98.5. Consider entering a trade at the current price zone of 148.6 and targeting higher levels.
◰◲ General info :
▣ Name: Monero
▣ Rank: 26
▣ Exchanges: Binance, Kucoin, Bybit, Huobipro, Gateio, Poloniex
▣ Category/Sector: Payments - Currencies
▣ Overview: Aimed at privacy-preservation and fungibility, Monero is a Bytecoin code fork providing anonymous value transfer through ring signatures, stealth addresses, confidential transactions, and bulletproofs. Monero offers anonymity by default in contrast to the optional privacy preserving functionalities of its peers. In pursuit of decentralization Monero continually changes its proof-of-work algorithm in order to prevent ASICs from dominating and centralizing the mining process.
◰◲ Technical Metrics :
▣ Mrkt Price: 148.6 ₮
▣ 24HVol: 12,468,463.506 ₮
▣ 24H Chng: 1.157%
▣ 7-Days Chng: 4.87%
▣ 1-Month Chng: -5.88%
▣ 3-Months Chng: 5.06%
◲◰ Pivot Points - Levels :
◥ Resistance: 159.7 | 169.6 | 193.3
◢ Support: 136 | 122.2 | 98.5
◱◳ Indicators recommendation :
▣ Oscillators: SELL
▣ Moving Averages: STRONG_BUY
◰◲ Technical Indicators Summary : BUY
◲◰ Sharpe Ratios :
▣ Last 30D: -0.97
▣ Last 90D: 0.34
▣ Last 1-Y: 0.13
▣ Last 3-Y: 0.84
◲◰ Volatility :
▣ Last 30D: 0.55
▣ Last 90D: 0.50
▣ Last 1-Y: 0.78
▣ Last 3-Y: 0.96
◳◰ Market Sentiment Index :
▣ News sentiment score is N/A
▣ Twitter sentiment score is 0.55 - Bullish
▣ Reddit sentiment score is 0.79 - V. Bullish
▣ In-depth XMRUSDT technical analysis on Tradingview TA page
▣ What do you think of this analysis? Share your insights and let's discuss in the comments below. Your like, follow and support would be greatly appreciated!
◲ Disclaimer
Please note that the information and publications provided are for informational purposes only and should not be construed as financial, investment, trading, or any other type of advice or recommendation. We encourage you to conduct your own research and consult with a qualified professional before making any financial decisions. The use of the information provided is solely at your own risk.
▣ Welcome to the home of charting big: TradingView
Benefit from a ton of financial analysis features, instruments and data. Have a look around, and if you do choose to go with an upgraded plan, you'll get up to $30.
Discover it here - affiliate link -

XMRUSDT Elliott Waves AnalysisHello friends.
Please support my work by clicking the LIKE button👍(If you liked). Also i will appreciate for ur activity. Thank you!
Everything on the chart. (update)
Nothing has changed from my last idea, everything according plan
Earlier we got first target, my stop already in breakeven(140)
Next targets: 210 and 230
Good luck everyone!
Follow me on TRADINGView, if you don't want to miss my next analysis or signals.
It's not financial advice.
Dont Forget, always make your own research before to trade my ideas!
Open to any questions and suggestions.

$XMR/#USDT [#Monero]: Resistance_Breakout_Confirmation◳◱ A Resistance Breakout and Confirmation has been detected on the $XMR / $USDT chart. The price has broken above a key resistance level and has been confirmed by a strong candle, indicating a potential bullish trend. The next resistance key levels are located at 165.2 | 179.1 | 203.1, and the major support zones can be found at 141.2 | 131.1 | 107.1. Consider entering a trade at the current price zone of 151 and targeting higher levels.
◰◲ General info :
▣ Name: Monero
▣ Rank: 28
▣ Category/Sector: Payments - Currencies
▣ Overview: Background details for N/A project are currently unavailable.
◰◲ Technical Metrics :
▣ Mrkt Price: 151 ₮
▣ 24HVol: 8,009,270.088 ₮
▣ 24H Chng: 1.274%
▣ 7-Days Chng: -7.10%
▣ 1-Month Chng: -18.44%
▣ 3-Months Chng: 9.44%
◲◰ Pivot Points - Levels :
◥ Resistance: 165.2 | 179.1 | 203.1
◢ Support: 141.2 | 131.1 | 107.1
◱◳ Indicators recommendation :
▣ Oscillators: NEUTRAL
▣ Moving Averages: BUY
◰◲ Technical Indicators Summary : BUY
◲◰ Sharpe Ratios :
▣ Last 30D: -2.79
▣ Last 90D: 1.04
▣ Last 1-Y: 0.39
▣ Last 3-Y: 0.62
◲◰ Volatility :
▣ Last 30D: 0.56
▣ Last 90D: 0.45
▣ Last 1-Y: 0.85
▣ Last 3-Y: 0.99
◳◰ Market Sentiment Index :
▣ News sentiment score is 0.63 - Bullish
▣ Twitter sentiment score is 0.59 - Bullish
▣ Reddit sentiment score is 0.21 - Very Bearish
▣ In-depth XMRUSDT technical analysis on Tradingview TA page
▣ What do you think of this analysis? Share your insights and let's discuss in the comments below. Your like, follow and support would be greatly appreciated!
◲ Disclaimer
Please note that the information and publications provided are for informational purposes only and should not be construed as financial, investment, trading, or any other type of advice or recommendation. We encourage you to conduct your own research and consult with a qualified professional before making any financial decisions. The use of the information provided is solely at your own risk.
▣ Welcome to the home of charting big: TradingView
Benefit from a ton of financial analysis features, instruments and data. Have a look around, and if you do choose to go with an upgraded plan, you'll get up to $30.
Discover it here - affiliate link -


🟢 XMR USDT - 4H (04/02/2023)🟢 XMRUSDT
TF: 4H
Side: Long
TP 1: $174.22
TP 2: $176.67
TP 3: $178.65
Absolute beauty! Gorgeous looking bull flag on the 4H time frame. When this pops its gonna be awesome.
Not using SL as usual on this swing trade so I can DCA and get the best possible entry for my position.
RSI and MACD look ready. LTFs just need to sync up a bit.

XMRUSDT Elliott Waves AnalysisHello friends.
Please support my work by clicking the LIKE button👍(If you liked). Also i will appreciate for ur activity. Thank you!
Everything on the chart. (update)
Entry: market and lower
Target: 165 - 195 - 230
Main target zone: 220 - 250
after first target reached move ur stop to breakeven
Stop: ~115 (depending of ur risk). ALWAYS follow ur RM .
Risk/Reward: 1 to 5
risk is justified
Good luck everyone!
Follow me on TRADINGView, if you don't want to miss my next analysis or signals.
It's not financial advice.
Dont Forget, always make your own research before to trade my ideas!
Open to any questions and suggestions.

XMRUSDT Elliott Waves AnalysisHello friends.
Please support my work by clicking the LIKE button👍(If you liked). Also i will appreciate for ur activity. Thank you!
Everything on the chart. (update)
Entry: market and lower
Target: 165 - 195 - 230
Main target zone: 220 - 250
after first target reached move ur stop to breakeven
Stop: ~99 (depending of ur risk). ALWAYS follow ur RM .
Risk/Reward: 1 to 3.5
risk is justified
Good luck everyone!
Follow me on TRADINGView, if you don't want to miss my next analysis or signals.
It's not financial advice.
Dont Forget, always make your own research before to trade my ideas!
Open to any questions and suggestions.

XMRUSDT Elliott Waves AnalysisHello friends.
Please support my work by clicking the LIKE button👍(If you liked). Also i will appreciate for ur activity. Thank you!
Everything on the chart.
Entry: market and lower
Target: 195 and ~250
after first target reached move ur stop to breakeven
Stop: ~99 (depending of ur risk). ALWAYS follow ur RM .
Risk/Reward: 1 to 3
risk is justified
Good luck everyone!
Follow me on TRADINGView, if you don't want to miss my next analysis or signals.
It's not financial advice.
Dont Forget, always make your own research before to trade my ideas!
Open to any questions and suggestions.

#XMRUSDT Trade setup: Bullish breakout from Ascending triangle (above $150 resistance zone). Price could swing to near $180 resistance where it got rejected a few times in August. (set a price alert)
Pattern: Ascending Triangle which is a continuation pattern (it typically breaks out in the direction of existing trend). Most traders wait for a breakout but Swing traders could trade between the trendlines (Buy at Support, Sell at Resistance) as long as the trendlines are still relatively far apart.
Trend: Uptrend on Short-Term basis, Neutral on Medium-Term basis and Downtrend on Long-Term basis.
Momentum is Bullish ( MACD Line is above MACD Signal Line and RSI is above 55).
OBV (On Balance Volume): is rising, indicating that volume on Up days is greater than volume on Down days. Hence, demand (buyers) exceeds supply (sellers).
Support and Resistance: Nearest Support Zone is $130, then $100. The nearest Resistance Zone is $150, which it broke, then $175, and $200

💡Don't miss the great buy opportunity in XMRUSD @moneroTrading suggestion:
". There is a possibility of temporary retracement to the suggested support line (144.8).
. if so, traders can set orders based on Price Action and expect to reach short-term targets."
Technical analysis:
. XMRUSDT is in a range bound, and the beginning of an uptrend is expected.
. The price is above the 21-Day WEMA, which acts as a dynamic support.
. The RSI is at 62.
Take Profits:
TP1= @ 148.8
TP2= @ 153.3
TP3= @ 157.1
TP4= @ 161.3
TP5= @ 164.0
SL= Break below S2
❤️ If you find this helpful and want more FREE forecasts in TradingView
. . . . . Please show your support back,
. . . . . . . . Hit the 👍 LIKE button,
. . . . . . . . . . Drop some feedback below in the comment!
❤️ Your support is very much 🙏 appreciated!❤️
💎 Want us to help you become a better Forex / Crypto trader?
Now, It's your turn!
Be sure to leave a comment; let us know how you see this opportunity and forecast.
Trade well, ❤️
ForecastCity English Support Team ❤️

💡Don't miss the great buy opportunity in XMRUSD @moneroTrading suggestion:
". There is a possibility of temporary retracement to the suggested support line (144.8).
. if so, traders can set orders based on Price Action and expect to reach short-term targets."
Technical analysis:
. XMRUSDT is in a range bound, and the beginning of an uptrend is expected.
. The price is above the 21-Day WEMA, which acts as a dynamic support.
. The RSI is at 62.
Take Profits:
TP1= @ 148.8
TP2= @ 153.3
TP3= @ 157.1
TP4= @ 161.3
TP5= @ 164.0
SL= Break below S2
❤️ If you find this helpful and want more FREE forecasts in TradingView
. . . . . Please show your support back,
. . . . . . . . Hit the 👍 LIKE button,
. . . . . . . . . . Drop some feedback below in the comment!
❤️ Your support is very much 🙏 appreciated! ❤️
💎 Want us to help you become a better Forex / Crypto trader ?
Now, It's your turn !
Be sure to leave a comment; let us know how you see this opportunity and forecast.
Trade well, ❤️
ForecastCity English Support Team ❤️

💡Don't miss the great buy opportunity in XMRUSD @moneroTrading suggestion:
". There is a possibility of temporary retracement to the suggested support line (226.7).
. if so, traders can set orders based on Price Action and expect to reach short-term targets."
Technical analysis:
. XMRUSDT is in an uptrend, and the continuation of the uptrend is expected.
. The price is above the 21-Day WEMA, which acts as a dynamic support.
. The RSI is at 62.
Take Profits:
TP1= @ 249.9
TP2= @ 264.9
TP3= @ 276.6
TP4= @ 293.5
TP5= @ 309.9
SL= Break below S2
❤️ If you find this helpful and want more FREE forecasts in TradingView
. . . . . Please show your support back,
. . . . . . . . Hit the 👍 LIKE button,
. . . . . . . . . . Drop some feedback below in the comment!
❤️ Your support is very much 🙏 appreciated!❤️
💎 Want us to help you become a better Forex / Crypto trader?
Now, It's your turn!
Be sure to leave a comment; let us know how you see this opportunity and forecast.
Trade well, ❤️
ForecastCity English Support Team ❤️

XMR (Monero) Swing Long 30% Profit For those who have entered this $XMR trade, congrats! I have now added 7 TP Points labeled next to the Fibonacci levels. Of course, you book some profits now if you'd like and do expect a little price movement to retest previous levels.
I suggest that you do move your SL tighter to the entry or even in front of the entry zone.
The 20 EMA has crossed over the 50 EMA on the daily chart and with this momentum, we should see the 20 EMA breakthrough over the 200 EMA which would indicate a price movement up to the take-profit zones I have placed on this updated chart!
I will reiterate, expect the price action to come back down a little before we continue to take off.

XMR is super Bullish!!!!!!!!! 30 MINXMR Broke out of the descending channel and retested it yesterday. The 10 day ema is about to cross the 30 day ema from the bottom, What does this mean:
Hand me my Lightsaber.

Monero Cup & Candle Potential 🦬 💥 🦬 Hi everyone 👋🏽
🕊 Wish y'all have a profitable lifestyle 🍀
📌 XMR /USDT - WEEKLY Tme-Frame - Heiken Ashi
📌 Fibonacci Channel - CUP and CANDLE Pattern - Cycles
📍MONERO / USDT is looking so bullish based on its possible cup and candle pattern along with cycles it has made
📍Monero is a privacy coin which is one of favorite of those who value their privacy and anonymity
✍🏼 In daily time frame we have created a very precise triangle which I am going to share in the next comment, with breaking this triangle it could be really a good opportunity to have Monero in our bags :)
✍🏼 RSI is in a great position (near 50) in weekly time frame
TO BE CONTINUED

XMRUSDT BUY IDEAXMRUSDT has finally reached the support area of 220.07 (4 Hour chart) and the trend line support also held the price which gave me a confirmation bulls coming in.
