XRP RoadMap (1D)Let's take a look at Ripple to see what fluctuations it may experience over the next month or two.
We considered the upward move in 2024 as Wave A, the following correction as Wave B, and the third rise as a terminal 5-wave structure.
The sharp downward move is considered a post-pattern terminal, and now the waves we are in are regarded as a bearish cycle, forming an expanding/diametric/symmetrical triangle.
Whatever the larger pattern is, in aggregation it seems that the price will move downward from the red zone to the short-term targets marked on the chart.
The targets are marked on the chart.
A daily candle closing above the invalidation level will invalidate this analysis
For risk management, please don't forget stop loss and capital management
When we reach the first target, save some profit and then change the stop to entry
Comment if you have any questions
Thank You
Xrpanalysis

Ripple: Downtrend ContinuesRipple’s XRP has continued its downward trajectory, further developing the blue bearish structure we primarily anticipate. This move is expected to ultimately bring XRP into the green Target Zone between $1.03 and $0.38, where the larger turquoise wave B is projected to complete. We still assign a 30% probability to the alternative scenario in which turquoise wave alt.B has already finished. This alternative could be confirmed if XRP breaks above the resistance levels at $3.19 and $4.09.

FireHoseReel | XRP Breaks Key Support, Eyes $1.99 Next🔥 Welcome To FireHoseReel !
Let’s jump into Ripple (XRP) market analysis.
👀 XRP 4H Overview
Compared to most coins in the market, XRP has experienced a sharper sell-off. Based on chart data, it has now broken its dynamic support and is currently moving toward the next dynamic support around $1.9928.
📊 Volume Analysis
XRP volume has declined due to the holiday period, so we rely more on past reactions. Previously, price attempted to defend this zone and bounce higher. This time, however, the level has been broken with a strong sell-off candle.
✍️ XRP Trading Scenarios
🟢 Long Scenario:
A breakout above the local high at $2.2454, supported by strong buying volume, could trigger a sharp upside move.
🔴 Short Scenario:
At the moment, a stop can be defined above the previous 4H candle. For a safer entry, wait for a reaction at $1.9928—if this support breaks with selling pressure, a short setup becomes valid.
🧠 Protect your capital first. No setup is worth blowing your account. If risk isn’t controlled, profit means nothing. Trade with rules, not emotions.

XRP Breakdown Risk: Triangle + Resistance = DropXRP( BINANCE:XRPUSDT ) is moving within a resistance zone($2.32-$2.19) and has shown notable reactions to the resistance line and the Potential Reversal Zone(PRZ) .
From a technical analysis perspective, it seems that XRP has formed a Symmetrical Triangle Pattern. If the lower line of this pattern is broken, it would align with our analysis.
Additionally, from an Elliott Wave theory standpoint, we expect the next corrective wave for XRP, and a break of that lower triangle line would confirm this expectation.
I expect that in the upcoming hours, XRP will begin a downward trend and test the support zone($2.16-$2.11). If it breaks through that support, we can expect further declines toward the next support zone($2.04-$2.00) and Cumulative Long Liquidation Leverage($2.04-$2.02).
First Target: $2.133
Second Target: $2.069
Third Target: $2.043
Stop Loss(SL): $2.330
Cumulative Short Liquidation Leverage: $2.30-$2.25
Cumulative Long Liquidation Leverage: $2.16-$2.13
💡 Please respect each other's opinions and express agreement or disagreement politely.
📌 XRP Analyze (XRPUSDT), 1-hour time frame.
🛑 Always set a Stop Loss(SL) for every position you open.
✅ This is just my idea; I’d love to see your thoughts too!
🔥 If you find it helpful, please BOOST this post and share it with your friends.

XRPUSDT: Strong Downward Pressure – Risk of Falling Toward 2.02Over the past 24 hours, XRP has been under significant pressure as the key support level at 2.15 was broken. This breakdown happened alongside a broader “risk-off” sentiment across the crypto market, combined with Bitcoin’s shift into a bearish structure , adding more downward momentum to XRP.
On the 4H chart, the bearish trend of XRPUSDT is very clear as price remains trapped inside a long-term descending channel . Each rebound has been capped at the channel’s resistance line, showing weak buying pressure while sellers continue to dominate .
The 2.22 zone is now acting as short-term resistance. If price retraces to this level, there is a high probability of renewed selling pressure pushing the market back into the downtrend. The next bearish target lies at 2.02, a historically strong support area that has held price multiple times before.
With a combined view of fundamentals and technicals, the overall trend for XRPUSDT remains bearish. Traders may look for sell setups if price retraces into the 2.20–2.22 region, aiming for the 2.02 target in the short term.

XRP Eyes Rebound Amid Bearish PressureFenzoFx— Technical indicators show oversold conditions and bullish divergence in momentum. As a result, we expect a potential rebound toward higher resistance levels before the broader downtrend resumes.
In this scenario, XRP could rise toward $2.2230, then pull back to $1.9220, with major sell-side liquidity resting at $1.7710.

XRP: Accumulation Zone Supports Short-Term UpsideFenzoFx—XRP (Ripple) is under selling pressure, down 0.50% today, trading near $2.309. The daily chart shows accumulation, suggesting sideways momentum may continue. Open interest supports this phase, with strong support between $2.072 and $2.223.
XRP could rise slightly, potentially revisiting $2.456. If resistance at $2.456 holds, a bearish wave may follow, targeting $2.072. Continued selling pressure could push the price toward the liquidity void at $1.922.

XRP Eyes $2.072 if Support BreaksFenzoFx—XRP is down 3.30% today, trading around $2.2330. Immediate support lies at $2.2230, backed by the anchored VWAP. So far, the price hasn’t closed below this level on the daily chart.
Technically, a close beneath VWAP could trigger further downside toward $2.072. If selling pressure continues, the next support is $1.922. The market outlook remains bearish while XRP trades below the descending trendline.

XRP Rejected at Key ResistanceFenzoFx—XRP failed to close above the $2.6480 resistance on Monday, dipping 6.00% to $2.5460, just above the bullish fair value gap. A momentum divergence confirms the strength of the $2.6480 resistance zone, highlighted in grey on the daily chart.
From a technical standpoint, XRP may trade lower toward $2.430, supported by the ascending trendline. If selling pressure persists, further downside targets include $2.224 and $2.073.
The bearish outlook remains valid as long as XRP/USD trades below the descending trendline. October 10’s long lower wick also suggests a gap that may attract price to fill, reinforcing the bearish scenario.

XRP Holds Gains Amid AccumulationFenzoFx—XRP (Ripple) is up 3.0% today, trading at $2.464 above the 8-period SMA. Rising volume suggests accumulation. If the price holds above $2.318, XRP/USD may target $2.6480. Continued buying pressure could invalidate the downtrend and open the path to the next liquidity zone at $2.956.
However, if the price drops below $2.3180, the bullish scenario is invalidated and accumulation may extend toward the $2.000 psychological level. Traders should monitor support levels closely as momentum builds.

XRP Faces Bearish Gap PressureFenzoFx—Ripple (XRP) lost its bullish bias after dipping below $2.940 support, triggering a bearish fair value gap on the 4-hour chart. Selling pressure eased near $2.796 liquidity void, where volume dropped sharply—signaling reduced momentum and potential consolidation.
Technically, XRP/USD may consolidate toward $2.9570, the mean threshold of the bearish gap. If price holds below this level, a new downtrend could emerge, targeting the equal lows at $2.690. Please note that the bearish outlook remains valid unless XRP forms a new higher high.

XRP May Extend Bearish MomentumFenzoFx—XRP (Ripple) is in a bear market, trading around $2.847 after failing to hold above the bearish FVG resistance at $2.966. It dipped and tested lows at $2.699.0. The outlook remains bearish while XRP/USD trades below the fair value gap. If this level holds, price may break below $2.6990, with potential downside extending to $2.339 if selling pressure increases.
Please note, the bearish view is invalidated only if price closes and stabilizes above the $4,250.0 resistance.

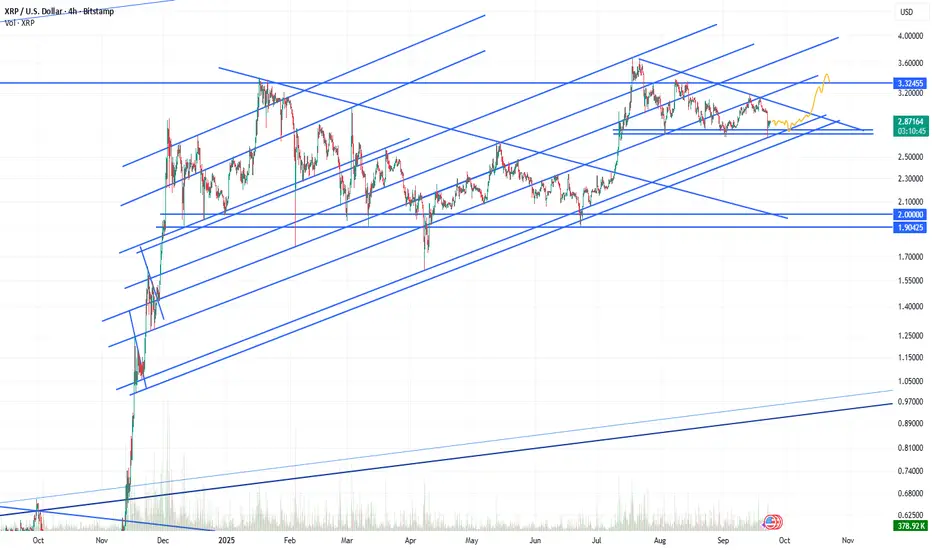
Likely scenario October end..You know, studying Xrp's chart shows us a multitude of fractals and points that match up quite well with the previous moves up since December. I'm expecting a move up higher come end of October and that's what I foresee in the charts currently. It's basically a more miniature version of the previous run up we had and it's a very similar fractal wedge that's forming. We're moving up higher soon with a little bit of more side action consolidation.
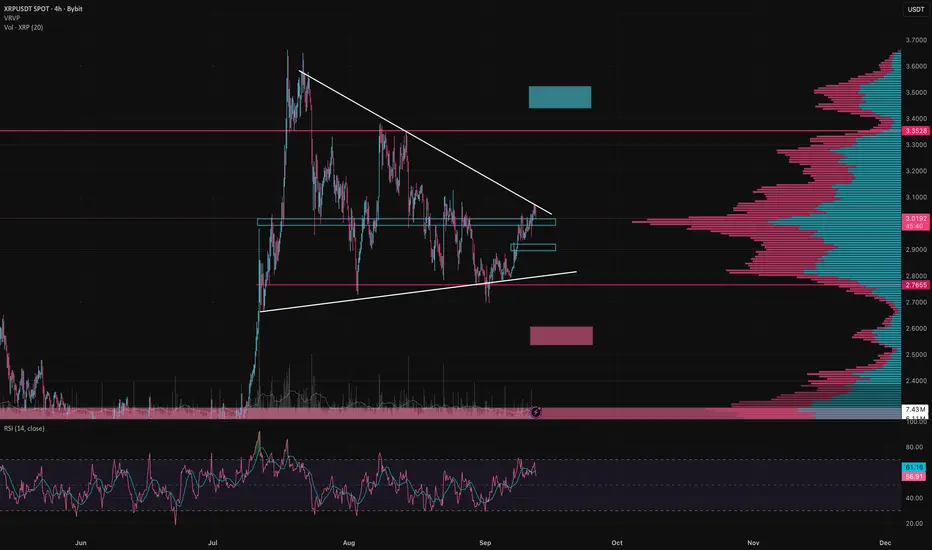
$XRP – Key Levels Before the BreakBYBIT:XRPUSDT is pressing into the upper trendline right where the 0.382 fib level meets a big volume cluster. This zone is super important to watch right now. Let’s break down the scenarios:
Bullish : breakout and close above 3.10 with strong volume → target 3.30 as the next liquidity pocket. If buyers stay powerful, we could even see 3.40+.
Bearish : rejection here and a close below 2.99 puts first support at 2.90. If that level breaks, next major zone is 2.76, and deeper down there’s a bigger demand zone around 2.53–2.60.
RSI : sitting neutral, not overheated. Market still has room to move, but without real volume a breakout won’t stick.
My thoughts: XRP is at decision time. The setup looks clean, but with weak volume I lean toward a pullback into 2.90 before any breakout can hold. If bulls show up, though, the push to 3.30 could happen fast.
Disclaimer: The author’s opinion may not align with yours
XRP Forms Head and Shoulders At PremiumFenzoFx—Ripple (XRP) displaced above $2.900, confirming a bullish trend. It now trades around $2.978, filling a bearish fair value gap and forming a head and shoulders pattern. On the 4-hour chart, equal lows at $2.934 and a liquidity void at $2.912 suggest a potential downside move.
Please note that $2.912 remains in the premium zone, however, it could trigger a bullish wave targeting $3.037. A break below $2.912 may extend the decline toward the fair value gap at $2.837. Traders should monitor these levels closely for bullish setups.

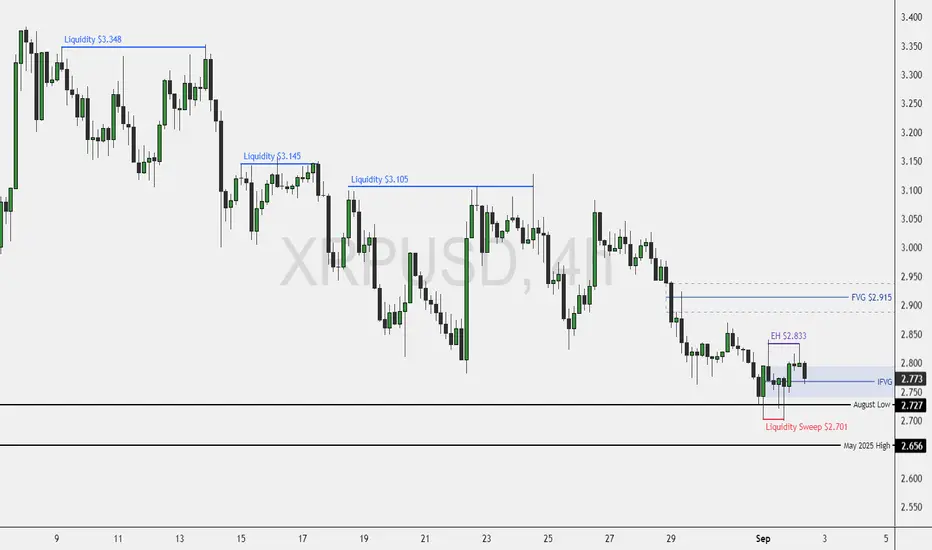
XRP: Bullish Setup Forms Above $2.833FenzoFx—XRP extended its downtrend to the August low of $2.727, briefly sweeping below. On the 4-hour chart, three equal highs at $3.105, $3.145, and $3.348 suggest a bullish setup. Immediate resistance sits at $2.833.
A bullish wave may emerge if this level is engulfed with a fair value gap, targeting $2.915. A strong exit above $2.195 could push toward $3.105 and $3.145.
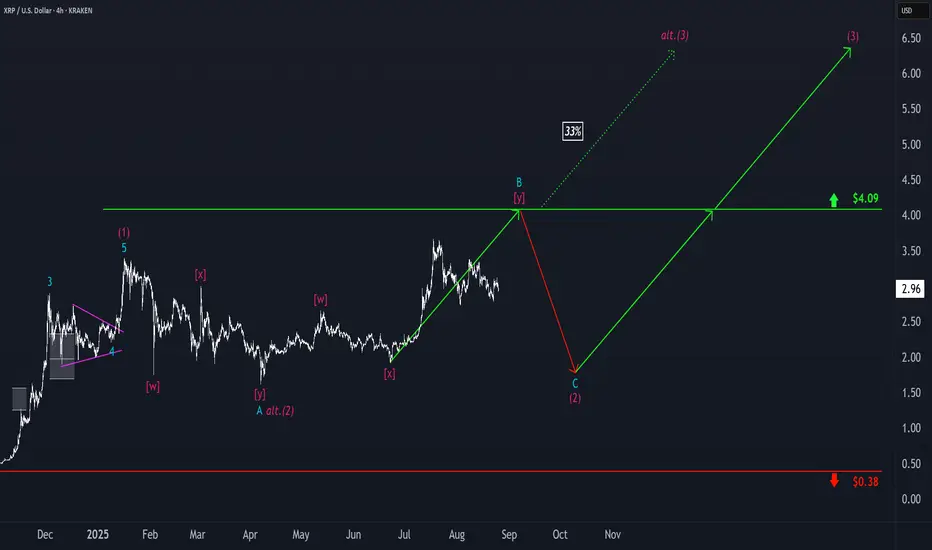
Ripple: Corrective RallyUnder our primary scenario, we place Ripple’s XRP in a corrective rally, which should ideally conclude near resistance at $4.09, marking the peak of turquoise wave B. After this high, we anticipate a wave-C pullback, which should bottom out well above support at $0.38 – and establish the low of the larger magenta wave (2). Looking ahead, magenta wave (3) should then drive a sustained move above the $4.09 threshold. Be this as it may, if the altcoin surpasses this resistance level in the current leg, that will indicate that wave alt.(2) has already completed (probability: 33%). In that scenario, we would expect a direct breakout.
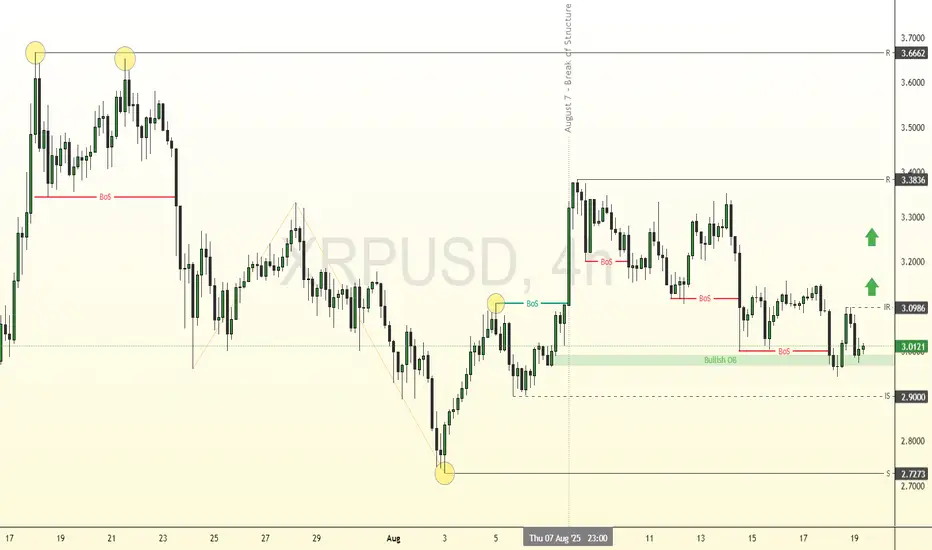
XRP: Key Support at $2.72 Holds Bullish OutlookFenzoFx—XRP (Ripple) broke its bearish structure with a strong engulfing pattern on August 7 and is now consolidating near $3.00. This level is supported by a bullish order block, with immediate support at $2.90.
The 4-hour chart shows equal highs at $3.66, marking a liquidity target. Immediate resistance lies at $3.09, and a close above this level could resume the uptrend.
XRP Holds Support: Eyes Break Above $3.31FenzoFx—XRP (Ripple) holds above the fair value gap (FVG), with key support at $3.11. Technically, the uptrend may resume if XRP closes and stabilizes above $3.31, supported by a bullish FVG on lower time frames like M10 or M15.
If this scenario unfolds, the next bullish target is the order block with highs at $3.56.

XRP breaking wedge2 for 2 on here now. IH&S went according to plan. Rested on the daily pivot and now its off on good news for their appeal drop.
Now were breaking out of the falling wedge. Next target is 3.56 supply then 3.74, daily r1 pivot.
Watch inflow for support. Could see some shake downs. Remember, this bad boy, and others like it are ONLY MOVED by institutions. Market Makers. You and me, we don't have the capital to drive them one red cent. So, any real quick move was for a reason. And its not for the sake of retail.
Follow for more bangerz

XRP - FUTURES SIGNALXRP - FUTURES SIGNAL
Coin: XRP
Direction: LONG
🟢Input range: market
✔️ТР: 3.0088/3.0580/3.1047
❌SL: 2.8975
We open a long trade according to the trend, after reaching a correction of 0.5 according to Fibonacci

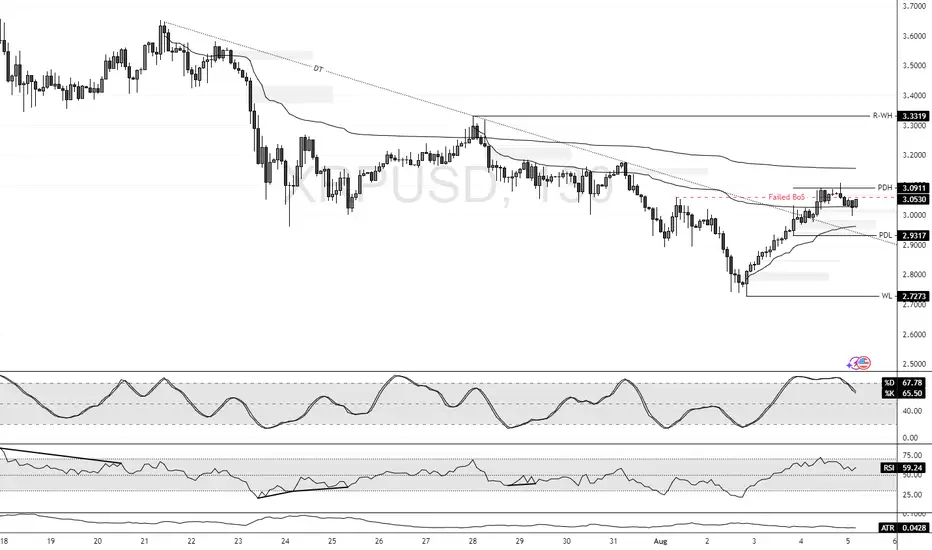
XRP's Failed Structure Break Signals Further ConsolidationFenzoFx—XRP/USD currently trades around $3.045 in a low-momentum market. Stochastic exited the overbought zone and is declining, signaling strengthening bearish momentum. The failed structure break in the New Session suggests a liquidity sweep with weak bullish interest.
Immediate resistance stands at $3.091. Technically, price is expected to decline toward the previous day's low at $2.931, a key liquidity zone. Please note that the bearish outlook is invalidated if price exceeds $3.091.
XRP Confronts Daily SMA ResistanceFenzoFx—XRP remains bearish, trading below the 50-period daily SMA at around $3.18. The SMA acts as resistance. Immediate support lies at $2.96. A break below this level may trigger further downside toward the $2.66 demand zone.
On the upside, a close and stabilization above $3.27 would invalidate the bearish outlook. In that case, momentum could push prices toward the previous highs at $3.65.
