Ripple: Downtrend ContinuesRipple’s XRP has continued its downward trajectory, further developing the blue bearish structure we primarily anticipate. This move is expected to ultimately bring XRP into the green Target Zone between $1.03 and $0.38, where the larger turquoise wave B is projected to complete. We still assign a 30% probability to the alternative scenario in which turquoise wave alt.B has already finished. This alternative could be confirmed if XRP breaks above the resistance levels at $3.19 and $4.09.
Xrpforecast

BTC ETH SOL XRP MSTR Did You Sell Your Bags? Of Course Not!I'm reposting this idea from early this morning because I got banned for a few hours, and the original idea post was hidden, because I mistakenly made a mention to a social media account in the idea description and it's a House Violation.
Now 12hrs later and my original forecast from early this morning now confirmed, here we go:
Last night we had a great SHORT entry and price was unable to break above key resistance channel lines. We should have a CHOPPY next few days so, the forecast is that today was a possible direction change so I closed my SHORTs with a profit and I'll wait for a better entry later tonight or overnight once this brief reaction rally is complete.
I am still expecting the collapse to continue into next week and I'll be entering new shorts as soon as the Stochastic Momentum Indicator confirms Bearish Divergences on each market.
As for MSTR, I misread the forecast and the drop was into today, not tomorrow, therefore we had a bounce into the current Tuesday overnight session and tomorrow Wednesday is a very strong target hence, it should be an important HIGH followed by a continued decline. But either way, if it's a HIGH then my SHORT is already opened, if it's a LOW then I'll close the SHORT when the LOW is complete and open LONGs... 😎

XRP Eyes Rebound Amid Bearish PressureFenzoFx— Technical indicators show oversold conditions and bullish divergence in momentum. As a result, we expect a potential rebound toward higher resistance levels before the broader downtrend resumes.
In this scenario, XRP could rise toward $2.2230, then pull back to $1.9220, with major sell-side liquidity resting at $1.7710.

XRP: Accumulation Zone Supports Short-Term UpsideFenzoFx—XRP (Ripple) is under selling pressure, down 0.50% today, trading near $2.309. The daily chart shows accumulation, suggesting sideways momentum may continue. Open interest supports this phase, with strong support between $2.072 and $2.223.
XRP could rise slightly, potentially revisiting $2.456. If resistance at $2.456 holds, a bearish wave may follow, targeting $2.072. Continued selling pressure could push the price toward the liquidity void at $1.922.

XRP Rejected at Key ResistanceFenzoFx—XRP failed to close above the $2.6480 resistance on Monday, dipping 6.00% to $2.5460, just above the bullish fair value gap. A momentum divergence confirms the strength of the $2.6480 resistance zone, highlighted in grey on the daily chart.
From a technical standpoint, XRP may trade lower toward $2.430, supported by the ascending trendline. If selling pressure persists, further downside targets include $2.224 and $2.073.
The bearish outlook remains valid as long as XRP/USD trades below the descending trendline. October 10’s long lower wick also suggests a gap that may attract price to fill, reinforcing the bearish scenario.

XRP Holds Gains Amid AccumulationFenzoFx—XRP (Ripple) is up 3.0% today, trading at $2.464 above the 8-period SMA. Rising volume suggests accumulation. If the price holds above $2.318, XRP/USD may target $2.6480. Continued buying pressure could invalidate the downtrend and open the path to the next liquidity zone at $2.956.
However, if the price drops below $2.3180, the bullish scenario is invalidated and accumulation may extend toward the $2.000 psychological level. Traders should monitor support levels closely as momentum builds.

XRP - Dropped as we planned. NEW signals!!XRP - Dropped as we planned. NEW signals!!
in a previus analysis i told you big drop is coming - that plan played out for 100%
at this moment key area for short - $2.71
key zone for long $1.82 or $1.18

XRP May Extend Bearish MomentumFenzoFx—XRP (Ripple) is in a bear market, trading around $2.847 after failing to hold above the bearish FVG resistance at $2.966. It dipped and tested lows at $2.699.0. The outlook remains bearish while XRP/USD trades below the fair value gap. If this level holds, price may break below $2.6990, with potential downside extending to $2.339 if selling pressure increases.
Please note, the bearish view is invalidated only if price closes and stabilizes above the $4,250.0 resistance.

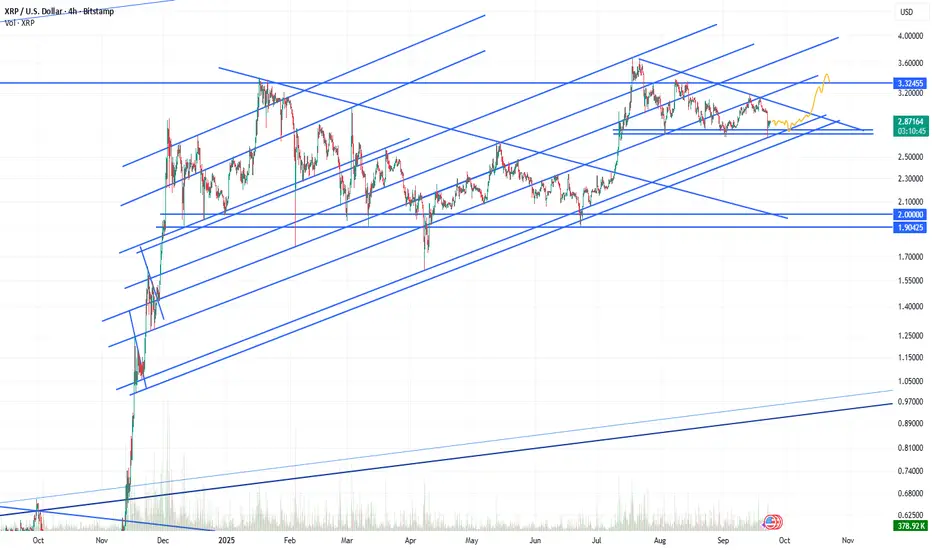
Likely scenario October end..You know, studying Xrp's chart shows us a multitude of fractals and points that match up quite well with the previous moves up since December. I'm expecting a move up higher come end of October and that's what I foresee in the charts currently. It's basically a more miniature version of the previous run up we had and it's a very similar fractal wedge that's forming. We're moving up higher soon with a little bit of more side action consolidation.
XRP Forms Head and Shoulders At PremiumFenzoFx—Ripple (XRP) displaced above $2.900, confirming a bullish trend. It now trades around $2.978, filling a bearish fair value gap and forming a head and shoulders pattern. On the 4-hour chart, equal lows at $2.934 and a liquidity void at $2.912 suggest a potential downside move.
Please note that $2.912 remains in the premium zone, however, it could trigger a bullish wave targeting $3.037. A break below $2.912 may extend the decline toward the fair value gap at $2.837. Traders should monitor these levels closely for bullish setups.

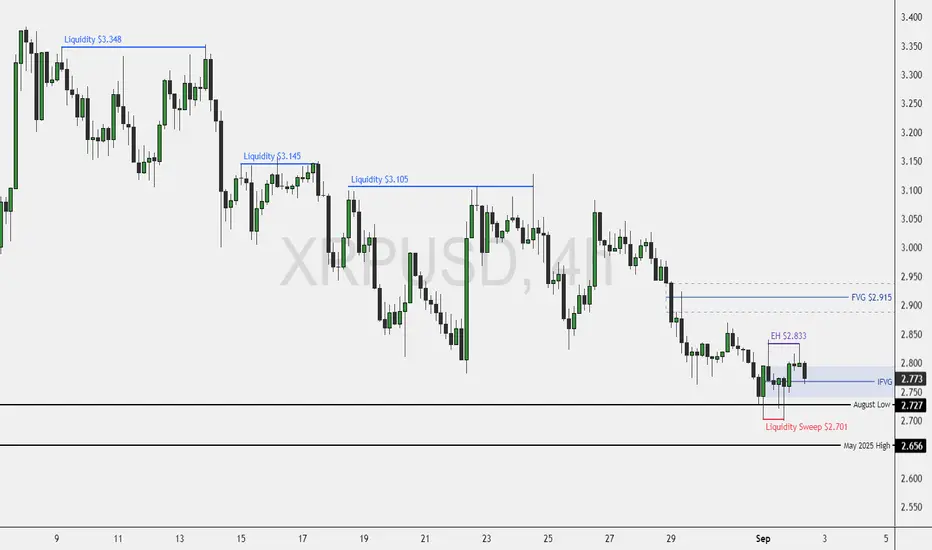
XRP: Bullish Setup Forms Above $2.833FenzoFx—XRP extended its downtrend to the August low of $2.727, briefly sweeping below. On the 4-hour chart, three equal highs at $3.105, $3.145, and $3.348 suggest a bullish setup. Immediate resistance sits at $2.833.
A bullish wave may emerge if this level is engulfed with a fair value gap, targeting $2.915. A strong exit above $2.195 could push toward $3.105 and $3.145.
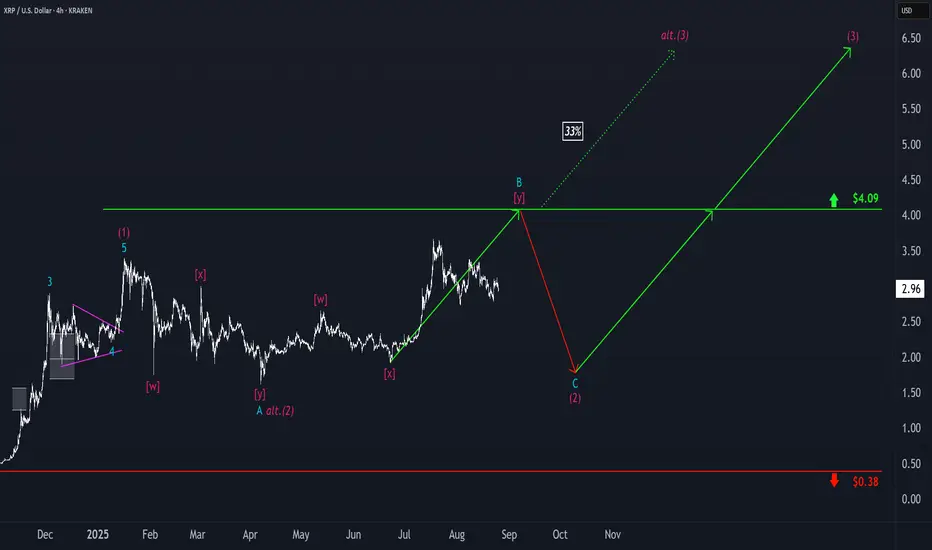
Ripple: Corrective RallyUnder our primary scenario, we place Ripple’s XRP in a corrective rally, which should ideally conclude near resistance at $4.09, marking the peak of turquoise wave B. After this high, we anticipate a wave-C pullback, which should bottom out well above support at $0.38 – and establish the low of the larger magenta wave (2). Looking ahead, magenta wave (3) should then drive a sustained move above the $4.09 threshold. Be this as it may, if the altcoin surpasses this resistance level in the current leg, that will indicate that wave alt.(2) has already completed (probability: 33%). In that scenario, we would expect a direct breakout.
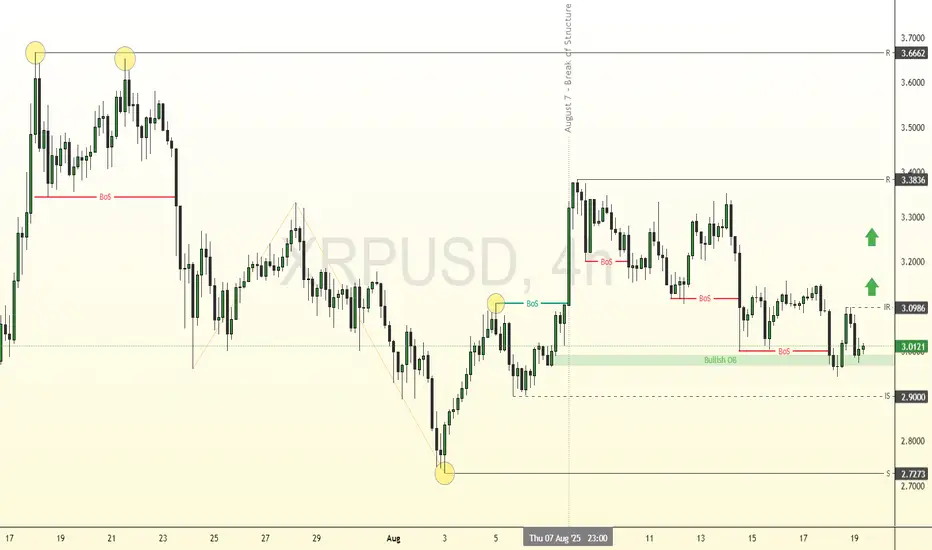
XRP: Key Support at $2.72 Holds Bullish OutlookFenzoFx—XRP (Ripple) broke its bearish structure with a strong engulfing pattern on August 7 and is now consolidating near $3.00. This level is supported by a bullish order block, with immediate support at $2.90.
The 4-hour chart shows equal highs at $3.66, marking a liquidity target. Immediate resistance lies at $3.09, and a close above this level could resume the uptrend.
XRP Holds Support: Eyes Break Above $3.31FenzoFx—XRP (Ripple) holds above the fair value gap (FVG), with key support at $3.11. Technically, the uptrend may resume if XRP closes and stabilizes above $3.31, supported by a bullish FVG on lower time frames like M10 or M15.
If this scenario unfolds, the next bullish target is the order block with highs at $3.56.

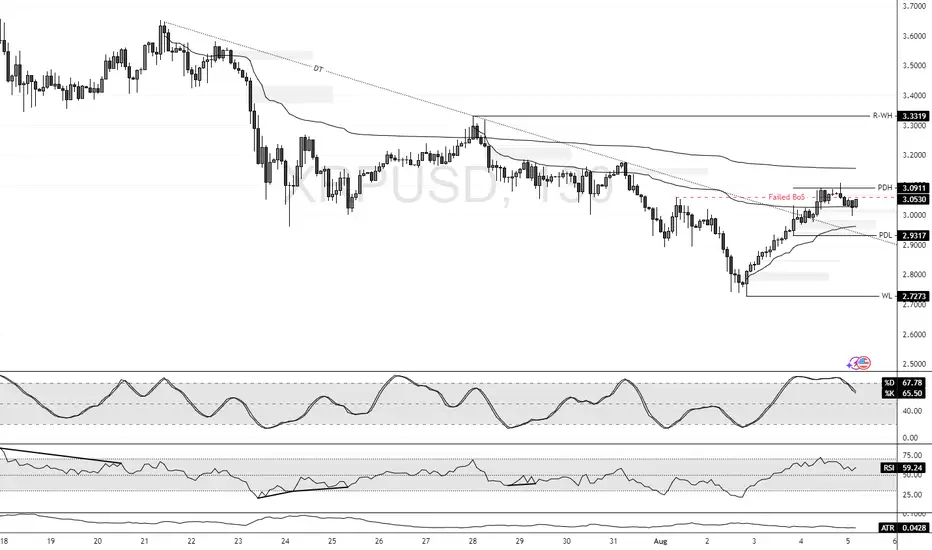
XRP's Failed Structure Break Signals Further ConsolidationFenzoFx—XRP/USD currently trades around $3.045 in a low-momentum market. Stochastic exited the overbought zone and is declining, signaling strengthening bearish momentum. The failed structure break in the New Session suggests a liquidity sweep with weak bullish interest.
Immediate resistance stands at $3.091. Technically, price is expected to decline toward the previous day's low at $2.931, a key liquidity zone. Please note that the bearish outlook is invalidated if price exceeds $3.091.
XRP Confronts Daily SMA ResistanceFenzoFx—XRP remains bearish, trading below the 50-period daily SMA at around $3.18. The SMA acts as resistance. Immediate support lies at $2.96. A break below this level may trigger further downside toward the $2.66 demand zone.
On the upside, a close and stabilization above $3.27 would invalidate the bearish outlook. In that case, momentum could push prices toward the previous highs at $3.65.

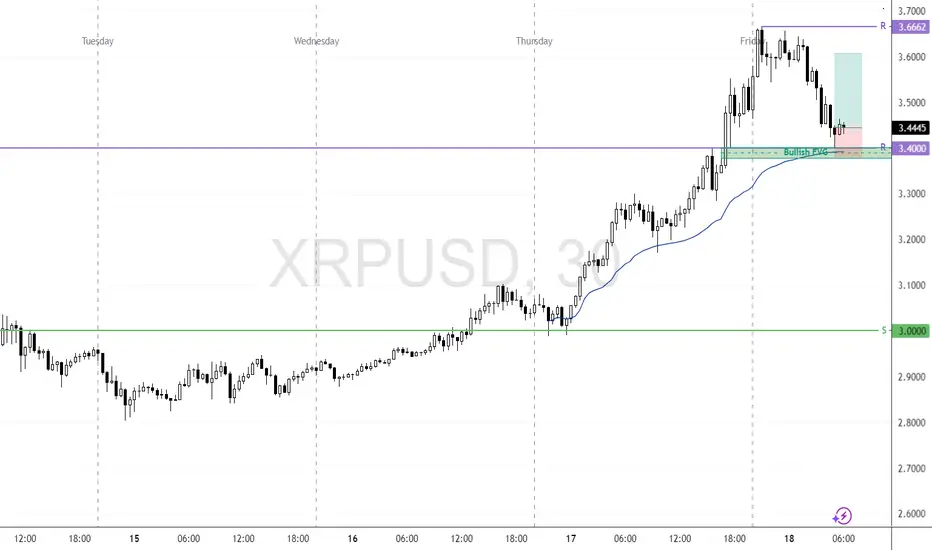
XRP Retests Previous All-Time High as Bullish Setup DevelopsFenzoFx—XRP (Ripple) is tested and has stayed above $3.40, the previous all-time high. This level acts as support, backed by the VWAP from Thursday's low and the bullish FVG.
If this level holds, we expect the cryptocurrency to aim higher, targeting $3.60, followed by $3.66.
XRP: Order Block at $3.40 Could Cap The RallyFenzoFx—Ripple's bullish momentum resumed nonstop, offering no clear pullback for entry. Currently, XRP is testing resistance at $3.40 within an order block. Momentum indicators remain in overbought territory, signaling short-term overpricing.
Volume profile shows limited resistance at present levels, suggesting a likely retest of $3.40. If this resistance holds, a pullback toward support around $3.00 is expected. This level can provide a discount to join the bull market.

XRP Cools Near $3.00 Amid Overbought SignalsFenzoFx—XRP remains bullish after piercing $3.00 earlier this week but cooled near resistance. Trading around $2.90, Stochastic (~84) and RSI 14 (80) indicate overbought conditions, suggesting consolidation.
We anticipate a pullback toward $2.66 support before resuming the uptrend. Alternatively, a decisive break above $3.00 would target $3.21 next.

XRP Pushes Toward Breakout as Momentum BuildsFenzoFx—XRP is bullish, attempting a breakout above the $2.34 resistance. Stochastic at 70.0 and RSI at 63.0 signal strong momentum with room for further upside.
A close above $2.34 could push XRP/USD toward the next target at $2.48. However, the bullish bias remains valid only above the $2.16 support—dropping below this level could reverse the trend.

XRP: Break Above $2.338 Opens Path to $2.480FenzoFx—Ripple (XRP) eased near weekly highs of $2.338, with Stochastic and RSI 14 signaling overbought conditions. The trend stays bullish above the anchored VWAP or $2.165, but consolidation toward $2.2240 is expected before resuming.
A break above $2.338 would target the next supply zone at $2.480.

Ripple Consolidates with Bullish Bias IntactXRP was rejected at the previous week’s high of $2.34 and is currently testing support at $2.22. As long as it holds above $2.16 or the 50-SMA, the bullish trend remains valid, with $2.34 likely to be retested.
On the flip side, a close below $2.16 could trigger a decline toward $2.07.

Bearish Setup Forms for XRP Below $2.21FenzoFx—XRP trades around $2.18 after forming a long-wick bearish candlestick above $2.17 support.
Stochastic reads 83.0, indicating overbought conditions. A close below $2.16 with a bearish engulfing candle could lead to $2.08. A close above $2.21 would invalidate the bearish outlook and open the door to $2.33.
