XRP 2,130% profits potential with 10X leverage —LONG tradeI am doing a repost on XRP because the first trade went beyond the numbers. The manual stop-loss is not activated but I don't know what to make of it. Everybody can have a different entry price.
Numbers are updated and valid. Maximum leverage is possible. This is a perfect entry. Zero risk. Buy and hold.
I think timing is very important when it comes to trading with high leverage. If the timing is right, even a rookie can get it right. If timing accuracy is missing, then it all falls back to capital allocation/position size/risk control.
Timing is perfect right now, so you can forget about all those.
Full XRPUSDT leveraged trade-numbers below:
_____
LONG XRPUSDT
Leverage: 10X
Potential: 2130%
Allocation: 5%
Entry zone: $1.72 - $1.80
Targets:
1) $2.05
2) $2.22
3) $2.49
4) $2.71
5) $2.94
6) $3.25
7) $3.66
8) $4.10
9) $4.38
10) $4.83
11) $5.55
Stop: Close weekly below $1.70
____
Thanks a lot for your support all those years. I hope you find the timing awesome for this trade.
This is a high probability chart setup.
Thank you for reading.
Namaste.
Xrplong

XRP 1,890% profits potential with 10X leverage —LONG tradeI think timing is very important when it comes to trading with high leverage. If the timing is right, even a rookie can get it right. If timing accuracy is missing, then it all falls back to capital allocation/position size/risk control.
Timing is perfect right now, so you can forget about all those.
Full XRPUSDT leveraged trade-numbers below:
_____
LONG XRPUSDT
Leverage: 10X
Potential: 1890%
Allocation: 3%
Entry zone: $1.80 - $1.95
Targets:
1) $2.05
2) $2.22
3) $2.49
4) $2.71
5) $2.94
6) $3.25
7) $3.66
8) $4.10
9) $4.38
10) $4.83
11) $5.55
Stop: Close weekly below $1.75
____
Thanks a lot for your support all those years. I hope you find the timing awesome for this trade.
This is a high probability chart setup.
Thank you for reading.
Namaste.

XRPUSDT M30 HTF Liquidity Grab and Mean Reversion Pullback Setup📝 Description
CRYPTOCAP:XRP is trading after a sharp sell-off that swept prior sell-side liquidity, followed by stabilization above the local lows. Current price action shows compression and base-building behavior inside short-term PD arrays, suggesting the move is corrective rather than impulsive continuation to the downside.
________________________________________
📈 Signal / Analysis
Primary Bias: Bullish while price holds above the recent liquidity sweep low and the M30 demand base
Preferred Setup:
• Entry: 2.036
• Stop Loss: Below 2.032
• TP1: 2.043
• TP2: 2.067
• TP3: 2.102 (HTF draw / upper liquidity)
________________________________________
🎯 ICT & SMC Notes
• Clear sell-side liquidity sweep before stabilization
• No confirmed bearish BOS after the dump
• Upside targets align with unfilled FVGs and prior inefficiencies
________________________________________
🧩 Summary
CRYPTOCAP:XRP appears to be transitioning from a liquidity-driven sell-off into a corrective recovery phase. As long as price remains supported above the swept lows, the probability favors a controlled bullish push toward higher PD arrays.
________________________________________
🌍 Fundamental Notes / Sentiment
Market sentiment remains neutral with selective risk appetite in altcoins. In the absence of strong negative catalysts, liquidity sweeps are more likely to resolve into rebounds rather than sustained downside continuation.
________________________________________
⚠️ Risk Disclosure
Trading involves substantial risk and may result in capital loss. This analysis is for educational purposes only and does not constitute financial advice. Always apply proper risk management, predefined stop-loss levels, and disciplined position sizing aligned with your trading plan.

XRP makes big moves -LONG-DAILY-VIEW-Hello all 🌍😀🙋♂️🙋♀️
Thank you so much for coming today 🌞
Let's dive right in 🏄♂️🏄🌊⏬👇🐼
I am and have been extremely bullish on XRP
🐮🙋♀️🙋♂️WHY?☮️💡🤯
FUNDAMENTALLY:
💠Deflationary in nature🍃 the more XRP that is burned (every transaction, results in a very small fraction of burned token) the more it pushes price of XRP up naturally -supply and demand-
💠XRP is ranked top 5 fastest transaction times of all cryptocurrencies (3-5 seconds)
💠The SEC tried to sue XRP's creator Ripple in 2020 for selling XRP to institutional investors, the lawsuit ended in a 'permanent' injunction against XRP selling to institutions. This could be considered good and bad
💠August 2025 SEC dropped the case and both parties dismissed their appeals
💠 The lawsuit of 2020 didn't stop XRP from outperforming, XRP is currently top 5 cryptocurrencies market cap rating, sitting at 💲130 Billion total (not circulating)
Let's dive in, to the next look 🔍🤸🤸♂️💭⏬🐼
TECHNICALLY:
NOVEMBER 3rd 2023 , XRP price went from .48 cents to 2.9 on DECEMBER 3rd
a 490 percent 💲price increase in just 1 month 🤯 That's a bullish and QUICK🏃♀️🏃♂️💨 jump ⏬⏬🔽👇
⭐👀📍
We have currently made a break from a bearish🐻 descending triangle📐 and it is a strong break at that 💥
If we can continue to gain support 💪 and turn these resistances into fuel ⛽ without getting rejected, XRP price could see some of our bullish 🐂🎯 targets, listed above 📈📉
Let's see!
⌚⌛👀🐶📌😀
Thank you for stopping by and always remember 👇👇
🫡🐴🐲🐸🤖👻👽🙍♂️🙍♀️🫡
🛑🛑🛑This is not financial advice🛑🛑🛑 Above are approximate targets based on fibs and major trend lines etc. I always recommend looking at multiple charts when making a big investment. Always have a stop loss ✋🛑💲 set🆗
Any thoughts 💭💡, questions 🙋♀️🙋♂️❓, good 👍, bad👎, happy 😄 or sad 😥, in the comments always welcome.
Jazerbay 🌠

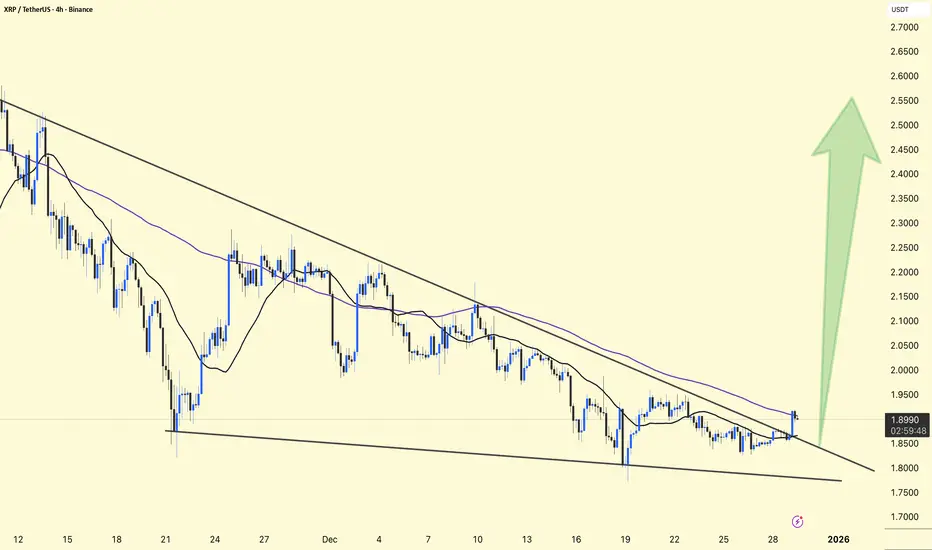
XRPUSDT – 4H Chart UpdateXRPUSDT – 4H Chart Update
XRP remains within a descending channel, but the price is pressing against the upper trendline, indicating compression near resistance.
Price just tested the 100 MA; momentum is trying to shift short-term.
Support: 1.88 – 1.85
Major Support: 1.78 – 1.75
Resistance: 1.95 – 2.00
Breakout Zone: 2.10 → 2.40+
Lower selling pressure and a tight range near the trendline create a decision zone.
A 4H close above $2.00 can trigger a fast upside move. Rejection keeps range-bound action.
⚠️ Wait for confirmation, no blind entries.
DYOR | NFA
XRP/USDT – Chart Analysis (Weekly)XRP/USDT – Chart Analysis (Weekly)
XRP has broken out of a multi-year downtrend line → confirming a major trend reversal
Strong impulsive rally after prolonged accumulation
The current price action is a healthy corrective pullback, not a bearish reversal
As long as the higher support zones hold, the structure remains bullish.
Fibonacci Analysis.
(Fibonacci drawn from macro low → to recent high)
0.236 – 2.88 → Strong rejection zone (local top)
0.382 – 2.41 → Supply / Resistance
0.5 – 2.03 → Mid-range level
0.618 – 1.65 → Golden Support Zone
0.786 – 1.11 → Strong demand and last bullish defense
The price is currently trading between 0.5 and 0.618, close to a high-probability demand zone.
Moving Average Confirmation
The price is still above the rising weekly MA (~1.65)
The MA is acting as dynamic support
In a bull cycle, the price often dips below the MA and recovers
As long as the weekly closes remain near/above the MA, the bullish trend remains intact.
DYOR | NFA.

XRPUSDT Has formed Supply and demand zoneCRYPTOCAP:XRP
Trading plan.. Bearish ( long )
Trading pair .. CRYPTOCAP:XRP
Confluence .. Demand and Supply
Take Profit .. 1st T.P= 2.12
2nd T.P= 2.22
Stop loss .. Below Demand zone = 1.95
Risk Reward .. 1 into 3.5

XRPUSD – The December Accumulation Play | Smart Money Blueprint Market Context – The Perfect Storm for XRP |
XRP is sitting at one of the most compelling risk/reward setups in crypto right now. After a historic 430% rally from early November that took XRP from $0.50 to a local peak of $2.87 on December 2, 2024, the asset has entered a healthy consolidation phase inside a rising channel between $1.95-$2.00 support and $2.62-$2.80 resistance.
But here's what makes this different from your typical alt pump: the fundamentals are actually there.
The surge followed Donald Trump's election victory in November 2024, which triggered expectations of more favorable US crypto policies. The SEC, under new pro crypto leadership, is nearing a final resolution with Ripple, with the SEC keeping $50 million from the previous $125 million fine and returning the rest. This removes years of regulatory overhang.
Then came the game changer: Ripple launched its RLUSD stable coin globally on December 17, 2024 Business Wire, which is fully backed by U.S. dollar deposits, U.S. government bonds, and cash equivalents Business Wire. This isn't just another stable coin it's enterprise grade infrastructure designed for cross border payments for Ripple's customers starting early next year FXStreet.
Translation? XRP isn't speculation anymore. It's becoming institutional grade infrastructure.
🔎 Technical Framework – Smart Money Channeling Higher
Current State:
Rising channel accumulation phase with whale conviction
Key Liquidity Zones:
🔴 Premium Liquidity Zone (Sell Opportunity):
$2.62 - $2.80 (upper channel resistance + FVG cluster)
This is where retail gets greedy and smart money distributes
Historically, significant spikes in whale to exchange transactions align closely with XRP price peaks.
🟢 Discount Liquidity Zone (BUY ORIGIN):
$1.90 - $2.00 (lower channel support + whale accumulation cluster)
This support zone has consistently triggered rebounds since December 2024
In the last 24 hours alone, large holders accumulated an additional 110 million XRP.
⚖️ Equilibrium / Chop Zone:
$2.20 - $2.40 (mid channel consolidation)
Avoid blind entries here—wait for structural confirmation
🐋 WHALE ACTIVITY – The Real Story
This is where it gets JUICY . While retail panicked during the recent pullback, whales went on an absolute buying spree:
Ripple whales accumulated 160 million XRP worth around $380 million as of December 10, 2024
Large XRP investors added 590 million XRP worth $1.29 billion over a seven day period
Between December 25 and December 28, XRP whales accumulated tokens worth $2.17 billion
Let me repeat that: $2.17 BILLION in THREE DAYS .
CryptoQuant data indicates whale activity over the past month reached unprecedented levels, multiples higher than any other period. This isn't retail FOMO—this is institutional positioning.
Now here's the kicker: Whale order clusters near $1.80-$2.00 USD during 2025 show persistent large holder activity. Every time XRP dips to this zone, whales defend it aggressively. That's your signal.
🚨 Recent Developments – Catalyst Stack
SEC Settlement (MASSIVE)
Ripple will retain $75 million from the SEC settlement, and most importantly, be able to offer XRP tokens to institutional investors. This was the missing piece preventing institutional adoption. Now? Game on.
RLUSD Stablecoin Launch
Ripple announced the launch of RLUSD on December 17, 2024, calling it an "enterprise grade stablecoin built on trust, utility, and compliance". Ripple plans to use both RLUSD and XRP in its cross border payments solution, creating direct utility demand for XRP in institutional payment flows.
Regulatory Tailwinds
With Trump's pro crypto administration and Gary Gensler stepping down, the regulatory environment has flipped 180 degrees. Former CFTC Chair Christopher Giancarlo stated the SEC should drop the Ripple case.
ETF Momentum Building
Franklin Templeton and Canary Capital have filed for XRP ETFs. If approved, we're talking about billions in potential institutional inflows.
🎯 Trade Plans – Precision Entry & Exits
🟢 BUY XRPUSD: $1.90 - $2.00 | SL $1.82
Thesis: Discount origin tap at proven whale accumulation zone + rising channel support = institutional buy zone
Entry Rules (WAIT FOR CONFIRMATION):
Price dips into $1.90-$2.00 zone
Bullish CHoCH (Change of Character) + BOS (Break of Structure) on M15-H1
Strong bullish wick rejection + volume spike
Ideally on FVG fill or after Order Block retest
Targets:
$2.40 - $2.50 (mid-channel retest, quick 20-25% gain)
$2.70 - $2.85 (upper channel resistance, 35-42% gain)
$3.50 - $3.75 (1:1 Fibonacci extension + previous ATH retest, 75-87% gain)
Moonshot: $4.75+ (if RLUSD adoption + ETF approval coincide)
🔴 SELL XRPUSD: $2.65 - $2.80 | SL $2.92
Thesis: Premium liquidity grab at channel top followed by engineered bearish displacement—smart money distribution before reaccumulation
Entry Rules (WAIT FOR CONFIRMATION) :
Price touches $2.65-$2.80 zone
Bearish CHoCH + MSS (Market Structure Shift) + BOS down on M15-H1
Heavy volume spike on exchange inflows (use CryptoQuant whale inflow data)
Entry after FVG fill or Order Block retest post BOS
Targets:
$2.35 - $2.40 (first reaction, mid channel)
$2.10 - $2.15 (deeper retracement)
$1.90 - $2.00 (full channel retest—BUY zone reactivates)
⚠️ Risk Management & Critical Notes
Do NOT trade inside the mid channel chop zone ($2.20-$2.40) without structural confirmation—this is where retail gets chopped to pieces
Sweeps ≠ Trend Entries: If XRP wicks to $2.80 or down to $1.85, that's likely a liquidity grab, NOT a breakout/breakdown
Use tight SL based on structure invalidation—never average down in consolidation
Monitor whale to exchange inflow data (CryptoQuant): Rising whale to exchange flow indicates selling pressure
Given macro volatility (Fed policy, crypto regulation news), consider scaling position size down by 30-50%
📊 The Bottom Line – December's Hidden Gem
XRP is trading at a critical juncture. On one hand, you have:
✅ Record whale accumulation ($3.8B+ since November)
✅ SEC settlement removing regulatory overhang
✅ RLUSD launch creating institutional utility demand
✅ Pro Crypto political environment
✅ Rising channel structure with clear support/resistance
On the other hand:
⚠️ Consolidation phase means volatility is coiling
⚠️ Whales could distribute at channel top ($2.65-$2.80)
⚠️ Bitcoin weakness could drag XRP lower short-term
My Take? This is classic Smart Money accumulation. The $1.75-$2.16 support zone has been defended relentlessly by whales. Every dip gets bought. That's institutional positioning for a leg higher.
Strategy:
If you're not in yet wait for $1.90-$2.00 pullback (high probability long setup)
If you're already in take partial profits at $2.65-$2.80, let the rest ride with a trailing stop
If we break $2.80 with volume add to position, target $3.50-$4.75
This isn't financial advice this is technical + fundamental confluence at its finest.
🔥 Final Word – Why This Time Is Different
XRP has had false starts before. But this time, the stars are actually aligning:
Regulatory clarity ✅
Institutional utility (RLUSD) ✅
Whale conviction ✅
Political tailwinds ✅
Technical setup ✅
The question isn't if XRP moves it's when and how violently.
Position accordingly. Trade the structure. Follow the whales.
Drop a 🚀 if you're accumulating XRP at these levels. Let's ride this wave together.

Xrp - last stop until valhallaCan you see it?
IH&S
On the 4th leg down (5 we break)
In a decending channel
Sitting on monthly pivot
Etf's
Iso20022 incoming
...
I mean.. Never say never, but, this train is leaving!

XRP at a critical momentThe Alpha View on XRP
CRYPTOCAP:XRP at a critical moment:
Daily close above 3.07 = bullish continuation.
Healthy retrace = 2.83 as fresh support.
Lose 2.73 and the #XRParmy might face a full-blown meltdown.
Stay Sharp. Stay Regulated.

XRPUSDT Bullish Scenario Updated🔎 Technical Outlook
XRP is currently trading around 3.03 – 3.04 USDT, after bouncing from a key support zone near 2.95 USDT. The chart shows a sequence of higher lows with multiple buy signals clustering near the base, suggesting strong accumulation.
The resistance zone sits around 3.18 USDT, which is also marked as your target area. A clean breakout above minor intraday resistance at 3.05 USDT would open the way for bullish continuation. The structure favors buyers as long as price holds above 2.95 support.
________________________________________
📈 Trade Setup (Bullish Bias)
• Entry: 3.03 – 3.05 USDT (current market zone)
• Stop-Loss: 2.95 USDT (below recent support & invalidation level)
• Take Profit 1: 3.12 USDT (intermediate resistance)
• Take Profit 2: 3.18 USDT (major resistance target)
• Risk/Reward: ~1:2
________________________________________
🛡 Risk & Trade Management
• 🔒 Partial Profit Booking: Secure some profits at 3.12 USDT to reduce risk exposure.
• 📈 Trailing Stop: Once TP1 is hit, move stop-loss to breakeven (3.03) and trail along higher lows to ride momentum.
• 🚫 Invalidation: If XRP breaks below 2.95, the bullish setup is invalid, and exiting quickly protects capital.
________________________________________
✅ Summary
XRP is showing bullish intent after defending the 2.95 support zone and looks set to retest 3.12 – 3.18 USDT. A layered profit-taking approach with a trailing stop allows you to capture the move while managing downside risk effectively.
________________________________________
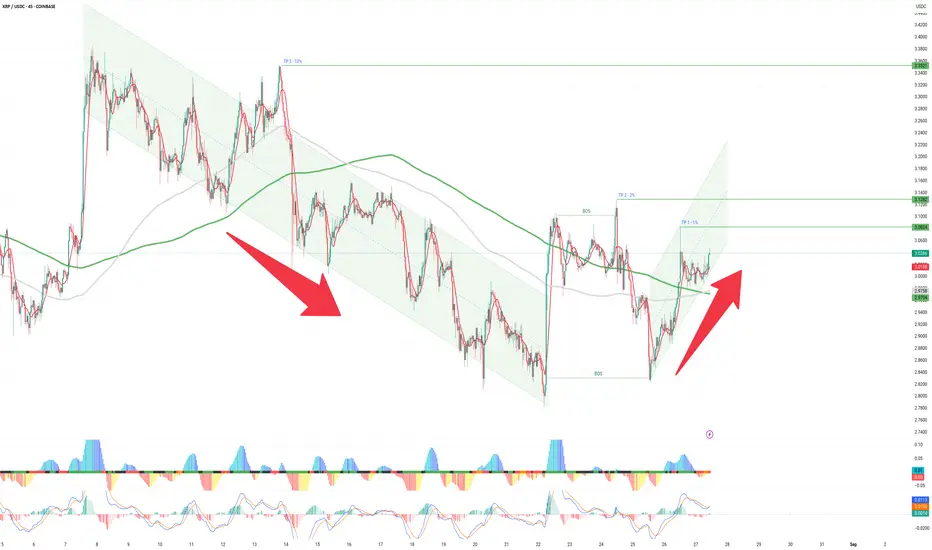
XRP New Higher Low and Break of Structure, LONG PlayThe 45min chart is powerful for Crypto, and is showing a new Higher Low.
Break of structure to the upside. (See "bos" horizontal lines).
An upward channel is present on 45min chart and 1h chart.
Bull Pennant Pattern is showing on my candle times, including 4h and daily. These usually break bullish.
On the 45min chart the 200ma has just crossed above the 314ma. In my methodology that's a bullish MA cross.
ADX/DI and Squeeze and Wadda indicators are favorable on the lower time frames including 4h's.
This is slightly high octane speculation, but mostly TA with a slight bit of front running and TIGHT stop loss.
Overall looks like the ALT market is green today for many pairs against USD and USDC on Coinbase. If nothing else today should offer a stop loss in the green while XRP makes a move.
Long!! I opened a leverage long position over the weekend. I am planning to take profit at $4, $4.50 and $5. Stop loss is at $2.7
Reasons for a long position:
1) The price has pulled back and found a clear support at Fib .5 and EMA55.
2)The current chart set up is very similar to that in Jan 2025 (see green vertical line in the chart).
3) RSI is consolidating in the bull zone.
4) MACD lines are bunched up together and moving horizontally. However, the lines are in the bull zone and MACD histogram shows bear momentum is waning. It might be safer to wait for MACD lines to cross to the upside, but there are enough confluences for bullish bias.
5) The daily candle is now moving above Fib 0.236. Fib 0.236 often works as the last line of defence for the bear and if it is breached, it is very likely to move to the upside.

Scalping $XRP – Road to $3.4222Scalping CRYPTOCAP:XRP – Road to $3.4222 🚀
XRP is knocking on the $3.31 gate — a breakout here unlocks clean air to $3.38–$3.42.
🎯 Target: $3.4222 (next liquidity cluster from last impulse high).
For the move:
✅ 1H close > $3.31 w/ vol
✅ Clean body closes (no long rejection wicks)
Risk:
⚠️ Fail to hold $3.31 = trap & fade to $3.22–$3.18
⚠️ Weak vol = fake out zone
Smart Play:
🎯 Entry: 1H close > $3.31
🛑 Invalidation: < $3.25
📌 Bonus: Strong $3.4222 hit could fuel $3.45–$3.48
Patience > FOMO. The breakout candle will tell the story. 🗝️

#XRP Update #3 – July 18, 2025#XRP Update #3 – July 18, 2025
XRP has surged roughly 28% in its latest impulsive move. Naturally, we now expect a correction phase. Potential retracement levels are:
Level 1: $3.30
Level 2: $3.20
Level 3: $3.10
Pullbacks to any of these levels should not be alarming — they are typical and healthy corrections.
I plan to go Long if XRP bounces from the first correction zone. However, at the moment, I’m just observing, as the current signals are not strong enough to justify entry.
It’s also important to note that there are heavy whale sell orders between XRP’s current price and the $4.00 zone. Breaking through this resistance will likely require strong buy-side volume from large players. Caution is advised.

XRP/USD H1 Educational Market Analysis – Support-Based XRP/USD H1 Educational Market Analysis – Support-Based Long Opportunity
🔍 Structure Overview:
• Support Zone: $3.21 – $3.23
This level has acted as a strong liquidity pool and base for past bullish moves. Price has tapped into it, showing signs of potential demand returning.
• Resistance Zone: $3.65 – $3.70
Acts as a key supply zone, where previous bullish attempts failed. Targeting this area after a rebound is technically sound if structure confirms.
⸻
🔄 Price Action Insights (H1):
• Price broke down through EMAs (20/50/100/200), confirming short-term bearish pressure.
• A rejection wick from support hints at possible absorption of selling pressure.
• If price forms a higher low structure above $3.25 and reclaims EMAs, a potential bullish reversal may unfold.
⸻
🧠 Educational Note:
• H1 charts are ideal for intraday strategies, and this structure provides a clear example of:
• Support-resistance dynamics
• The use of EMAs as trend confirmation tools
• Reversal vs. continuation setups
⸻
🎯 Intraday Bullish Scenario:
• If price holds above $3.21 and breaks above the $3.40 (EMA cluster), bulls may push toward the $3.55290 target.
• This level aligns with the mid-range of the resistance zone, offering scalp-to-swing potential.
⸻
🚫 Bearish Risk:
• Failure to hold $3.21 could lead to a deeper correction toward $3.10 or even $3.00.
• Confirmation of bearish continuation would be a lower high rejection from EMAs without reclaiming them.
⸻
📌 Summary:
On the H1 chart, XRP is at a critical support. Watch for a clean bounce and break above EMAs for a move toward $3.55. However, losing $3.21 could attract further downside. Use price action confirmation before entries.

XRP Inverse Head And Shoulders $2.89 TargetWe've had this sitting here for awhile, but we just confirmed a strong perfect bounce off the neckline signaling another attempt to break through the strong resistance above around $2.50 to get to our $2.89 Target

Is XRP forming a larger inverse H & S fractal pattern?XRP has just punched through the inverse head and shoulders pattern neck line, but I can't help but think this is a smaller part of a larger pattern (marked in white).
Good luck, and always use a stop loss!

XRPUSDT Long by TeamPWRTradesHi all,
XRP Long Idea
Our team has taken small long positions in XRP, we are expecting a bounce to 2.55-2.68 range.
Recommended risk 1-1.5% of portfolio.
Entry 1: 2.2350
Entry 2: 2.26
TP 1: 2.55
TP 2: 2.68
SL: 2.1850
Happy Trading,
TeamPWR

XRPCRYPTOCAP:XRP is at a major turning point at the $2.65 level as we look to push through the 200 EMA. If we get news of the SEC case dropping, Federal Reserves or more positive ETF news we may be on our way towards $3 heading into the weekend.
If we fail this level we may retest the $2.45 support before we head back up.
We are looking more bullish everyday, the time is coming for the switch to be flipped.

2x for xrpusdt or 1/2 ? that's the questionyou can see that xrp has broken the old all time high and did a pullback and it seems that we are waiting for a 150% rally but another scenario is that it may be a fake breakout and it would go back into the wide wide trading range that it has been inside 60% probabilty is in favor of an 150% rally but let's see what would happen

XRP/USDT 1H: Bulls Eye $3.35 After Key Liquidity Sweep !XRP/USDT 1H Chart Analysis
🚀 Follow me on TradingView if you respect our charts 📈Daily new charts!
Current Market Structure:
Bullish trend confirmed after a liquidity sweep at 2.65.
Smart Money Activity: Accumulation phase evident with clear order blocks around 3.12.
Risk Score: 7/10 (favorable setup).
Trade Setup:
Entry Zone: 3.17 - 3.18 (current price).
Targets:
T1: 3.25 (premium zone).
T2: 3.35 (previous high).
Stop Loss: Below 3.11 (recent order block).
Key Observations:
RSI: Bullish divergence forming at 57, supporting upside potential.
Premium Zone: Identified at 3.20 - 3.25.
Market Maker Intent: Targeting liquidity above 3.35.
No bearish divergences present, further supporting bullish bias.
Recommendation:
Long positions favorable within the 3.17 - 3.18 range.
Maintain tight stops below 3.11 to limit downside risk.
Watch for volume confirmation to strengthen confidence in the breakout.
Confidence Level: 8/10 for bullish continuation.
🚀 Follow me on TradingView if you respect our charts 📈Daily new charts!

XRP/USDTThe coin has a globally bullish structure, with local consolidation. After the ATH update, there was no significant pullback. Spot or long from the highlighted zone under suitable conditions
target 1 = 3.21
target 2 = 3.40
