#XRP/USDT (1h) (spot)#XRP
The price is moving within a descending channel on the hourly timeframe. It has reached the lower boundary and is heading towards a breakout, with a retest of the upper boundary expected.
The Relative Strength Index (RSI) is showing a downward trend, approaching the lower boundary, and an upward bounce is anticipated.
There is a key support zone in green at 1.36, and the price has bounced from this level several times. Another bounce is expected.
The indicator is showing a trend towards consolidation above the 100-period moving average, which we are approaching, supporting the upward move.
Entry Price: 1.44
Target 1: 1.47
Target 2: 1.52
Target 3: 1.58
Stop Loss: Below the green support zone.
Remember this simple thing: Money management.
For any questions, please leave a comment.
Thank you.
Xrpshort

#XRP/USDT#XRP
The price is moving within a descending channel on the hourly timeframe. It has reached the lower boundary and is heading towards a breakout, with a retest of the upper boundary expected.
The Relative Strength Index (RSI) is showing a downward trend, approaching the lower boundary, and an upward bounce is anticipated.
There is a key support zone in green at 1.53, and the price has bounced from this level several times. Another bounce is expected.
The indicator shows a trend towards consolidation above the 100-period moving average, which we are approaching, supporting the upward move.
Entry Price: 1.60
Target 1: 1.63
Target 2: 1.67
Target 3: 1.72
Stop Loss: Below the green support zone.
Remember this simple thing: Money management.
For any questions, please leave a comment.
Thank you.

XRP Dips UNDER $2 - Are we Heading BACK TO $1 ??Have you been watching XRP lately?
I was quite surprised that it held above the $2 as long as it did, to be honest.
But now, as the entire market dips, XRP drops... and it is notoriously know to dump and lose all bullish season gains.
Apart from all the controversy, if and I say IF you managed to held the $1 bag up until now - you would be in profit. Buying over $2 would have been high risk, and now we are likely approaching another few key buy zones, depending on where the price finds a bounce. The questions is.... worth it to accumulate or not?
Seeing price action in the 4h under the moving averages is always bearish for the SHORT term, which we do:
The massive wick in July 2025 already indicated the beginning of the bear market, and the lower moving averages is likely where we will find major support - 1.40 ish.

#XRP/USDT (1h) (spot)#XRP
The price is moving within a descending channel on the hourly timeframe. It has reached the lower boundary and is heading towards a breakout, with a retest of the upper boundary expected.
The Relative Strength Index (RSI) is showing a downward trend, approaching the lower boundary, and an upward bounce is anticipated.
There is a key support zone in green at 1.90, and the price has bounced from this level several times. Another bounce is expected.
The RSI is showing a trend towards consolidation above the 100-period moving average, which we are approaching, supporting the upward move.
Entry Price: 1.93
First Target: 1.94
Second Target: 1.97
Third Target: 2.00
Stop Loss: Below the green support zone.
Remember this simple thing: Money management.
For any questions, please leave a comment.
Thank you.

#XRP/USDT XRP (1h) (spot)#XRP
The price is moving within a descending channel on the hourly timeframe. It has reached the lower boundary and is heading towards a breakout, with a retest of the upper boundary expected.
The Relative Strength Index (RSI) is showing a downward trend, approaching the lower boundary, and an upward bounce is anticipated.
There is a key support zone in green at 1.86, and the price has bounced from this level several times. Another bounce is expected.
The RSI is showing a trend towards consolidation above the 100-period moving average, which we are approaching, supporting the upward move.
Entry Price: 1.91
First Target: 1.92
Second Target: 1.95
Third Target: 1.99
Stop Loss: Below the green support zone.
Remember this simple thing: Money management.
For any questions, please leave a comment.
Thank you.

#XRP/USDT XRP (1h) (spot)#XRP
The price is moving within a descending channel on the hourly timeframe. It has reached the upper boundary and is heading towards breaking it. A retest of this boundary is expected.
The Relative Strength Index (RSI) is showing an upward trend, as it has approached the upper boundary. A bearish reversal is expected.
There is a key support zone in green at 2.02. The price has bounced from this zone several times and is expected to bounce again.
A consolidation trend is observed above the 100-period moving average, which we are approaching. This trend supports a decline towards this level.
Entry Price: 2.06
Target 1: 2.10
Target 2: 2.15
Target 3: 2.19
Stop Loss: Above the green support zone.
Remember this simple thing: Money management.
For any questions, please leave a comment.
Thank you.

#XRP/USDT XRP (1h) (spot)#XRP
The price is moving within a descending channel on the hourly timeframe. It has reached the lower boundary and is heading towards a breakout, with a retest of the upper boundary expected.
The Relative Strength Index (RSI) is showing a downward trend, approaching the lower boundary, and an upward bounce is anticipated.
There is a key support zone in green at 2.02, and the price has bounced from this level several times. Another bounce is expected.
The indicator is showing a trend towards consolidation above the 100-period moving average, which we are approaching, supporting the upward move.
Entry Price: 2.06
First Target: 2.10
Second Target: 2.15
Third Target: 2.21
Stop Loss: Below the green support zone.
Don't forget one simple thing: Money Management.
For any questions, please leave a comment.
Thank you.

XRP/USDT – Chart Analysis (Weekly)XRP/USDT – Chart Analysis (Weekly)
XRP has broken out of a multi-year downtrend line → confirming a major trend reversal
Strong impulsive rally after prolonged accumulation
The current price action is a healthy corrective pullback, not a bearish reversal
As long as the higher support zones hold, the structure remains bullish.
Fibonacci Analysis.
(Fibonacci drawn from macro low → to recent high)
0.236 – 2.88 → Strong rejection zone (local top)
0.382 – 2.41 → Supply / Resistance
0.5 – 2.03 → Mid-range level
0.618 – 1.65 → Golden Support Zone
0.786 – 1.11 → Strong demand and last bullish defense
The price is currently trading between 0.5 and 0.618, close to a high-probability demand zone.
Moving Average Confirmation
The price is still above the rising weekly MA (~1.65)
The MA is acting as dynamic support
In a bull cycle, the price often dips below the MA and recovers
As long as the weekly closes remain near/above the MA, the bullish trend remains intact.
DYOR | NFA.

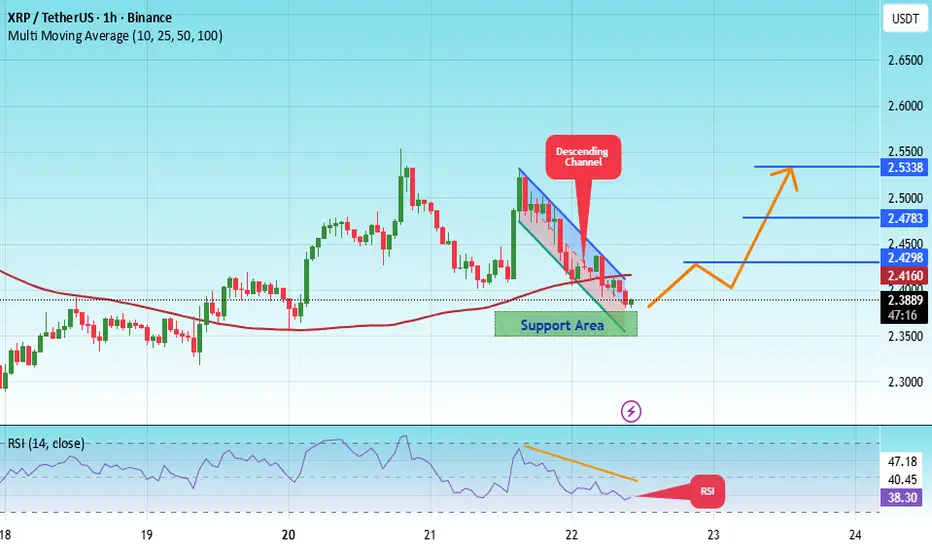
#XRP/USDT (1H) chart, here’s a full technical read:#XRP
The price is moving within a descending channel on the 1-hour frame, adhering well to it, and is heading for a strong breakout and retest.
We have a bearish trend on the RSI indicator that is about to be broken and retested, which supports the upward breakout.
There is a major support area in green at 2.36, representing a strong support point.
We are heading for consolidation above the 100 moving average.
Entry price: 2.38
First target: 2.41
Second target: 2.47
Third target: 2.53
Don't forget a simple matter: capital management.
When you reach the first target, save some money and then change your stop-loss order to an entry order.
For inquiries, please leave a comment.
Thank you.
#XRP/USDT looking extremely bullish#XRP
The price is moving within a descending channel on the 1-hour frame, adhering well to it, and is heading for a strong breakout and retest.
We have a bearish trend on the RSI indicator that is about to be broken and retested, which supports the upward breakout.
There is a major support area in green at 2.93, representing a strong support point.
We are heading for consolidation above the 100 moving average.
Entry price: 2.96
First target: 3.02
Second target: 3.06
Third target: 3.10
Don't forget a simple matter: capital management.
When you reach the first target, save some money and then change your stop-loss order to an entry order.
For inquiries, please leave a comment.
Thank you.

Xrp - Support and resistance & my take profitsThese are my Xrp support and resistance & my take profits. I've been patiently waiting for price to come to me. Now that my T1 has been hit, I'm hoping for a swipe of those lows for my ideal entry. I am cautiously bullish, because there is a chance Xrp goes one leg lower. For now I will chance a long from T1 and T2 (with tight stops) and take profit at my green T1 box.
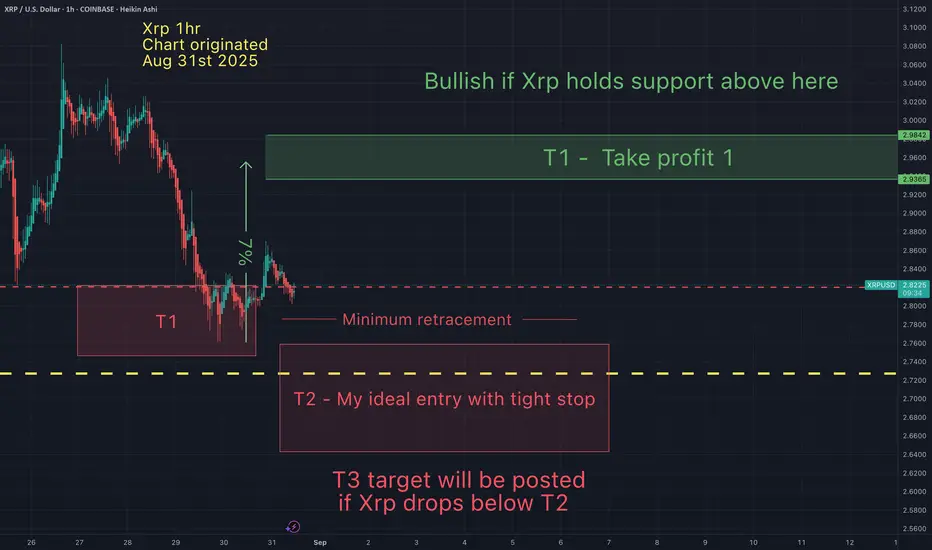
Did Xrp just print a local bottom? My take profit targets...Xrp just put in a local low at $2.9 today and going in heavy on the retrace (off that low) was a good idea. I expect my Bullish T1- take profit zone, to be hit relatively soon. I then anticipate a retrace to my bearish targets. My ideal target will be in my red T2 box. I remain cautiously bullish after Xrp spends some time developing this bottoming range. Lower lows are welcome as the provide excellent re-entry points for me.
May the trends be with you.

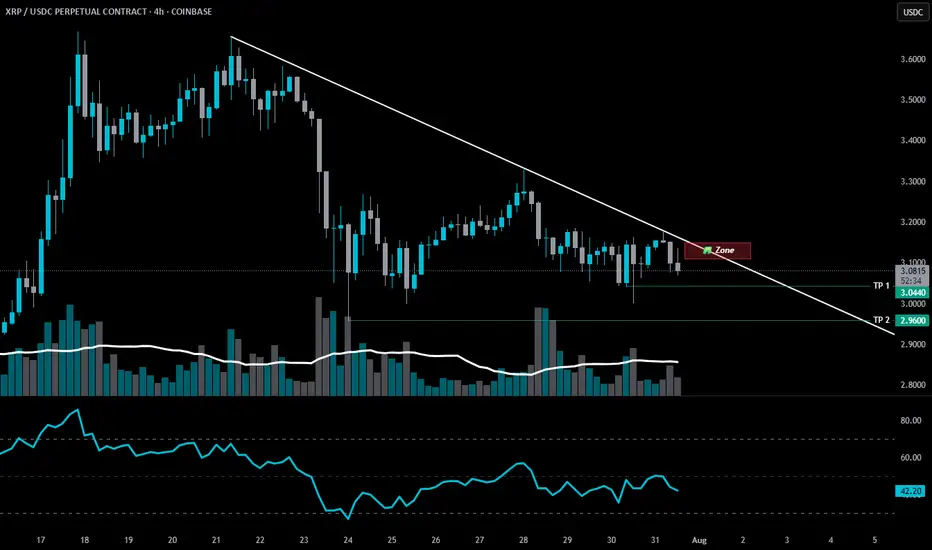
SHORT ZONE-XRP structure shiftThere was an XRP structure shift last week.
📉 It’s been bleeding ever since.
Now, another bearish setup is forming.
If XRP nears that descending trendline and fails to break through — it enters the SHORT ZONE.
🚫 No breakout? No mercy.
This isn’t the end for CRYPTOCAP:XRP — but a purge may be necessary before liftoff.
A proper cleansing to prepare for the next ascension.
🫡 xrpArmy, forgive me…
But hey, feel free to earn your keep.
Stay Sharp. Regulate Yourself.
🚫 100% NOT financial advice.
🎭 Edutainment purpiz only.
XRPUSD - Target reached. Reversal on the plateSo, that was a nice long trade.
Now price is stretched at the Upper Medianline Parallel (U-MLH).
As of the time of writing, I already see price pulling back into the Fork. A open and close within the Fork would indicate a potential push to the south.
Target would be the Centerline, as it is the level where natural Meanreversion is.
Observation Hat ON! §8-)

#XRP/USDT#XRP
The price is moving within a descending channel on the 1-hour frame, adhering well to it, and is heading towards a strong breakout and retest.
We are experiencing a rebound from the lower boundary of the descending channel, which is support at 2.11.
We are experiencing a downtrend on the RSI indicator that is about to be broken and retested, supporting the upward trend.
We are looking for stability above the 100 Moving Average.
Entry price: 2.16
First target: 2.20
Second target: 2.24
Third target: 2.28
XRP DAILY CHART ANALYSISXRP DAILY CHART ANALYSIS 📈
🟩Green lines are “inside trendline” having last interactions with price.
Price did a third touch on the bearish inside trend line yesterday 3rd July @ 2.3157
And current interaction with the bullish “inside trendline” today.
Fundamentally, expect short term USD strength with positive US data as catalyst from yesterday’s release.
Market could extend to closest support @2.1714
If bullish “inside trendline” is broken, we expect support and outer trendline (Black) third touch @2.0181.
If there’s a strong bullish signal convicted to positive XRP or Crypto fundamentals, we expect a bullish move back to at least 2.4
Short term - Bearish 🟥
Medium to long term - Bullish 🟩

XRP 4H SHORTPrice did a trend line third touch on the bearish trendline, which in this case acts as the resistance. Price printed a bearish engulfing pattern signaling a pullback to at least 2.1600 and second target is 2.1100.

XRP Bears Ready to Feast? Short Setup Targets $1.93 With 1.6:1RROn the XRPUSDT 4-hour chart, price action shows a clear rejection of higher levels and a transition to a bearish tone. After rallying up toward the 2.19–2.18 USDT resistance zone, XRP failed to sustain momentum and rolled over sharply. The Supertrend indicator flipped to red, signaling renewed selling pressure.
Currently, the market is retesting the 2.09–2.10 USDT zone, which previously acted as strong support but is now functioning as resistance. This is a classic bearish retest structure, often confirming further downside if price fails to reclaim the level decisively. Beneath the current price, the most significant support area rests near 1.93 USDT, where buyers previously defended with strong volume.
This backdrop supports a short-biased trade setup. The ideal entry would be around 2.09–2.10 USDT, where the market is testing the broken support as resistance. The stop loss should be positioned just above the prior swing high and the top of Resistance Level 2, at 2.19 USDT. If the rejection holds, the take profit target aligns with the clear structural support around 1.93 USDT. This setup offers a risk of roughly 0.10 per XRP and a potential reward of about 0.16, maintaining a sound risk-reward profile near 1.6:1.
While a bullish reversal is possible if XRP can reclaim 2.19 USDT on a strong daily close, current price action and trend signals favor sellers in the near term.

Get Ready To Load Up For The Upcoming Institutional Altseason! Since the explosive high of $3.40 on Jan 16, 2025 📈, XRP has been sliding inside a persistent downward channel 📉. The trend remains bearish, with bulls struggling to break resistance at every turn.
Today, XRP trades near $2.04, but momentum is weak and the channel shows no signs of reversal yet. If this bearish pressure continues, a drop toward the $1.49 level is on the table—a zone that could offer a textbook buying opportunity for patient bulls! 🛒🔥
🔻 Key Chart Signals:
Downward channel intact since Jan 16, 2025 📆
Lower highs & lower lows dominate the structure 📉
$1.49 is a major support & potential reversal zone 🛑
👀 Strategy: Let the bears do their work. If XRP dips to $1.49, get ready to load up for the upcoming Institutional Altseason! 🚀

XRP | SHORT CRIPPLE to $2XRP is currently trading BEARISH, since we're seeing a trade right on top of the current support level.
The more times a support level is testes, the weaker it becomes. Therefore, the current support may break and then it's a free-fall to $2.
Additionally, with the price trading UNDER the moving averages in the 4h, we can confirm a bearish sentiment from a technical indicator perspective.
With a fairly tight SL, and a modest TP, the risk is low with this short setup:
___________________
BINANCE:XRPUSDT

XRP Back on the MENU! XRPUSD Ripple next move? XrpUsdtIt's been a while since we looked at this chart.
🌍 SeekingPips 🌎 View remains the same and so we are strictly looking for strategic LONG entry points in
TIME & PRICE. 👌
Yes it's a WEEKLY chart and I understand that many of the trigger happy TRADERS or in some cases GAMBLERS can't stand to look at anything longer than a 30 minute chart BUT really sometimes you really just have to STEP RIGHT BACK to see the BIGGER PICTURE👍
✅️This week's candle CLOSE really has the potential to setup the next few weeks for easy MULTIDAY TRENDING MOVE TRADE SETUPS 👍
ℹ️ Note the price location on what we viewed as a HTF FLAG MANY WEEKS AGO .
Yes it was breached both sides but 🌎SeekingPips🌍 doesn't trade the patterns themselves but the HUMAN PSYCHOLOGY AROUND THESE PATTERNS.🤔
ℹ️ Note where most of the volume has been trading and also note the moves around the extreems of the dead patteren too.💡
In an even higher TIMEFRAME THE FLAG would still be valid and forming the flag itself too.
📊 [ b]CHECKOUT the MONTHLY chart for the example. 📉
Anyway we will see what the next 48 hours🕦 hold but no doubt this one is on our RADAR this week.
✴️ 2.048 to hold otherwise a potential for current low of this year to be tested.
✴️ Alternatively if support starts to form on the 240min chart at current levels last weeks high could expected to be tested
✴️ if so Xrp could easily give a multiday upside trending move.
Now like a NINJA we wait and stalk...
As always ladies and gentlemen whilst Seeking Pips 🌍 SeekingPips 🌎 says
" NO TRIGGER NO TRADE"
& "STICK TO YOUR PLAN"✅️
👍 Have a GREAT WEEK and we will see you soon with an UPDATE...

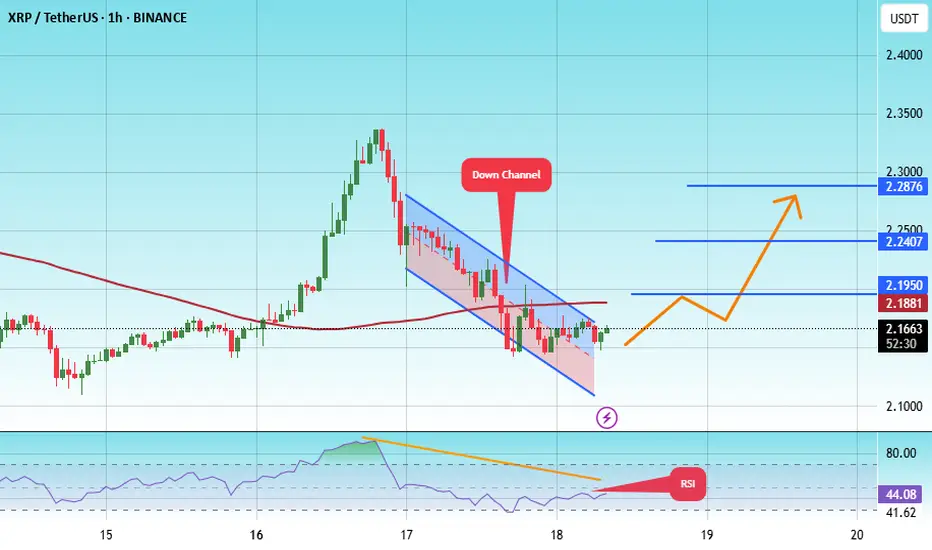
#XRP/USDT#XRP
The price is moving within a descending channel on the 1-hour frame, adhering well to it, and is heading for a strong breakout and retest.
We are seeing a bounce from the lower boundary of the descending channel, which is support at 2.29.
We are seeing a downtrend on the RSI indicator that is about to break and retest, supporting the upward trend.
We are looking for stability above the 100 Moving Average.
Entry price: 2.30
First target: 2.33
Second target: 2.37
Third target: 2.42

XRP back to $0.75 ??if the bounce will continue going up i am looking for a short position... all the way down to $0.75 and slightly lower. YES IT IS POSSIBLE!. on the weekly candles there is a huge FVG and also the projected move from the range where XRP now trades in is at $0.75
letst see what it does the coming weeks/months.
// LOW LEVERAGE \\ (max 5x)
short entry 2.275
stoploss 2.65
take profit 0.75
