XRP Eyes Rebound Amid Bearish PressureFenzoFx— Technical indicators show oversold conditions and bullish divergence in momentum. As a result, we expect a potential rebound toward higher resistance levels before the broader downtrend resumes.
In this scenario, XRP could rise toward $2.2230, then pull back to $1.9220, with major sell-side liquidity resting at $1.7710.
Xrpsignals
XRP: Accumulation Zone Supports Short-Term UpsideFenzoFx—XRP (Ripple) is under selling pressure, down 0.50% today, trading near $2.309. The daily chart shows accumulation, suggesting sideways momentum may continue. Open interest supports this phase, with strong support between $2.072 and $2.223.
XRP could rise slightly, potentially revisiting $2.456. If resistance at $2.456 holds, a bearish wave may follow, targeting $2.072. Continued selling pressure could push the price toward the liquidity void at $1.922.
XRPUSD Has it started its Bear Cycle already?XRP (XRPUSD) has been trading within a Channel Up ever since the March 09 2020 bottom of the COVID flash crash. Even though the recent Bull Cycle didn't hit the pattern's Top (Higher Highs), signs have emerged that the new Bear Cycle may have started.
The most obvious of those are the break (and closing) below the 1W MA50 (blue trend-line). Last month's flash crash even touched the 1W MA100 (green trend-line) before immediately recovering.
Most importantly, XRP already filled the 2.5 Fibonacci extension level with its July 14 2025 All Time High (ATH), which is exactly where the High of the previous Cycle was priced (April 12 2021). What followed afterwards, especially when it closed a week below the 1W MA50 (November 29 2021) is very similar to what has been taking place in the past 3 months (especially with the 1W MA50 break 30 days ago) and the similarities between the 1W RSI patterns further justify it.
As a result, since the 2022 Bear Cycle bottomed on the 1M MA100 (red trend-line) and just below its 0.618 Fibonacci retracement level, we expect the current to do the same and target $0.9000 (Fib 0.618). An additional indicator that may help at identifying the bottom (hence a good level to start buying again), is when the 1W RSI breaks below its 30.00 oversold barrier.
-------------------------------------------------------------------------------
** Please LIKE 👍, FOLLOW ✅, SHARE 🙌 and COMMENT ✍ if you enjoy this idea! Also share your ideas and charts in the comments section below! This is best way to keep it relevant, support us, keep the content here free and allow the idea to reach as many people as possible. **
-------------------------------------------------------------------------------
💸💸💸💸💸💸
👇 👇 👇 👇 👇 👇
XRP Eyes $2.072 if Support BreaksFenzoFx—XRP is down 3.30% today, trading around $2.2330. Immediate support lies at $2.2230, backed by the anchored VWAP. So far, the price hasn’t closed below this level on the daily chart.
Technically, a close beneath VWAP could trigger further downside toward $2.072. If selling pressure continues, the next support is $1.922. The market outlook remains bearish while XRP trades below the descending trendline.
XRP Rejected at Key ResistanceFenzoFx—XRP failed to close above the $2.6480 resistance on Monday, dipping 6.00% to $2.5460, just above the bullish fair value gap. A momentum divergence confirms the strength of the $2.6480 resistance zone, highlighted in grey on the daily chart.
From a technical standpoint, XRP may trade lower toward $2.430, supported by the ascending trendline. If selling pressure persists, further downside targets include $2.224 and $2.073.
The bearish outlook remains valid as long as XRP/USD trades below the descending trendline. October 10’s long lower wick also suggests a gap that may attract price to fill, reinforcing the bearish scenario.
XRP Holds Gains Amid AccumulationFenzoFx—XRP (Ripple) is up 3.0% today, trading at $2.464 above the 8-period SMA. Rising volume suggests accumulation. If the price holds above $2.318, XRP/USD may target $2.6480. Continued buying pressure could invalidate the downtrend and open the path to the next liquidity zone at $2.956.
However, if the price drops below $2.3180, the bullish scenario is invalidated and accumulation may extend toward the $2.000 psychological level. Traders should monitor support levels closely as momentum builds.
XRPUSD Bearish Cross pushing it down to $1.9350 t least.XRP (XRPUSD) has been trading within a Channel Up for almost 1 year (since November 26 2024) and just before last Friday's flash crash, it formed a 1D MA50/100 Bearish Cross. This came after the pattern has already started its 2nd Bearish Leg (red Channel).
The last 1D MA50/100 Bearish Cross was formed post half-way through the previous Bearish Leg and resulted into a bottom just below the 0.786 Fibonacci retracement level. Since there are no news in the market that can drastically alter the bearish sentiment following the renewed U.S. - China trade tensions, we have no reason to expect that the current Bearish Leg won't reach again the bottom of the Channel Up at least.
Our Target is therefore 1.9350 (marginally below the 0.786 Fib). If the Bearish Leg repeats the % drop of the previous one (-52.42%), it can even break to 1.7500 (still within the Channel Up on a logarithmic scale). A break above the 1D MA100 (green trend-line) would invalidate this bearish structure.
-------------------------------------------------------------------------------
** Please LIKE 👍, FOLLOW ✅, SHARE 🙌 and COMMENT ✍ if you enjoy this idea! Also share your ideas and charts in the comments section below! This is best way to keep it relevant, support us, keep the content here free and allow the idea to reach as many people as possible. **
-------------------------------------------------------------------------------
💸💸💸💸💸💸
👇 👇 👇 👇 👇 👇
XRP Faces Bearish Gap PressureFenzoFx—Ripple (XRP) lost its bullish bias after dipping below $2.940 support, triggering a bearish fair value gap on the 4-hour chart. Selling pressure eased near $2.796 liquidity void, where volume dropped sharply—signaling reduced momentum and potential consolidation.
Technically, XRP/USD may consolidate toward $2.9570, the mean threshold of the bearish gap. If price holds below this level, a new downtrend could emerge, targeting the equal lows at $2.690. Please note that the bearish outlook remains valid unless XRP forms a new higher high.
XRPUSD getting ready for its NOW-or-NEVER moment to $8.500XRP (XRPUSD) has been trading sideways since the July 14 2025 High in a growth pattern that resembles 2017. As it approaches the 1W MA50 (blue trend-line), the market gets closer to its now-or-never moment as the 1W MA50 is expected to hold and provide a bullish boost similar to December 11 2017, which made the price rally to its 1.5 Fibonacci extension.
With even the 1W RSI sequences among the two fractals also looking identical, we can see XRP peaking around $8.500 (Fib 1.5 ext), if this model repetition is completed.
-------------------------------------------------------------------------------
** Please LIKE 👍, FOLLOW ✅, SHARE 🙌 and COMMENT ✍ if you enjoy this idea! Also share your ideas and charts in the comments section below! This is best way to keep it relevant, support us, keep the content here free and allow the idea to reach as many people as possible. **
-------------------------------------------------------------------------------
💸💸💸💸💸💸
👇 👇 👇 👇 👇 👇
XRP/USDT: Bullish Momentum Builds After Breakout from CompressioXRP/USDT has rebounded off the 2.8765 zone, aligning with the upward trendline and breaking out of its compression structure, signaling renewed bullish momentum. The price is now pushing toward resistance near 3.15, a zone where previous tops have formed.
A sustained hold above 2.90 would reinforce the bullish outlook and support a continuation toward the resistance zone. While momentum remains constructive, the structure indicates that buyers still need confirmation through strength at higher levels.
XRPUSD Is $5.00 next??XRP (XRPUSD) has been trading within a Channel Up since the April 07 'Trade War' market bottom and in the past 6 days it has been testing (and holding) the 1D MA50 (blue trend-line) as a Support.
Given that this is being done after the Bearish Leg bottomed (green Arc pattern) on the 1D MA100 (green trend-line), this 1D MA50 test is probably the last technical confirmation that the current Bullish Leg needs before it starts rising aggressively, similar to what happened in July.
That Bullish Leg peaked on the 2.0 Fibonacci extension level. If this sequence is repeated, expect the next high to be around $5.00.
-------------------------------------------------------------------------------
** Please LIKE 👍, FOLLOW ✅, SHARE 🙌 and COMMENT ✍ if you enjoy this idea! Also share your ideas and charts in the comments section below! This is best way to keep it relevant, support us, keep the content here free and allow the idea to reach as many people as possible. **
-------------------------------------------------------------------------------
💸💸💸💸💸💸
👇 👇 👇 👇 👇 👇
XRPUSD: Buy the Dips Above 2.90, Target the ATHAfter printing a new all-time high at the end of July, COINBASE:XRPUSD entered a correction phase that bottomed in early September around 2.70.
From there, the rebound was strong: price broke above the falling trendline and, even more importantly, reclaimed the 3.00 psychological level.
Looking at the broader chart structure since June, the picture is constructive and it’s reasonable to expect further upside — potentially a retest of the previous ATH, or even the making of a fresh one.
📈 Bias: I remain bullish on XRP as long as price holds above 2.90.
🎯 Trading Plan: The strategy here is to buy dips, with the old ATH as the first big target.
XRP: Bullish Setup Forms Above $2.833FenzoFx—XRP extended its downtrend to the August low of $2.727, briefly sweeping below. On the 4-hour chart, three equal highs at $3.105, $3.145, and $3.348 suggest a bullish setup. Immediate resistance sits at $2.833.
A bullish wave may emerge if this level is engulfed with a fair value gap, targeting $2.915. A strong exit above $2.195 could push toward $3.105 and $3.145.
XRP: Key Support at $2.72 Holds Bullish OutlookFenzoFx—XRP (Ripple) broke its bearish structure with a strong engulfing pattern on August 7 and is now consolidating near $3.00. This level is supported by a bullish order block, with immediate support at $2.90.
The 4-hour chart shows equal highs at $3.66, marking a liquidity target. Immediate resistance lies at $3.09, and a close above this level could resume the uptrend.
XRP Holds Support: Eyes Break Above $3.31FenzoFx—XRP (Ripple) holds above the fair value gap (FVG), with key support at $3.11. Technically, the uptrend may resume if XRP closes and stabilizes above $3.31, supported by a bullish FVG on lower time frames like M10 or M15.
If this scenario unfolds, the next bullish target is the order block with highs at $3.56.
XRP's Failed Structure Break Signals Further ConsolidationFenzoFx—XRP/USD currently trades around $3.045 in a low-momentum market. Stochastic exited the overbought zone and is declining, signaling strengthening bearish momentum. The failed structure break in the New Session suggests a liquidity sweep with weak bullish interest.
Immediate resistance stands at $3.091. Technically, price is expected to decline toward the previous day's low at $2.931, a key liquidity zone. Please note that the bearish outlook is invalidated if price exceeds $3.091.
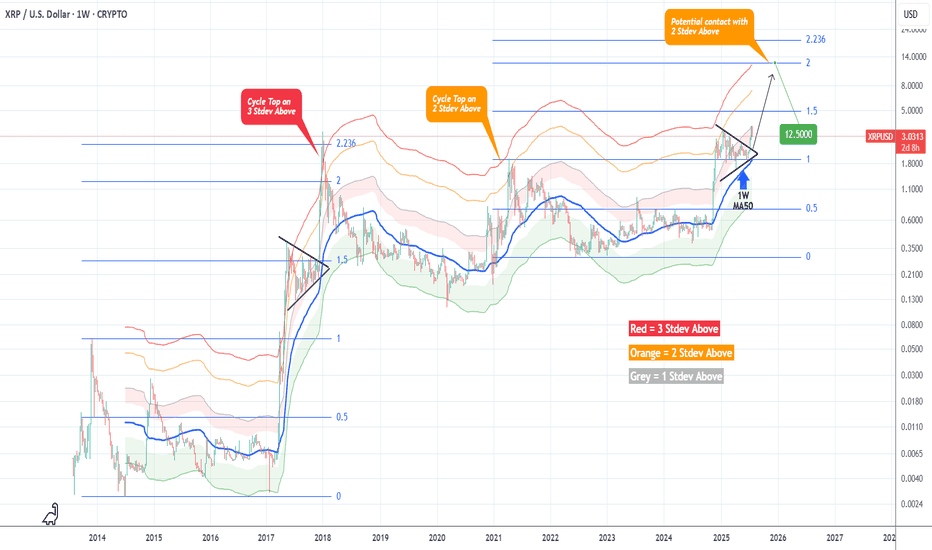
XRPUSD Massive break-out that can Top at $12.500XRP (XRPUSD) got out of its Accumulation Triangle (December 2024 - June 2025) making an aggressive break-out similar to the December 2017 one, which was after an identical Triangle pattern.
The fractals are so comparable that both mostly traded within the 1W MA50 (blue trend-line) and the Mayer Multiple (MM) 2 Stdev Above (orang trend-line).
As you can see, that MM trend-line was where the Top of the previous Cycle (April 2021) was priced and the one before was above the 3 Stdev Above (red trend-line).
Assuming that this Cycle will also go for the 'minimum' 2 Stdev Above test, it can make that contact by the end of the year on the 2.0 Fibonacci extension (Cycle Top-to-bottom) at $12.500.
-------------------------------------------------------------------------------
** Please LIKE 👍, FOLLOW ✅, SHARE 🙌 and COMMENT ✍ if you enjoy this idea! Also share your ideas and charts in the comments section below! This is best way to keep it relevant, support us, keep the content here free and allow the idea to reach as many people as possible. **
-------------------------------------------------------------------------------
💸💸💸💸💸💸
👇 👇 👇 👇 👇 👇
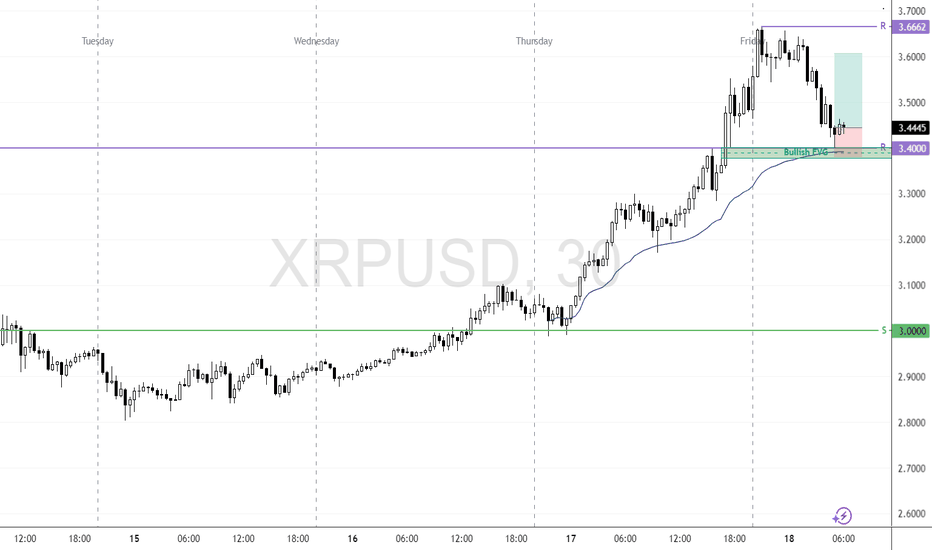
XRP Retests Previous All-Time High as Bullish Setup DevelopsFenzoFx—XRP (Ripple) is tested and has stayed above $3.40, the previous all-time high. This level acts as support, backed by the VWAP from Thursday's low and the bullish FVG.
If this level holds, we expect the cryptocurrency to aim higher, targeting $3.60, followed by $3.66.
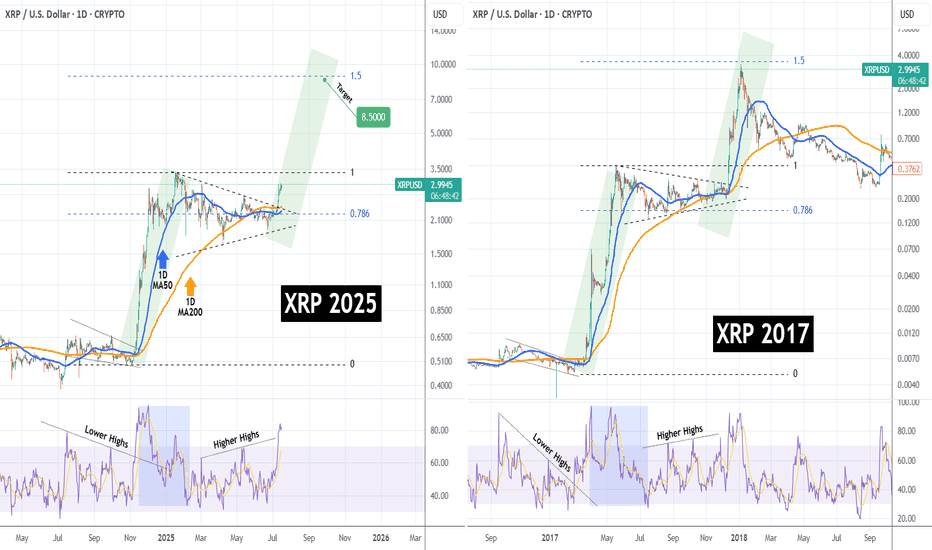
XRPUSD Has it started the mega rally to $8.500??XRP (XRPUSD) has been trading within a Triangle pattern for the past 6 months (January - July 2025) and only recently, it broke to the upside. Ahead of a pending 1D Golden Cross, this pattern is no different than the one of the previous Cycle from May - December 2017.
That setup resulted into the final Parabolic Rally of the Cycle that peaked just below the 1.5 Fibonacci extension. As you can see, both fractals are identical even from their starts, both initiated after a Falling Wedge that produced the first Parabolic Rally (green), which transitioned into the Triangle we described. Even their 1D RSI sequences are similar.
As a result, it is more than probable to see XRP hit $8.500 (Fib 1.5 ext), by the end of the year.
-------------------------------------------------------------------------------
** Please LIKE 👍, FOLLOW ✅, SHARE 🙌 and COMMENT ✍ if you enjoy this idea! Also share your ideas and charts in the comments section below! This is best way to keep it relevant, support us, keep the content here free and allow the idea to reach as many people as possible. **
-------------------------------------------------------------------------------
💸💸💸💸💸💸
👇 👇 👇 👇 👇 👇
XRP: Break Above $2.338 Opens Path to $2.480FenzoFx—Ripple (XRP) eased near weekly highs of $2.338, with Stochastic and RSI 14 signaling overbought conditions. The trend stays bullish above the anchored VWAP or $2.165, but consolidation toward $2.2240 is expected before resuming.
A break above $2.338 would target the next supply zone at $2.480.
XRPUSD This rare signal can send it to $12.5 end of the year.XRP has been practically ranging since the start of the year following the immense rally after the U.S. elections last November. This is technically a Re-accumulation phase supported by the 1W MA50 (blue trend-line), similar to May - November 2017 of XRP's 1st Cycle.
The strong signal that makes this correlation more relevant is the 1M RSI peak above 80.00 and correction back below the oversold barrier (green ellipse), which is identical on both fractals. Also they both took place just below the 1.5 Fibonacci extension level.
The 2017 Re-accumulation, held its 1W MA50 as Support and eventually pushed for one final parabolic rally within the 2.0 - 2.236 Fib range, before the Cycle topped.
As a result, we expect XRPUSD to hit $12.5 by the end of this year.
-------------------------------------------------------------------------------
** Please LIKE 👍, FOLLOW ✅, SHARE 🙌 and COMMENT ✍ if you enjoy this idea! Also share your ideas and charts in the comments section below! This is best way to keep it relevant, support us, keep the content here free and allow the idea to reach as many people as possible. **
-------------------------------------------------------------------------------
💸💸💸💸💸💸
👇 👇 👇 👇 👇 👇
XRPUSD Don't miss this rally to $12.500Last time we analyzed XRP (November 16 2024, see chart below), we called the start of the new Parabolic Rally of the Cycle:
As you can see it couldn't be more timely, as the rally started on the aggressive mode of 2017 and easily broke above last Cycle's Top. Since the 2017 is the path it chose, we take a closer look today between the two Cycles in order to formulate the next Target.
XRP's 2017 Cycle is characterized by three separate rallies and amazingly enough, all three have been of around +1300%. Assuming the 2025 rally phase holds the same degree of symmetry among its different rallies, we can assume that since November - January has shown a +600% rise roughly, we should be expecting the new that is starting to be of the same % increase.
This gives us a $12.500 Target.
-------------------------------------------------------------------------------
** Please LIKE 👍, FOLLOW ✅, SHARE 🙌 and COMMENT ✍ if you enjoy this idea! Also share your ideas and charts in the comments section below! This is best way to keep it relevant, support us, keep the content here free and allow the idea to reach as many people as possible. **
-------------------------------------------------------------------------------
💸💸💸💸💸💸
👇 👇 👇 👇 👇 👇
XRP Analysis==>>Correction Signs!!!XRP ( BINANCE:XRPUSDT ) is moving in the Resistance zone($2.63-$2.50) .
In this post, I want to show you some signs that XRP may still need to be corrected in a one-hour time frame :
1 -Regarding Classical Technical Analysis , XRP seems to have succeeded in forming the Rising Wedge Pattern .
2 -The formation of the Evening Star Candlestick Pattern in the Resistance zone can signify the reverse of XRP .
3 -The formation of the Bearish Gartley Harmonic Pattern can also be another sign of the decline of XRP .
4 -According to Elliott wave theory , XRP seems to be completing the main wave 4 .
I expect XRP to break the lower line of the Rising Wedge Pattern , which should drop to at least $2.38 . If the Support line is broken, the next target will be the Support zone($2.25-$2.17) .
⚠️Note: If XRP manages to break the Resistance zone($2.63-$2.50), we can expect an XRP pump.⚠️
XRP Analyze (XRPUSDT), 1-hour time frame⏰.
🔔Be sure to follow the updated ideas.🔔
Do not forget to put Stop loss for your positions (For every position you want to open).
Please follow your strategy and updates; this is just my Idea, and I will gladly see your ideas in this post.
Please do not forget the ✅' like '✅ button 🙏😊 & Share it with your friends; thanks, and Trade safe.


