XRP, Ripple - look when I bought and what I'm waiting forI opened a buy position in 0.68. It was a great time to buy because of dramatically dropping in the whole market. With this drop, we showed how strong the zone 0.2- 0.6 is. On the chart, u can see a big accumulation there. Now I keep hold and wait for growth to 1.2 zones. Let's see what happened. I'm willing on another scenario. It's market and I'm not God
Write in the comments all your questions and instrument analysis of which you want to see.
Friends, push the like button, write a comment, and share with your mates - that would be the best THANK YOU.
P.S. I personally will open entry if the price will show it according to my strategy.
Always make your analysis before a trade
Xrpsignals

RIIPLEReboud day yesterday for XRP, which I hope to continue today. The day started well, on the green. Long prediction for XRP

XRP: Bitcoin🦍Gorilla Short Predictxn of $0.6 Still n Play b4 $6
Here is a clear update on what you should expect from XRP moving forward.... We are close to a very strong support area, Our TA On short has been Since May 5th and we are still riding but mind you that we are close to my TA, Please watch the video analysis here
Someone asked in the comment section if the current dump affect my $6 TA on XRP?
My answer is No, All our analysis is still in play, my first prediction of 0.8 to 0.6 will Was in April,
I further Elaborated this In another analysis video, where I talked about how XRP will beat Doge pump soon after we see a strong pullback to 0.8 area to 0.6 but first why you must wait to buy cheaper XRP at $0.66. Now we are close and I do see a possible bounce coming very soon on this support area.
It is most likely we see a sideways movement when XRP Arrives at this support. The pump in our Last analysis is only showing you the possible TA To expect after we have actualize the short TA we are still currently in(It will be a good idea to start taking profit from your shorts from here)
Let's Dive deeper into what we can expect, Tomorrow sunday has high chances of being a dump day to hit this our support, Next week will likely show some green.
Looking at the 4hrs Chart,
We can expect some buy reaction ones in this area $0.8 to $0.6 area
Here it will be good in my opinion to take some good profit off short.
The bounce from this $0.8 to $0.68 zone as a retest of the current 4hrs chart buyers trendline which could lead as far as $1.3 to $1.5 but here too XRP bulls will be shorted down to 0.88 to 0.82 support zone.
I do expect another strong attack on that sellers line, this time forming a lower high at around 1.3 to 1.22 and a higher low too.
This is where we can expect a breakout to happen.
BITCOIN GORILLA, WHAT IF THE BEARS END UP BREAKING THE CURRENT DAILY SUPPORT BUYERS TRENDLINE?
Ans: Everything is possible in crypto, so yes the possibility of breaking the support is there, but that chances is less than 45% because of the weekly chart current support. But I do see I high chances of stoploss hunt happening, by the candles piecing through the trendline but instantly get rejected by the next candle and price pulls back above the line in a swift blink of an eyes after clearing the previous low and stoploss.
In my Opinion Patients is required here when we get to that support, There will be a bounce but then a quick pull back to retest the support of that 0.55 but idf the whole crypto market keep selling off then it will be hard to not see the 0.4 to 0.2 support but all these will only lead to a very strong pump to my $6 TA

XRP, Ripple - false breakout has happened. What's next?Yesterday, the price made a false breakout oh key level 0.8883 and bounced from it. Now the best scenario for Ripple is building a local trendline with squeezing to it. If it happens, it will be a good pattern for a breakout.
Write in the comments all your questions and instruments analysis of which you want to see.
Friends, push the like button, write a comment, and share with your mates - that would be the best THANK YOU.
P.S. I personally will open entry if the price will show it according to my strategy.
Always make your analysis before a trade

RIPPLEAfter a beautiful evolution yesterday, XRP meets a fairly strong zonal resistance. If he manages to get past it, he can advance to the previous maximum. Long XRP prediction today!

XRP, Ripple - a price is closer to support. What's next?Friends, as you can see the price is near the support level of the larger triangle. Now is a good time to buy But!!! only with Sl below the level. It's not clear whether bitcoin will go for a third fall. So don't rule out the possibility of falling Ripple also. I repeat, if you wanna enter - do it only with a SL.
Write in the comments all your questions and instruments analysis of which you want to see.
Friends, push the like button, write a comment, and share with your mates - that would be the best THANK YOU.
P.S. I personally will open entry if the price will show it according to my strategy.
Always make your analysis before a trade

I ANALYZE FOR YOUR COMFORT - XRPHigh azimuth consolidation movement for XRP. Probable long direction that will be triggered possibly in the coming days.
If you appreciate my analysis please like and follow. If you want other tools analyzed, leave their names in the comments, and in the next hour I will publish the analysis. Everything on green !!

XRP is having a good chance to be longed 30/01/2021i believe Ripple is giving us an other chance to get along it
it seems that the market has done its accumulation Phase and currently getting itself ready for the next upraise
we have used Price action analysis in order to specify the Supply and Demand zones and Fibonacci Projection to project the next Target areas
we have specified the growth and forecasted it on the chart by Fibonacci time zone tool
please comment your opinions

XRP What's next after the Resistance break-out?XRPUSD finally broke above last November's 0.8400 Resistance and is now forming new dynamics. That sharp move came after the price broke above the Triangle as shown on my previous idea:
This break-out means a lot to XRP holders as it not only opens the way for its new and potentially very aggressive Parabolic Rise, but also validates what we believed was a great buy opportunity back in December 2020 when the whole market was in panic mode:
What lies ahead for Ripple largely depends on how the price will do on certain Fibonacci levels. The obvious pattern is a Channel Up on 1D and the current rejection is not only a direct consequence of the previously overbought 1D RSI (see how it almost hit the 1 year Resistance Zone) but also because it hit the Higher Highs trend-line of the Channel Up.
It is possible to see the former Resistance Zone of 0.8400 - 0.7700 become a Support (as part of the pivot process). Those two Resistance levels are important not just because they caused those sharp rejections on Nov 24, 2020 and Feb 01, 2021, but also because those two place on the 2.382 and 1.382 Fibonacci extension levels of the Channel Up respectively. As the Channel Up unfolds, it can be argued that those two Fib extensions may be turned into XRP's parabolic Resistances.
The question is, if this sequence is progressive, will the 3.382 Fib ext play any role in the future or is it far fetched to think so? Feel free to share your work and let me know in the comments section!
Please like, subscribe and share your ideas and charts with the community!
--------------------------------------------------------------------------------------------------------
!! Donations via TradingView coins also help me a great deal at posting more free trading content and signals here !!
🎉 👍 Shout-out to TradingShot's 💰 top TradingView Coin donor 💰 this week ==> hujianghua
--------------------------------------------------------------------------------------------------------
P.S. Honorable mention Bill Chasap

XRPUSD Trade the Triangle break-outPattern: Triangle on 1D.
Signal: (A) Buy if the Lower Highs trend-line breaks (B) Sell if the Higher Lows trend-line breaks.
Target: (A) 0.7500 (below the Resistance), (B) 0.2700 (above the Support).
Don't lose sight of the long-term picture on XRP. Below is my late December 2020 post calling for a buy opportunity when the prevailing sentiment under the legal pressure on Ripple was very bearish:
** Please support this idea with your likes and comments, it is the best way to keep it relevant and support me. **
--------------------------------------------------------------------------------------------------------
!! Donations via TradingView coins also help me a great deal at posting more free trading content and signals here !!
🎉 👍 Shout-out to TradingShot's 💰 top TradingView Coin donor 💰 this week ==> xBTala
--------------------------------------------------------------------------------------------------------

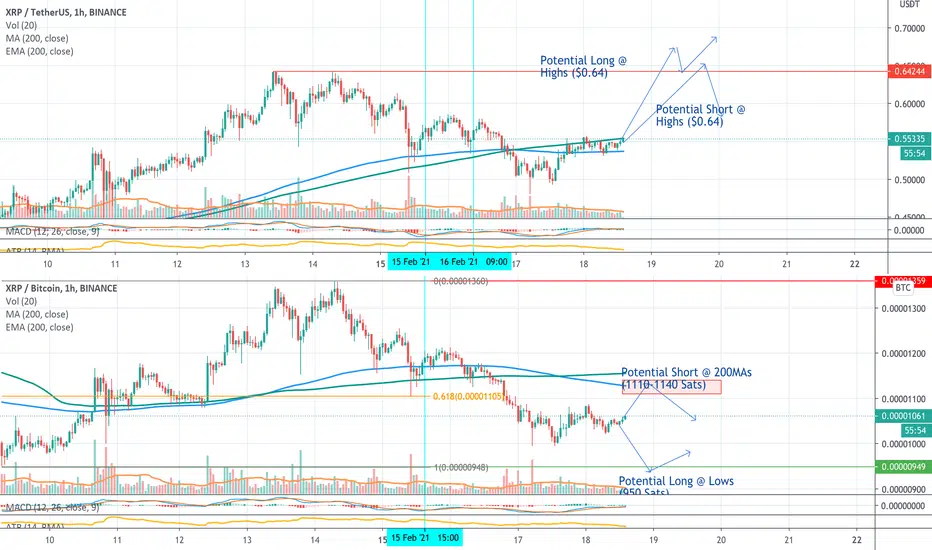
RIPPLE (XRPUSDT/XRPBTC) Daily Trade Setups 2021/02/18Hi guys! I will be sharing the trades that I take in real time, follow to see how my trades work out!
If you like this post, please support me by clicking the like and follow buttons. Also feel free to share your thoughts and analysis in the comments below!
And don’t forget to check out my daily analysis on Bitcoin & Ethereum!
Trade Setups
Below are the potential trade setups that I would be interested in trading:
XRPUSDT
Long Trade Setup #1: Breakout and Continuation
1. Price Action: Price breaks above and falls back down to $0.64 and bounce back up.
2. Trade Entry Confirmations: Bullish candlestick pattern, above average volume, MACD bottoming
Short Trade Setup #1: False Breakout
1. Price Action: Price breaks above and then falls below the high @ $0.64, forming a bull trap
2. Trade Entry Confirmations: A breakout candlestick followed by a breakdown candlestick, above average volume on both breakout candle and breakdown candle, MACD topping out
XRPBTC
Long Trade Setup #1: False Breakdown
1. Price Action: Price breaks below the then rapidly climbs above 950 Sats, forming a bear trap
2. Trade Entry Confirmations: A breakdown candlestick followed by a reclaiming candlestick, above average volume on both breakdown candle and reclaiming candle, MACD bottoming
Short Trade Setup #1: Retest and Continuation (200MAs)
1. Price Action: Price needs to move back up to the 200MAs, currently projected to be @ 1110-1140 Sats by the time price reaches it, and bounce back down.
2. Trade Entry Confirmations: Bearish candlestick pattern, above average volume, MACD topping out
About Me
I started trading in 2008, first got introduced to bitcoin in 2009, and have been actively trading cryptocurrencies since 2016.
I have worked on Wall Street trading bonds, stocks, and options.
I have taken hundreds of live trades, each recorded with over 50 data points, all meticulously analyzed, using data analysis and modeling to optimize win probability and risk reward.
Why Follow Me
Daily analysis on the latest market movements and price zones for high probability trade setups.
Sharing of live trades that I take.
A great place to help each other, learn from each other, and grow together.
Trading education including a comprehensive cryptocurrency trading eBook, personal advice, and other educational materials
Constantly testing and adding new trading strategies and refining battle-tested ones.
DISCLAIMER: I am NOT a financial advisor and this post is NOT financial/investment/trading advice. I will not be responsible for any actions you take based on the analysis and comments that I provide. I am simply sharing what I am doing, and is not meant to be investment or trading advice. What you choose to do with the information that I provide is your own sole responsibility! The cryptocurrency market is extremely volatile, and you WILL lose all your money if you are inexperienced! DO NOT risk any money that you cannot afford to lose and always be cautious and manage your risk!
Please support me by liking and following, and sharing your ideas and analysis in the comments! Thanks!
XRPUSD Great opportunity could be a little lowerA lot of talk is being done lately on XRP and its recent sharp sell-off that took most traders by surprise. This panic selling is fundamentally driven by the recent news and I believe the tension isn't over yet.
Today I want to focus on the technicals though and the 1W chart. This shows that long-term XRP investors shouldn't panic and this selling was also seen on the previous cycle. In fact it was the last before the massive rally of 2017.
In my opinion there is an opportunity to buy XRP even lower (the current price is good enough as it is for long-term investors), either within the 0.786 - 0.9 Fibonacci retracement level or within the LMACD Buy Zone.
History will repeat itself. Keep a clear head and follow your investment plan.
** Please support this idea with your likes and comments, it is the best way to keep it relevant and support me. **
--------------------------------------------------------------------------------------------------------
!! Donations via TradingView coins also help me a great deal at posting more free trading content and signals here !!
🎉 👍 Shout-out to TradingShot's 💰 top TradingView Coin donor 💰 this week ==> TradingView
--------------------------------------------------------------------------------------------------------

How to trade XRP. 3 Best and simpliest trading strategies. My Friend. Here will be the best patterns that work on Crypto and XRP:
1. False break out of key level
- U should wait for a pullback to a strong key level.
- Better when a false breakout happens after 100% of ATR drop.
example
2. Wage patten
This BNB trade is the best example.
We made 3% within 1 day))
3. Squezeeng to a key level
The best example will be on EUR/USD but it also works on Crypto and XRP.
I just showed you 3 best examples of how can buy XRP. Wait for one of these scenarios.
My Friends, if u want to learn how to trade crypto and make money on it write to us about education. Below this video will be a link which u can use for it. Because we closed the last 2 weeks with 80% of the profit. You also can learn how to do it.

XRPUSDT 1D-TIMEFRAME ANALYSIS✨XRPUSDT 1D-TIMEFRAME ANALYSIS✨
Hello ladies and gentlemen
This is my new idea for the Ripple
My idea is that the pair will go lower
broke down the daily support sells offs start
I hope my idea is clear
Support me by like and share
Stay Safe💯
Good luck💰

Ripple - The Triangle pattern is completingThere is no doubt of the uptrend formation for this currency, the initial target will be around $ 1.50. Currently the price is forming a Triangle in wave iv from point 3. The uptrend will begin, by the completion of this pattern.

Will XRPUSD reach $3.5 if BITCOIN hits $20k?A lot of talk is being made lately regarding Bitcoin's strong rally since early September, with many believing that the All Time High (ATH) of roughly 20k is just around the corner.
However there is one high cap coin that has hardly moved during Bitcoin's recent run and that is Ripple. Why is XRP still consolidating, why is the market extending this accumulation phase while Bitcoin is marching to its ATH?
During the previous Cycle on both coins, when BTCUSD breached its ATH (Feb 20, 2017 1W candle), XRPUSD was still consolidating. 4 weeks later buyers decided to end this accumulation phase and it started a parabolic 2 week jump that ended much higher than its own ATH. Of course history doesn't have to repeat itself exactly as it did in the past, but it is certainly a good point to keep in mind. If BTC breaks above 20k it is possible to see XRP above $3.5 (which is roughly its ATH on an average of exchanges) within 4 weeks.
After all, the Feb 20, 2017 1W candle was the one that kick-started a hyper aggressive bull run on the alt market as a whole as the chart below shows:
So do you believe that Ripple may be closer to its ATH than we think? Feel free to share your work and let me know in the comments section!
Please like, subscribe and share your ideas and charts with the community!
--------------------------------------------------------------------------------------------------------
!! Donations via TradingView coins also help me a great deal at posting more free trading content and signals here !!
🎉 👍 Shout-out to TradingShot's 💰 top TradingView Coin donor 💰 this week ==> TradingSafely
--------------------------------------------------------------------------------------------------------


XRPXRP on H1 needs 1 more pull back b4 xrp can start to push higher, H4 D1 have a nice set up for another push maybe xrp can hit .22c-.25c area next week for a quick long scalp


XRP Short Term Moving Averages Suggest 'Don't Blink'MACD is pushing up but the real story here is the yellow short-term moving average line that has been above the slightly slower (orange) MA for the past few months despite no real price movement. This suggests XRP is like a tightly coiled spring. Don't blink or you might miss explosive price action coming to this market soon. It will only need 1 or 2 positive months for XRP to finally break through the long-term downtrend, and the increasing trading volume could then turn into a steep and 'spontaneous' blast off.

