XRP scalp longXRP long, low timeframe. Take Profit target around the price of 1.9190.
Always with a Stop Loss in place. Analyzed on 1D, 4H, 1H and 1min timeframes.
The main trend in medium timeframes is BEARISH at the moment, this long is just a SCALP TRADE. After XRP tests the price around that level I expect to short it depending on the level it reaches and the price action.
// Personal, non-professional analysis. //
Xrpusdanalysis

DeGRAM | XRPUSD will drop by 10% or more📊 Technical Analysis
● XRP/USD remains inside a descending channel after a prolonged consolidation, with price repeatedly rejecting the dynamic resistance near 2.40–2.50, confirming lower highs and sustained bearish structure.
● The recent rebound stalled at the horizontal resistance around 2.15–2.20, followed by renewed selling pressure, opening room for a move toward the dynamic support zone near 1.80–1.75.
💡 Fundamental Analysis
● XRP lacks strong bullish catalysts as risk appetite stays selective in the crypto market, while regulatory uncertainty around altcoins continues to cap upside momentum.
✨ Summary
● Bearish trend intact below 2.20–2.40.
● Targets: 1.90 → 1.80.
● Dynamic channel resistance remains the key invalidation.
-------------------
Share your opinion in the comments and support the idea with a like. Thanks for your support!

XRP/USD Swing Trade Playbook — Bullish Breakout Profit Pathway📌 Asset:
XRP/USD – “Ripple vs U.S. Dollar” | Crypto Market Profit Pathway Setup (Swing Trade)
📈 Trade Plan (Bullish Bias)
Waiting for a HULL Moving Average breakout above 2.2500 to confirm bullish continuation momentum.
Once price breaks decisively, the structure opens room for a strong push toward the next liquidity zone.
🎯 Entry
Enter any price level AFTER a clean Hull MA breakout with candle body confirmation + volume uptick.
No breakout → No trade.
🛡️ Stop-Loss (Risk Protocol)
SL: 2.0500 — This is the Thief SL, designed to protect capital once breakout is confirmed.
Dear Ladies & Gentlemen (Thief OG’s), adjust your SL according to:
Your personal risk tolerance
Your system’s volatility rules
Timeframe-based noise filtering
You’re not required to follow my SL — trade safe, protect your bag. 🛡️
💰 Target (Exit Strategy)
Our next potential trouble zone — where the police (sellers) are waiting — stands near:
TP: 2.5500
This zone aligns with:
Overbought conditions
Previous liquidity sweep
Correlation pressure from broader crypto sentiment
Dear Ladies & Gentlemen (Thief OG’s), take profits based on your own system. Take money → Leave the market → Stay safe. 💸
🔍 Related Pairs to Watch (Correlation & Confirmation Signals)
1️⃣ BITSTAMP:BTCUSD – Bitcoin
Why watch it?
XRP often follows BTC’s trend.
A BTC breakout boosts liquidity across altcoins.
BTC above key moving averages = XRP tailwind.
2️⃣ BITSTAMP:ETHUSD – Ethereum
Why watch it?
Strong indicator of altcoin strength.
ETH momentum = altcoins tend to expand.
If ETH stalls while XRP breaks → caution (divergence).
3️⃣ COINBASE:XLMUSD – Stellar
Why watch it?
XRP & XLM share similar utility narratives.
High correlation during liquidity rotations.
XLM breakout → XRP often lags then follows.
4️⃣ BITSTAMP:XRPBTC Pair
Why watch it?
Shows whether XRP is outperforming BTC.
Rising XRP/BTC ratio = stronger XRP pump potential.
Falling ratio = breakout may fake out.
🧭 Key Correlation Notes
BTC strength = XRP stability + possible breakout fuel
ALT dominance rising → higher probability XRP joins the move
USD weakness boosts all crypto pairs priced in USD
Watch volatility cycles: XRP typically pumps after Bitcoin’s volatility cools

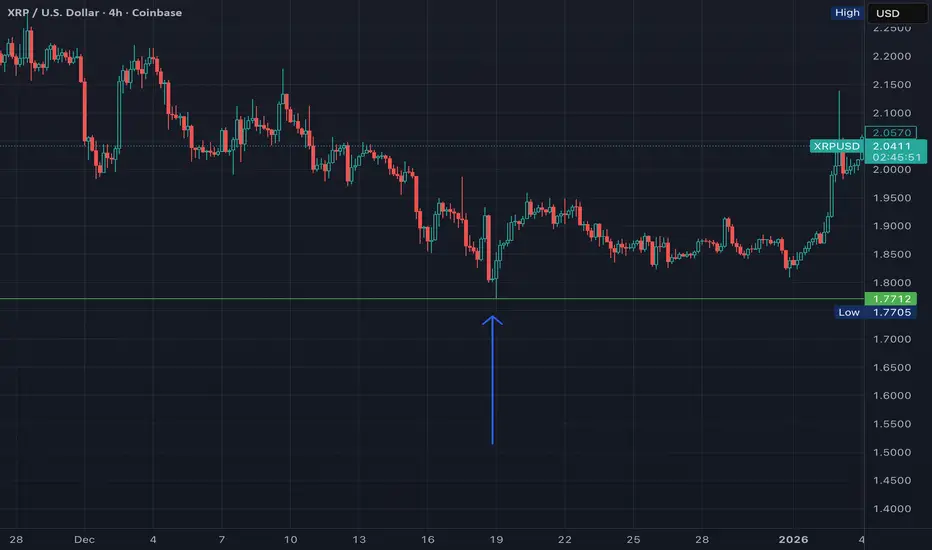
very bullish scenario for XRP (and XRPT 2x daily long etf)I'm expecting an explosive move on XRP over upcoming weeks. From what I see, the final low has now been made on XRP after it took out the lows on 4 hr triple consecutive bearish candle at 1.77 on 12/19/25 (those are often retested for liquidity). This is now the final retracement of the bullish structural breakout zone on 4 hr tf at 2$ range so next comes the steady progression to 7$, 10$ & then 24-26$ likely in 2027. A break above 4$ will reinforce this bullish thesis. I think it's likely to have some continued volatility/choppiness as we progress higher but overall expecting buyer control & bullish dominance at least to 24$ level. (could still have another steep retracement on monthly tf back to 12-13$ range after 24$ is reached so will definitely exit XRPT at those levels out of caution)
Perfect scenario for buying XRPT imo given the immense upside potential on what would be considered a very early entry on a large buy cycle. I would typically not entertain the idea of swinging leveraged ETFs that long but I believe this setup will not disappoint for those open to incorporating some higher volatility instruments for outsized profits.
DeGRAM | XRPUSD will retest $2📊 Technical Analysis
● XRP/USD is forming a long-term descending channel, with price rebounding from the dynamic support near 1.80–1.85 and breaking short-term consolidation, signaling a potential trend transition.
● The recent impulsive surge from the channel base and higher lows suggest accumulation, while the pullback below the dynamic resistance near 2.40–2.50 looks corrective, opening room for continuation toward the upper channel.
💡 Fundamental Analysis
● Improving regulatory clarity around Ripple and renewed interest in institutional crypto adoption support long-term demand for XRP despite broader market volatility.
✨ Summary
● Long-term bullish recovery from channel support. Key support: 1.85. Resistance targets: 2.50 and higher within the descending channel.
-------------------
Share your opinion in the comments and support the idea with a like. Thanks for your support!

#XRP/USDT XRP (1h) (spot)#XRP
The price is moving within a descending channel on the hourly timeframe. It has reached the lower boundary and is heading towards a breakout, with a retest of the upper boundary expected.
The Relative Strength Index (RSI) is showing a downward trend, approaching the lower boundary, and an upward bounce is anticipated.
There is a key support zone in green at 2.02, and the price has bounced from this level several times. Another bounce is expected.
The indicator is showing a trend towards consolidation above the 100-period moving average, which we are approaching, supporting the upward move.
Entry Price: 2.06
First Target: 2.10
Second Target: 2.15
Third Target: 2.21
Stop Loss: Below the green support zone.
Don't forget one simple thing: Money Management.
For any questions, please leave a comment.
Thank you.

#XRP/USDT Technical Analysis. Bearish and Bullish overview!XRP/USDT – Daily Technical Analysis
XRP is showing early signs of a relief bounce after completing a full corrective move within a clearly defined descending channel. Price recently swept liquidity near the 1.77–1.80 demand zone and reacted strongly from this support.
Structure & Trend
The broader market structure remains bearish, with consistent lower highs and lower lows inside the descending channel. The current move appears to be a counter-trend bounce rather than a confirmed trend reversal.
Key Levels (Fibonacci Retracement)
0.618 at 2.01 is the immediate support. Holding above this level keeps the bounce intact.
0.5 at 2.09 and 0.382 at 2.17 act as intermediate resistance levels.
0.236 at 2.26 is a strong resistance zone.
The 2.40–2.42 region is a major resistance and previous rejection area, aligning with channel resistance.
EMA Structure
Short-term EMAs have started to curl upward, indicating improving momentum. Price needs to stay above these EMAs to maintain bullish continuation.
Bullish Scenario
If price holds above 2.00–2.05 and breaks above 2.26, XRP can extend toward the 2.40–2.42 resistance zone. A daily close above the descending channel would indicate a potential trend shift.
Bearish / Risk Scenario
Failure to hold above 2.00 could lead to a pullback toward 1.90–1.80. A breakdown below 1.77 would invalidate the bounce and resume the broader downtrend.
Summary
XRP is at a critical reaction zone. Momentum has improved after a strong support bounce, but confirmation only comes above 2.40. Until then, price action remains corrective within a larger downtrend.
If you like this idea, please hit the like button and share your views in the comments section.
Thank you
#PEACE

DeGRAM | XRPUSD broke a descending structure📊 Technical Analysis
● XRP/USD made a sharp impulsive rally after breaking the main descending trendline and exiting a long consolidation triangle, but price has now reached a major descending resistance zone near 2.45–2.55, where prior sell reactions formed.
● The vertical advance shows exhaustion characteristics, with price stalling above former support turned resistance, favoring a corrective pullback toward the 2.25–2.20 support area.
💡 Fundamental Analysis
● XRP upside momentum is fading as broader crypto markets consolidate and risk appetite cools, while no new catalysts have emerged to justify continuation after the breakout spike.
✨ Summary
● Medium-term short bias. Resistance: 2.45–2.55. Key support: 2.25–2.20. Expect pullback after breakout exhaustion.
-------------------
Share your opinion in the comments and support the idea with a like. Thanks for your support!

XRP Weekly Chart Fib Layout!As of right now we are currently stuck in the Mid Level between fib 1 and fib 0.786 This is just a potential layout of what can possibly happen if we break out the mid level which shows the all time high levels. Tell me what you guys think don't forget to give me a follow for updates.

XRP grabbing liquidity and back down!I believe XRP will hit the yearly pivot point around 2.36 also hitting the 233 EMA AND sweeping the liquidity from the Nov. 24th run up. There's bigger fish to fry at lower levels.

XRP Ripple Technical Analysis and Trade IdeaXRP / Ripple has now broken market structure to the upside 📈🚀.
This is clearly visible on both the Daily and 4H timeframes 📊👀.
I’m now looking for a potential buy opportunity 🟢 if price pulls back into my optimal entry zone, as explained in the video 🎥📍.
As always, patience is key — I want price to come to my levels and confirm the setup 🧠✅.
⚠️ Not financial advice. Trade responsibly and manage risk at all times 💰🛡️.

XRP | FVG Retrace Then Consolidation Before Breakout
Executive Summary
XRP is trading at $2.02 within an ascending triangle on the 4H timeframe. After reclaiming the psychological $2 level, price faces resistance at $2.02-$2.12. Expecting a short-term bearish move into the FVG (Fair Value Gap) at $1.75-$1.80, followed by consolidation, then a breakout either up or down.
BIAS: NEUTRAL - Bearish Short-Term, Then Consolidation, Then Breakout
Current Market Data
Current: $2.0231 (+0.85%)
Day's Range: $2.0059 - $2.0385
52-Week: $1.6106 - $3.6662
Market Cap: $122.74B
ETF Holdings: $1.16B+ (24 consecutive days of inflows)
Performance:
1W: +9.82% | 1M: -7.96% | 3M: -31.88%
6M: -10.94% | YTD: +9.99% | 1Y: -15.73%
Key News
XRP spot ETFs hold $1.16B+ with $1.4B total inflows
Ripple unlocked 1B XRP on Jan 1 (monthly escrow) - supply pressure
JPMorgan GTreasury integration on XRP Ledger
CLARITY Act markup scheduled for January 2026
$2 zone has rejected XRP since 2017 - major resistance
Technical Structure - 4H
Ascending Triangle:
Rising support trendline - higher lows
Horizontal resistance at $2.00-$2.02
Upper resistance at $2.12
FVG filled on left, was resistance, then broken
FVG Zone:
$1.75-$1.80 - Unfilled gap / liquidity sweep zone
Expect retrace here before consolidation
Ideal long entry if bounce confirms
Key Levels:
Resistance:
$2.00 - $2.02 - Horizontal resistance
$2.12 - Upper resistance (breakout level)
$2.20 - $2.50 - Bullish targets
Support:
$1.88 - $1.91 - Immediate support
$1.75 - $1.80 - FVG zone / liquidity sweep
$1.72 - Major support zone (bottom red line)
SCENARIO ANALYSIS
SHORT-TERM: Bearish Into FVG
Price retraces to $1.75-$1.80 FVG zone
Sweeps liquidity below $1.80
Consolidation phase begins
THEN: Breakout Either Direction
BULLISH: Break above $2.12 → Targets $2.20, $2.50
BEARISH: If no FVG bounce → Break below $1.72 → Targets $1.61, $1.45
My Assessment
Ascending triangle at $2 resistance. Short-term bearish into FVG at $1.75-$1.80, then consolidation. Wait for breakout confirmation before committing to direction. The $2 zone has rejected XRP since 2017 - this is a make-or-break level.
Strategy:
Expect short-term drop to $1.75-$1.80 FVG
Watch for consolidation and breakout direction
Long above $2.12 → Target $2.20-$2.50
Short below $1.72 → Target $1.61-$1.45
Comment your thoughts on the XRP 2026 Bull or Bear RALLY!

Is This the Start of a New XRP/USD Uptrend?🔥 XRP/USD Bullish Breakout Plan | HULL MA Confirmation Setup
📌 ASSET OVERVIEW
XRP/USD – Ripple vs U.S. Dollar
Market Type: Crypto
Trade Style: Swing Trade
📈 TRADE PLAN – BULLISH BIAS
🟢 Market Bias: Bullish (Conditional)
🟢 Strategy: Pending execution after HULL Moving Average breakout confirmation
This setup activates only after momentum confirms. No prediction — only reaction.
🎯 ENTRY STRATEGY
✅ Entry Rule:
AFTER HULL MA BREAKOUT ABOVE 1.91000
Once breakout is confirmed, ANY PRICE LEVEL ENTRY is acceptable based on your execution model
📌 Momentum confirmation is mandatory — patience is the edge.
🛑 RISK MANAGEMENT
🔻 Stop Loss: 1.80000
📍 Place SL only after the HULL MA breakout is confirmed
⚠️ Risk Note:
Dear Ladies & Gentlemen (Thief OG’s), this SL is not mandatory.
You are responsible for adjusting risk based on your capital, leverage, and strategy.
🎯 PROFIT MANAGEMENT
🎯 Target Zone: 2.10000
🧠 Why this level matters:
Triangular Moving Average acts as a profit barricade
Strong support + oversold reaction zone
Potential bull trap / liquidity sweep near higher levels
High probability area to secure gains, not chase price
⚠️ TP Disclaimer:
You are not required to use this TP. Scale out, trail, or exit based on your own plan.
🔗 RELATED PAIRS TO WATCH (CORRELATION EDGE)
Keep these on your watchlist for confirmation or divergence signals:
XRP/BTC → Strength here supports XRP dominance 📊
BTC/USD → Overall crypto market direction & risk sentiment 🧭
ETH/USD → Smart-money flow proxy in altcoin space ⚡
TOTAL2 / TOTAL3 → Altcoin market capitalization health 🌐
📌 If BTC holds structure and XRP/BTC trends up → XRP/USD breakout probability increases.
🧠 KEY TECHNICAL INSIGHTS
HULL MA breakout = trend acceleration trigger
Price acceptance above 1.91000 confirms buyer control
Failure to hold above HULL MA invalidates bullish thesis
Best execution comes from reaction, not anticipation
🌍 FUNDAMENTAL & MACRO FACTORS TO MONITOR
📢 Crypto-Specific Drivers
Ongoing regulatory clarity surrounding Ripple
Institutional adoption trends in cross-border payment solutions
On-chain activity & network usage metrics
📊 Macro & Economic Factors
USD strength/weakness (risk-on favors crypto)
Global liquidity conditions
Risk sentiment across equities & digital assets
🗞️ Upcoming Market Sensitivities
Major U.S. macro data releases (volatility catalyst)
Regulatory headlines impacting crypto sentiment
Large-cap crypto flows influencing altcoin momentum
✅ FINAL TRADER NOTES
✔️ Wait for confirmation
✔️ Trade with structure
✔️ Respect risk
✔️ Protect profits
💡 Discipline pays more than prediction.

1 hour view (xrp) short-term SHORTHello 🙋♀️🙋♂️👽👻🐮🌍
just a quick idea and possible short available here. price could go much lower because we are in a descending triangle on daily time frame view.
⏬⏬
For now I have my eyes on 💲1.8 as a possible short term target.
This is just an idea, please trade at your own risk
🐶This is a Short term short Idea. The cryptocurrency market is extremely volatile💣
This is not financial advice
🐶
Always have a stop loss ✋🛑💲 set🆗
Any thoughts 💭💡, questions 🙋♀️🙋♂️❓, good 👍, bad👎, happy 😄 or sad 😥, in the comments always welcome.😄
Jazerbay ☯️

DeGRAM | XRPUSD will correct from the $2 level📊 Technical Analysis
● XRP/USD remains in a well-defined descending channel after the post-crash structure, with multiple rejections from the falling resistance line confirming sustained bearish control. Recent rallies failed near the upper channel boundary, forming lower highs.
● Price action shows weak rebounds from the support line, followed by renewed selling pressure. The inability to reclaim the 2.00–2.05 area keeps downside risk active, with continuation toward the lower channel zone around 1.75–1.80.
💡 Fundamental Analysis
● XRP sentiment remains pressured by the lack of strong positive catalysts and ongoing regulatory uncertainty, while broader risk-off conditions limit speculative demand.
✨ Summary
● Bearish trend intact. Key resistance: 2.00–2.05. Targets: 1.80 then 1.75. Invalidation above the descending resistance line.
-------------------
Share your opinion in the comments and support the idea with a like. Thanks for your support!

DeGRAM | XRPUSD will correct to the $1.816 level📊 Technical Analysis
● XRP/USD remains inside a well-defined falling channel, with price repeatedly rejecting the dynamic resistance line and forming lower highs, confirming sustained bearish control. The recent triangle consolidation near 2.10–2.20 resolved downward, reinforcing continuation risk.
● Price is compressing below descending resistance while holding above the 1.80 support zone. Failure to reclaim the channel midline keeps pressure toward a breakdown and a retest of lower supports.
💡 Fundamental Analysis
● Broader crypto sentiment remains fragile amid reduced risk appetite and selective capital rotation into majors, limiting demand for mid-cap altcoins like XRP.
✨ Summary
● Bearish bias below descending resistance. Downside focus: 1.80 support. Invalidation above 2.30.
-------------------
Share your opinion in the comments and support the idea with a like. Thanks for your support!

XRP – Bearish Breakout Expected from Rising ABC StructureXRP has formed a rising corrective ABC structure, moving inside a narrowing ascending channel. The market has already shown weakness near the upper boundary, and the structure looks exhausted.
I expect a downward breakout from this ABC formation , which should lead to a broader corrective phase.
The primary downside target is located near $0.90 , aligning with a major horizontal support level and the origin of the previous impulsive move.

XRP Price Prediction: These Holders Now Dominate 11.5% SupplyXRP trades near $1.86 at the time of writing, remaining well below the $2.00 mark lost last week. The decline followed a failed attempt to break out of a month-long downtrend earlier this month. Momentum remains fragile under current conditions.
The token is holding above the $1.85 support level, which has been tested previously. XRP may consolidate below $1.94 if selling pressure eases. However, worsening sentiment could push price toward $1.79, extending short-term losses.
A recovery scenario depends on improving network activity and broader market stability. A break above $1.94 would be the first step toward reclaiming $2.00. Flipping $2.02 into support could drive XRP toward $2.20, invalidating the bearish trend.

Ripple Market Warning! Strong Bearish Setup Emerging🚨 XRP/USDT BEARISH REVERSAL SETUP 🎯 | Swing Trade Blueprint
Asset: XRP/USDT (Ripple vs Tether) 💎
Market: Cryptocurrency
Strategy: Swing Trade - BEARISH 🐻📉
📊 TRADE SETUP
🔴 BIAS: Bearish Momentum Building
📍 ENTRY: Flexible Entry - Any Current Price Level ($2.26 area)
⚠️ RISK MANAGEMENT (CRITICAL)
🛑 Stop Loss Reference: $2.7000
⚡ IMPORTANT: This is a reference SL only. Adjust based on YOUR strategy & risk tolerance.
✅ PRO TIP: Place SL AFTER breakout confirmation. DO NOT set it prematurely!
🎯 Dear Traders & OG's: I'm NOT recommending you blindly follow my SL. This is YOUR trade, YOUR capital, YOUR risk. Manage it accordingly!
🎯 PROFIT TARGET
🔥 PRIMARY TARGET: $1.6000
📌 Technical Support:
Triangular Moving Average acting as strong support zone
Oversold conditions developing
Liquidity trap zone - TAKE PROFITS strategically
💰 Risk Disclaimer: I'm NOT recommending you follow only my TP. Scale out, take profits at YOUR comfort levels. Secure the bag at YOUR own discretion!
🔗 CORRELATED PAIRS TO WATCH
Direct XRP Pairs:
XRP/USD 💵 - Monitor for divergence signals
XRP/BTC ₿ - Bitcoin pair correlation strength
XRP/ETH Ξ - Ethereum cross-pair dynamics
Related Market Movers:
BTC/USDT - Bitcoin dominance impacts alt direction
ETH/USDT - Ethereum weakness = altcoin pressure
SOL/USDT - High-cap alt comparison
ADA/USDT - Similar smart contract platform competitor
🧠 KEY TECHNICAL FACTORS
✅ Descending channel formation
✅ Triangular MA support confluence
✅ Oversold RSI conditions approaching
✅ Volume divergence patterns
✅ Liquidity zones below current price
🔗 Market Correlation Logic:
When BTC/USDT shows weakness, XRP typically follows with amplified moves. Monitor Bitcoin for confirmation of bearish continuation. If Bitcoin stabilizes above key support, XRP may find temporary relief before next leg down.
⚡ ACTION PLAN
1️⃣ ENTRY: Scale in at current levels
2️⃣ CONFIRMATION: Wait for breakout validation
3️⃣ STOP PLACEMENT: Set SL after confirmation (suggest above $2.70)
4️⃣ PROFIT MANAGEMENT: Scale out profits toward $1.60 target
5️⃣ MONITORING: Watch BTC dominance & overall crypto market sentiment
🔔 Follow for more setups | 👍 Like if this helps | 💬 Comment your thoughts!
📊 Stay disciplined. Trade smart. Protect capital.
#XRPUSDT #CryptoTrading #SwingTrade #BearishSetup #RippleTrade #CryptoAnalysis #TradingView #AltcoinTrading

DeGRAM | XRPUSD reached the strong support area📊 Technical Analysis
● XRP is forming a bullish base inside the 1.98–2.03 support zone, where multiple rebounds confirm strong demand. A recovery toward the descending resistance line near 2.09 is likely as price stabilizes after a capitulation wick and begins building higher lows.
● The broader structure shows compression against downtrend resistance, favoring an upward retest once buyers regain short-term control.
💡 Fundamental Analysis
● Market sentiment improves as Ripple’s institutional partnerships expand and crypto flows strengthen, supporting medium-term accumulation.
✨ Summary
● Long bias: support zone holds → targets 2.06 and 2.09; key support 1.98–2.03.
-------------------
Share your opinion in the comments and support the idea with a like. Thanks for your support!

XRPusdt (Ripple): Triangle Breakout/Breakdown OutlookHi!
Price is currently sitting right at the lower boundary of the triangle, showing compression and weakening momentum.
Price is compressing at the bottom of the triangle. A breakout above the top line would likely send the price up to retest the main descending trendline, where stronger resistance sits.
If instead the level fails and price breaks down from the lower boundary, it would confirm bearish continuation toward the 1.80 support zone.
DeGRAM | XRPUSDT held the support area📊 Technical Analysis
● XRP/USD is rebounding from the green support zone, forming higher lows and breaking into a short-term ascending structure aimed toward 2.0990.
● The price is approaching the descending resistance line; a push from the rising trendline suggests momentum building for a test of 2.0990 and potentially the upper trendline next.
💡 Fundamental Analysis
● FXStreet notes improving sentiment around altcoins as liquidity returns and regulatory pressure eases, supporting short-term upside for XRP.
✨ Summary
● Long bias: targets 2.0990 while support holds near 2.02.
-------------------
Share your opinion in the comments and support the idea with a like. Thanks for your support!

XRP/USDT Professional Analysis – SMA Breakout Validated🌐 Professional XRP/USDT Trade Map — Breakout, Targets, Risk Controls
Asset: XRP/USDT – “RIPPLE VS TETHER”
Crypto Market Opportunity Blueprint (DAY/SWING Trade) 🚀📊
🔥 TRADE PLAN OVERVIEW
Plan: Bullish plan confirmed with Simple Moving Average breakout 📈✨
Entry: YOU CAN ENTRY ANY PRICE LEVEL 🟩🟢
This structure is built on momentum continuation + clean SMA upside confirmation.
🛡️ STOP LOSS GUIDANCE
Stop Loss: This is thief SL @ 2.0000
Dear Ladies & Gentleman (Thief OG's) — adjust your SL based on your strategy & your own risk.
⚠️ Note: I am not recommending you to set only my SL. It's your own choice; you can make money then take money at your own risk.
🎯 TARGET LEVEL – PROFIT MANAGEMENT
Target: TRIANGULAR Moving Average acts as a strong resistance + overbought zone + trap region.
📌 OUR target @ 2.3000 — kindly escape with profits before the trap activates.
⚠️ Note: Dear Ladies & Gentleman (Thief OG's), I am not recommending you to set only my TP. It's your own choice; you can make money then take money at your own risk.
🌍 RELATED PAIRS TO WATCH — CORRELATIONS & KEY POINTS
Monitoring correlated assets gives extra confirmation of trend strength, liquidity flow, and momentum shifts. Here are the pairs to keep an eye on:
💠 1. BINANCE:BTCUSDT – Bitcoin Controls Crypto Liquidity
Why watch it:
BTC is the macro driver of overall crypto momentum.
A bullish BTC → stronger inflow into alts like XRP.
If BTC rejects from key levels, XRP often slows or traps.
Key correlation:
Rising BTC dominance can limit XRP upside.
Falling dominance supports large-cap alt breakouts.
💠 2. BINANCE:ETHUSDT – Ethereum Trend Confirms Alt-Market Strength
Why watch it:
ETH often leads altcoin rotations; when ETH trends strong, major alts follow.
ETH breaking resistance = broader bullish environment for XRP.
Key correlation:
Strong ETH liquidity → better confidence for XRP swing trades.
💠 3. BINANCE:XLMUSDT – Directly Related Utility Sector Coin
Why watch it:
XLM and XRP often move with similar cross-border payment narratives.
When XLM surges first, XRP commonly follows with a delayed reaction.
Key correlation:
Positive XLM momentum strengthens confidence in XRP bullish setups.
💠 4. BINANCE:ADAUSDT – Risk-On Altcoin Indicator
Why watch it:
ADA rallies typically signal strong retail participation in altcoins.
Helps confirm whether the market is in alt season rotation mode.
Key correlation:
ADA strength → XRP follow-through probability increases.
💠 5. BINANCE:XRPBTC – Relative Strength Indicator
Why watch it:
If XRP/BTC is rising, XRP is outperforming Bitcoin → strong signal.
If XRP/BTC is dropping, XRP bullish trades may weaken or get trapped.
Key correlation:
XRP/BTC breakout = highest-quality long confirmation.
📌 SUMMARY FOR TRADINGVIEW READERS
This XRP blueprint delivers a clear bullish continuation setup powered by SMA breakout momentum, structured risk guidance, and a realistic trap-aware profit target. Monitoring correlated pairs amplifies your confidence, especially during critical breakout or overbought zones.
