XRP/USDT – Critical Decision Zone After Major Breakout!XRP/USDT on the Weekly (1W) timeframe shows a major shift in market structure. After a long accumulation phase throughout 2022–2024, price experienced a strong impulsive breakout in early 2025, signaling a transition from sideways conditions into a bullish market structure. Currently, price is in a retracement and re-accumulation phase, which will determine the next major direction.
---
Pattern & Price Structure
1. Long-Term Accumulation Range
XRP traded sideways for an extended period below the 1.00 USDT area.
This range acted as a strong accumulation base.
2. Bullish Breakout (Impulse Move)
Price broke above the major resistance around 0.90–1.00 with strong weekly candles, confirming valid breakout momentum.
3. Pullback / Re-Accumulation Phase
Current price action represents a healthy correction after the rally.
As long as key support holds, the structure remains higher high and higher low.
---
Key Levels
Major Resistance
3.60 – 3.80 USDT → Previous high / weekly supply zone
Key Support
1.90 USDT → Critical horizontal support & decision level
1.55 – 1.60 USDT → Strong demand zone
1.30 USDT → Last major bullish defense
---
Bullish Scenario
Price holds above 1.90 USDT with a valid weekly close.
Bullish reactions such as strong weekly candles or long lower wicks appear.
Upside continuation targets:
Target 1: 2.50 USDT
Target 2: 3.00 USDT
Main target: 3.60 – 4.00 USDT
This scenario suggests trend continuation after re-accumulation.
---
Bearish Scenario
A confirmed weekly close below 1.90 USDT signals weakness.
Price may continue correction toward:
1.55 USDT (first support)
1.30 USDT (major demand zone)
As long as price stays above 1.30, the broader structure remains bullish corrective, not a trend reversal.
A breakdown below 1.30 would indicate macro trend deterioration.
---
Conclusion
XRP is currently trading at a critical weekly decision zone.
The 1.90 USDT level acts as the key pivot:
Holding above it favors bullish continuation toward new highs.
Losing it opens room for a deeper, but still healthy, correction.
From a macro perspective, XRP remains structurally bullish, with the current move best interpreted as a pullback after a major breakout, not distribution.
---
#XRP #XRPUSDT #CryptoAnalysis #WeeklyChart #AltcoinMarket #MarketStructure #SupportResistance #BullishContinuation
XRPUSDC

Time for XRP?CRYPTOCAP:XRP ➖ Time for XRP?
I checked CoinMarketCap and saw the coin is currently ranked 6th in searches, so I got curious about what's going on with it.
Like every other coin, it dropped hard together with the market on Monday and triggered a ton of trader stop losses.
Looking at the liquidation heatmap, there is still room for upside along with Bitcoin. Basically this will just be a corrective bounce before we head even lower. We'll wipe out the shorts first and then drill a new bottom.
➖ Entry around $2.0210 with a target of $2.3700, good for roughly +17%.
Unless aliens and reptilians don't step in and mess with this little XRP bounce of course 🦖👽.

XRP 1D Analysis - Key Triggers Ahead☃️ Welcome to the cryptos winter , I hope you’ve started your day well.
⏰ We’re analyzing XRP on the 1-Day timeframe .
👀 On the daily timeframe of Ripple (XRP), we can see that — for this analysis — I decided to share my perspective from left to right across the chart.
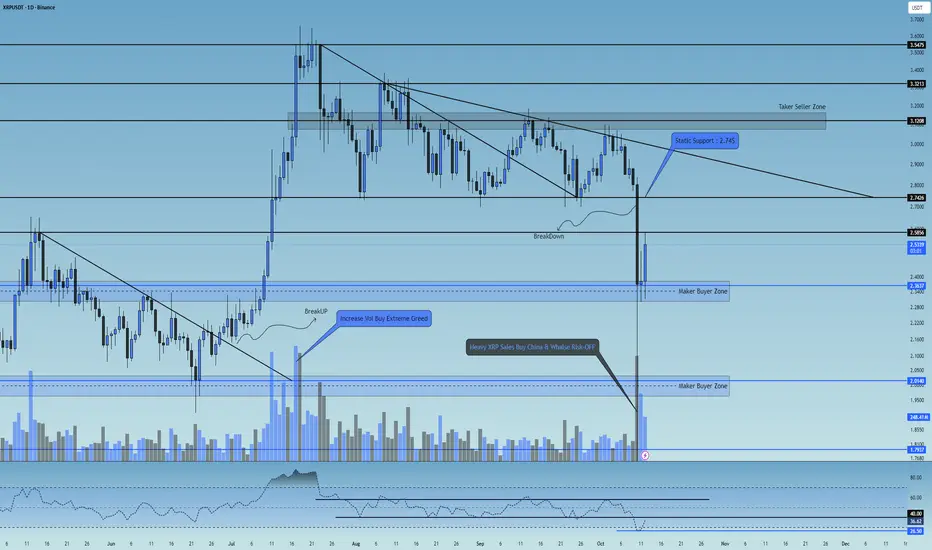
From mid-May to late June, Ripple was trading below a descending dynamic resistance trendline, which it successfully broke to the upside, rallying from $2 to $3.5. In that area, heavy profit-taking occurred, pushing the price downward. The first major support after that sharp rally was at $2.74.
Later, Ripple formed a lower high at $3.23 and a double bottom (equal low) around $2.74, which created a strong static support and positioned the price within the final third of its triangle pattern. It then broke its dynamic trendline resistance again and managed to make a higher high, but this time it failed to show the same sharp bullish momentum. It was quickly rejected from $3.1, which was a taker-seller zone, and pulled back toward its static support.
Buyers didn’t allow the key floor to break — they defended the level aggressively, pouring in additional liquidity to keep XRP above support. However, since no major new capital inflow entered the market and Ripple remained compressed within multiple overlapping triangle formations, a new dynamic resistance was formed. Even with intense effort from buyers, that resistance couldn’t be broken, and eventually, Ripple lost its key static support at $2.74 and dropped further.
Although this move was technically predictable, the speed and depth of the fall were hard to manage in real time. Now, Ripple is sitting above a strong buyer-maker support zone, and much of the selling volume is being absorbed by buybacks. Retail traders are also accumulating again.
The interesting point: Ripple has a critical resistance at $2.58 — if it breaks and holds above this level, it can reignite a bullish move upward. The main resistance zone remains the same old static support area that buyers previously tried hard to protect. Once the $2.74 level is broken back to the upside, Ripple could experience a strong pump.
🧮 On the daily RSI oscillator, Ripple had a very strong static resistance zone around 62, and on its last touch it got heavily rejected, dropping below 50 and 30 without much resistance. Currently, RSI has a support around 26.5 and a key resistance around 40 — these are the main RSI pivot levels. If Ripple’s RSI breaks out of this range, it can trigger higher volatility and momentum aligned with the market direction.
🕯 The recent candle structures — especially the large bearish candle with a long lower wick — caused panic and FOMO among Ripple holders. This led many institutions and big wallets to switch into risk-off mode, dumping their XRP positions and causing a 50% crash within hours.
However, Ripple has recovered well, and the last two bullish candles came with solid buying volume, likely supported by the RSI exiting its oversold zone. With continued buying volume and a break above the key taker-seller resistance at $2.58, Ripple could resume its upward movement.
🧠 If we held Ripple — what would we do?
Personally, if I owned XRP right now, I’d strictly follow capital and risk management, avoiding emotional decisions driven by fear or greed. Ripple is currently forming a new trading range with tight highs and lows, meaning that breaking either boundary will likely start the next major leg of movement.
The upcoming week, especially with the meeting between Trump and the Chinese President, could significantly impact risk markets.
So for now, I’d do nothing major — and if I decided to open a position, I’d do it with minimal risk (and yes, I call that “a bad habit” on purpose 🙂).
This scenario will be updated with more precision and detail in future analyses.
❤️ Disclaimer : This analysis is purely based on my personal opinion and I only trade if the stated triggers are activated .
XRP Ready for a Bullish Rally?XRP is breaking out of a descending wedge structure on the daily chart after weeks of consolidation. Price is reclaiming moving averages (50 EMA & 100 EMA), showing renewed bullish momentum.
✏️ Entry Zone: ~$3.05
✏️ Target (TP): $5.00 (major resistance from previous high)
✏️ Stop-Loss (SL): ~$2.70(below support / invalidation level)
✏️ Risk/Reward Ratio: 1:6
Key Points
- Daily structure shows a series of higher lows holding strong.
- Breakout accompanied by volume confirmation suggests buyers stepping in.
- If price sustains above the breakout trendline, momentum could extend toward $5+.
- Losing $2.70 support would invalidate the bullish setup.
Cheers
Hexa

XRP is about to break out again, on its way to our $10 target.XRP is finally breaking out of consolidation — momentum is building towards our first major target at $10!
🎯 Target 1: $10
🎯 Target 2: $15–$20
Let’s go! 🚀 Good luck, everyone!

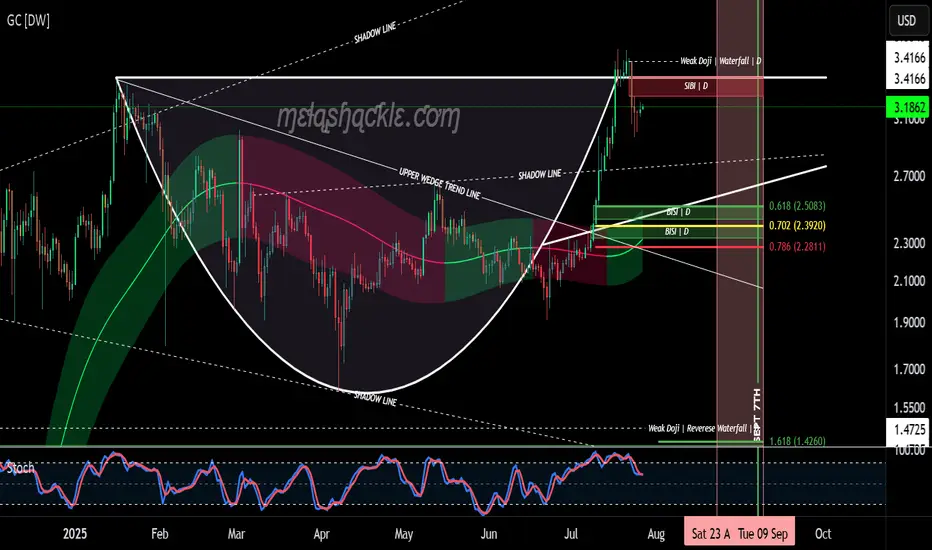
XRP Cup & Handle Pattern on the Daily Chart.XRP is now forming the handle on a very nice cup-and-handle pattern on the daily chart, starting at the previous all-time high set on January 16th, 2025.
But this pattern isn’t all sunshine and rainbows. The price of XRP could drop down into the $2.50 range—toward the bullish fair value gaps I’ve outlined at the bottom of the handle—before making any credible gains or a major breakout to higher levels.
I do believe we’ll see much higher prices in XRP in the coming years as we continue moving into the new global digital financial system. However, for this pattern to fully play out, there will likely be some pain before the pleasure.
I’d keep a close eye on the pink area marked on the charts—spanning from August 23rd through September 8th—as a potential zone for bearish price action.
Luckily for me, my XRP bags have been filled since before the Trump election pump, so I don’t personally need to buy more—unless I see a clear buying opportunity.
Good luck, everyone!
XRP to $10? 🚨 XRP to $10? Here's What No One Is Telling You 💣
XRP is quietly being tested as a global liquidity bridge by BRICS & Gulf nations. If Ripple powers the rails of future CBDCs…
$6.50 to $10 XRP becomes a math problem — not a fantasy.
✅ Ripple IPO incoming
✅ U.S. relisting possible
✅ Token supply shrinking
✅ Wall Street quietly watching
This isn’t hype. It’s the sleeper setup of the decade.
Would you hold XRP if it replaced SWIFT?

XRP's situation+ Target PredictionThe XRP is in a Bullish phase by a Falling Wedge Pattern.
A falling wedge indicates the potential for price to reach to $3.
Note if the PRZ ZONE is broken downwards with the strength of Bearish candles , this analysis of ours will be failed.
Best regards CobraVanguard.💚

Ripple Analysis - What Shall we Expect !!!If the price can break through this channel's resistance, I expect it to reach $2.5 in a short time.
Stay Awesome , CobraVanguard

"XRP Analysis" (Update)Here's what I can gather from the chart right now:
The Minor Resistance zone has been strongly broken to the upside; we haven't seen good pullbacks to this level yet.
On the other hand, below the broken zone, there's a price gap toward the FVG, as indicated by the arrow.
Also, the pullback to the breakout level at 0.382 has not been completed, and no patterns have formed in that area!
So? When we analyze all the breakout factors, we see a very high chance of a correction.
Now, this correction could start from the confirmation level at 2.11 OR 2.05, or with an overextension, it could happen from the 2.3 zone.
Stay Awesome , CobraVanguard

XRP is exhibiting a nice Reverse Dragon Pattern on the Daily.XRP has been doing its best impression of a yo-yo for quite some time now, but as you can see, XRP is also now showing a nice Reverse Dragon Pattern on the daily chart, which has the potential to be extremely bullish in the short to mid term.
The Dragon’s head is now forming on the daily chart, just above the upper trendline and, as I’ve discussed with my followers, has the potential for a strong bullish move upward—followed by a liquidation candle in the general area of the Weak Doji/Reverse Waterfall line—then a continuation move upward, likely back into the $3+ range over the course of the next couple of weeks in the month of May.
Good luck, and always use a stop loss when trading.

XRP is looking like it may trade back to the equilibrium zone.XRP has been struggling to gain a significant amount of ground and is, in my opinion, one of the most heavily manipulated cryptos in the entire cryptosphere. That should tell you something about its long-term potential if the powers that be are willing to put so much time and effort into keeping its price suppressed.
Good luck, and always use a stop-loss!

Is XRP forming a larger inverse H & S fractal pattern?XRP has just punched through the inverse head and shoulders pattern neck line, but I can't help but think this is a smaller part of a larger pattern (marked in white).
Good luck, and always use a stop loss!

XRP | Flash-Crash chart updated.Here is a copy of my latest XRP chart with my April 'flash crash' thesis that I've been discussing with my community for the past month or so.
Good luck!

My recent XRP/BTC chartHere is a copy of my XRP/BTC chart that I've talked about recently, with my equilibrium zone.

My recent XRP/ETH chartHere is a copy of my XRP/ETH chart that I've talked about recently, with my equilibrium zone.

XRP with likely levels, and alternatives for April 'flash crash'Here's my latest XRP chart, which includes potential levels that could be hit, along with an alternative path for the 5th wave, assuming the bottom is already in on the chart.
- If wave 4 is already complete, then the wave 6 "flash crash" low would likely be higher than the chart shows, perhaps staying within the lower white trendline (thicker white line).
- If wave 4 isn't complete, then the wave 6 "flash crash" would likely go outside the lower white trendline (thicker white line), targeting the green fair value gap (FVG) in the chart or somewhere between that FVG and the lower white trendline, sweeping the previous lowest low of the entire pattern.
- The fair value gap that absorbed the "Trump Crypto Reserve" tweet breakout—which quickly failed after hitting the gap—would likely be filled during the 5th wave (false breakout leg), taking out that high before the April "flash crash."
- The real breakout, the 7th wave, would likely take out the previous all-time high and run to the top of the pattern, reaching the area of the upper white trendline (thicker upper white line).
I will be going over this chart again very soon for anyone who follows me.
Keep in mind that the "flash crash" in April is a theory and may not come to fruition or could be off in timing. However, I do believe that the breakout will begin in May, even if the "flash crash" does not occur in mid to late April.
Good luck, and always use a stop loss!

My current XRP 'flash crash in April' thesis chartThis is the current chart that I'm using, which includes approximate areas and an approximate timeline for my coming 'flash crash in April' thesis. This involves XRP bottoming out very soon, then going on a 'false breakout' heading into April, followed by a flash crash sometime in mid to late April. This will then mark the low of this area of the chart, and the real breakout will occur sometime in May, which I believe will take XRP to a new all-time high and true price discovery.
Keep in mind that this is a theory, which is developing day by day, and may or may not actually come to fruition. It's based on a chart I've released in the past called 'THE XRP BREAKOUT CHART.'
*** The yellow line on the chart is a simple wave count, and not affiliated with Elliot Wave Theory, just for clarification.
Enjoy the ride.
Good luck, and always use a stop loss!

XRP | Know what you hold!XRP went on an absolute tear starting on November 3rd through mid-December during the 'Trump election pump,' but has pulled back and consolidated heavily. Even though we had a nice pump a few days ago when President Trump released his U.S. Crypto Reserve tweet, which featured XRP in the first position on the list, the price action has now retraced the majority of that move.
I wouldn't write off XRP just yet, and regardless of whether it drops more from current levels, there isn’t a crypto on the entire market that has the potential that XRP does moving forward—in my opinion.
Good luck, and always use a stop loss!

XRPUSDT Luvly Jubly! XRP can I have some more please Sir? Rippl🚥Weak hand continue to roll over.🚥
🌍I LIKE WHAT I SEE🌎
🟢SeekingPips🟢 is filling his pockets. 💯
🤔 Will we get under $2 again?
We wait and see until then we continue to DCA and also BTFD.👌
❓️Are you on board the Ripple express?🚀

XRP - Food For ThougtThe total supply of XRP tokens is capped at 100 billion, ensuring that no more than 100 billion XRP tokens will ever be created. As of now, approximately 52% of the total supply is in circulation, with the remaining tokens held in escrow accounts by Ripple Labs.
Currently priced at $2.54 per token, transferring $1 billion via the XRP Ledger (XRPL) would require 393,700,787.4 XRP. However, if XRP were valued at $100,000 per token, only 10,000 tokens would be needed for the same transaction.
You might be thinking, "That would mean the XRP ecosystem, if fully distributed, would be worth $100 trillion... IMPOSSIBLE!" But let's delve into some numbers. Every day, approximately $5.7-6 trillion is transacted in the foreign exchange (FOREX) market. Annually, this equates to $2.1 quadrillion. If just 5% of that volume were moved across the XRPL, it would amount to $105 trillion. And this doesn't even account for the tokenization of stocks or real estate, which also see trillions in volume.
The Society for Worldwide Interbank Financial Telecommunication (SWIFT) system processes an average of nearly 50 million messages per day. While the exact monetary value of these transactions isn't publicly disclosed, it's estimated to be in the trillions of dollars daily. It's important to note that SWIFT and FOREX serve different functions in the financial world. So, in addition to FOREX moving $2.1 quadrillion annually and SWIFT handling another quadrillion, that's a massive volume of transactions. We now know that the XRPL ledger has recently been connected to SWIFT.
So, is a $100,000 XRP a pipe dream? Far from it. Bitcoin has hovered around $100,000 based on user sentiment. XRP represents an infrastructure of value.

XRP drops 47.5% over 18 days after setting a new all-time high.The crypto market crashed today, dragging down virtually every cryptocurrency you can imagine. XRP saw a drastic decline along with the broader market, losing 47.5% since setting a new all-time high was set just 18 days ago. This has many people worried that the decline may continue, but this drop also changed XRP's structure dramatically, merging what were previously two bullish wedges into a single broadening wedge.
If you look closely at the standard Fibonacci levels that I use—based on what I call the "equilibrium zone"—you’ll see that the uppermost and lowest Fib levels align perfectly with the price high and low throughout that 18-day period.
Although the overall market feels bearish right now, as the average retail investor's emotions run off the scale due to the incredible devaluation of their digital asset portfolios, experienced traders and investors see this drop as an opportunity.
There’s no guarantee that this is the bottom or that price will recover the higher levels that have now been lost. However, in my opinion, the chart pattern we now see as a result of this drop has amazing potential if price continues to hold above the lowest green Fib level.
It was a painful day for some and a day of incredible gains for others (shorts), but the game never stops being played. Dust yourselves off, catch your breath, get your game plan together, and keep moving forward.
Good things will come to XRP in due time.
Good luck, and always use a stop-loss!

XRP is just getting started. XRPBTC chart has lots of room left.XRP has made some spectacular moves since the "Trump election pump" began on November 4, 2024, but we haven’t seen anything yet. Bitcoin has been absorbing hundreds of billions of crypto investment dollars during this timeframe, but when money starts fleeing Bitcoin in search of more undervalued assets, XRP will be the prime beneficiary.
Bitcoin is obsolete and is being rejected by countries around the world as a consideration for strategic crypto reserves. ETH is too energy-inefficient and costly to use. XRP is the only viable option. Plus, with RLUSD, the ability to on-ramp or off-ramp has never been easier or more efficient than it is right now.
Get ready!
Good luck, and always use a stop-loss!
