#XRP/USDT Technical Analysis. Bearish and Bullish overview!XRP/USDT – Daily Technical Analysis
XRP is showing early signs of a relief bounce after completing a full corrective move within a clearly defined descending channel. Price recently swept liquidity near the 1.77–1.80 demand zone and reacted strongly from this support.
Structure & Trend
The broader market structure remains bearish, with consistent lower highs and lower lows inside the descending channel. The current move appears to be a counter-trend bounce rather than a confirmed trend reversal.
Key Levels (Fibonacci Retracement)
0.618 at 2.01 is the immediate support. Holding above this level keeps the bounce intact.
0.5 at 2.09 and 0.382 at 2.17 act as intermediate resistance levels.
0.236 at 2.26 is a strong resistance zone.
The 2.40–2.42 region is a major resistance and previous rejection area, aligning with channel resistance.
EMA Structure
Short-term EMAs have started to curl upward, indicating improving momentum. Price needs to stay above these EMAs to maintain bullish continuation.
Bullish Scenario
If price holds above 2.00–2.05 and breaks above 2.26, XRP can extend toward the 2.40–2.42 resistance zone. A daily close above the descending channel would indicate a potential trend shift.
Bearish / Risk Scenario
Failure to hold above 2.00 could lead to a pullback toward 1.90–1.80. A breakdown below 1.77 would invalidate the bounce and resume the broader downtrend.
Summary
XRP is at a critical reaction zone. Momentum has improved after a strong support bounce, but confirmation only comes above 2.40. Until then, price action remains corrective within a larger downtrend.
If you like this idea, please hit the like button and share your views in the comments section.
Thank you
#PEACE
Xrpusdforecast

XRP: Likely to Move Lower Ripple’s XRP is expected to retrace further into the green Target Zone ranging from $1.03 to $0.38 as part of a blue downward impulse, which would complete the higher-level turquoise wave B. Afterward, wave C should drive price sharply higher, ultimately setting a new high for the larger wave (Y) above the resistance at $4.09. However, if bulls manage to push the altcoin above the $3.19 resistance and the $4.09 level in the near term—a scenario we estimate has a 30% probability—it would suggest that the turquoise alt.B wave has already been completed, and our Target Zone would no longer be reached.

XRP Approaching Key Supply Zone: Break or Reject?Hi!
Bullish Scenario
A bullish continuation becomes likely only if price breaks and closes above the $2.12–$2.18 S&D zone.
If that happens:
Buyers regain control
A retest could confirm support
Next target -> descending trendline at $2.35–$2.45
Conclusion:
Break S&D -> Long toward the descending trendline.
Bearish Scenario
If price rejects from the S&D zone and fails to reclaim $2.12–$2.18:
Momentum shifts back to the downside
Price may retest the $1.90–$1.92 zone, the most recent low
Further breakdown could lead to new cycle weakness

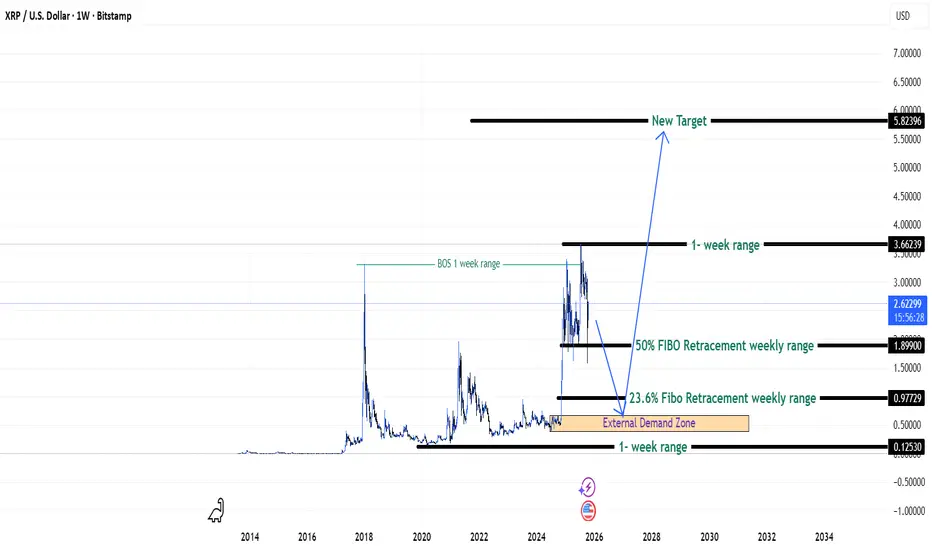
XRP Monthly Chart — Long-Term Price Outlook & Key Buying ZonesHello everyone, I’m Trader Oli.
For my first idea here on TradingView, I wanted to share my analysis of the XRP monthly chart, including a few scenarios and potential buying zones that could offer interesting long-term opportunities.
Just so you know, I’m a French-speaking trader, so some of my explanations and content will reflect that. I’ve been trading for 10 years, and I’ve now decided to start posting ideas here on a regular basis.
Feel free to comment and share your thoughts — I truly enjoy discussing with the community.
This is not financial advice, just my personal analysis.
I’m bullish on XRP over the long term, but today I wanted to highlight a potential opportunity before the price reaches new highs and potentially never returns to these levels.
Looking forward to connecting with you!

Ripple on the Verge of a Heavy DropGiven the breakdown of the trend line (green line), the formation of a supply zone (orange zone), and the price pulling back to the supply zone with a reaction at the supply level, our first support area is the blue line zones. This is because, after breaking the trend line, the price tends to oscillate between the trend line and the next level. If the price breaks below the blue level, it will reach the marked areas, indicating that Ripple could potentially drop to around 1.16. BINANCE:XRPUSDT

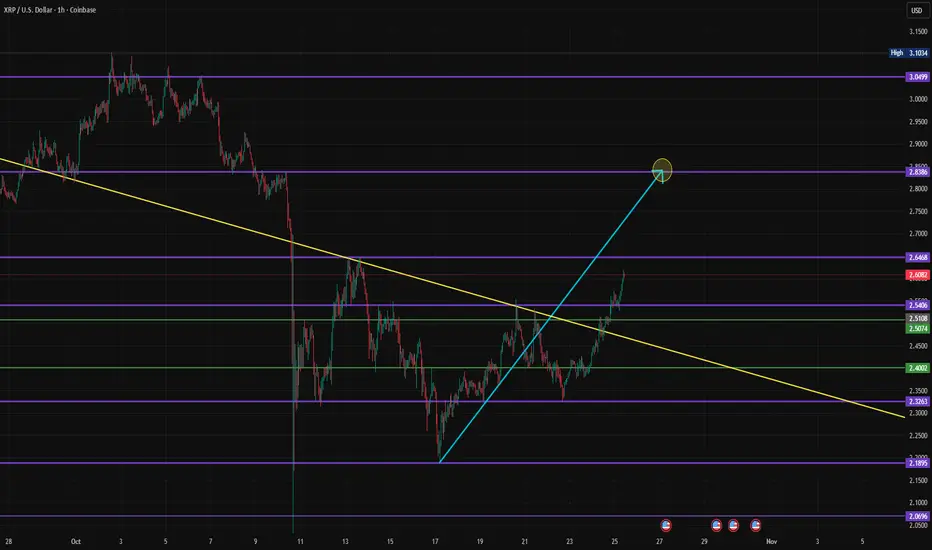
XRP Chasing New Highs - {26/10/2025}Educational Analysis says that XRPUSD or XRPUSDT (Crypto Pair) may give trend Trading opportunities from this range, according to my technical analysis.
Broker - Bitstamp
So, my analysis is based on a top-down approach from weekly to trend range to internal trend range.
So my analysis comprises of two structures: 1) Break of structure on weekly range and 2) Trading Range to fill the remaining fair value gap
Let's see what this Crypto Pair brings to the table for us in the future.
DISCLAIMER:-
This is not an entry signal. THIS IS FOR EDUCATIONAL PURPOSES ONLY.
I HAVE NO CONCERNS WITH YOUR PROFITS OR LOSS,
Happy Trading,
FX Pairs & Crypto Curreny Trade Analysis.
My Analysis is:-
Short term trend may be go to the external demand zone.
Long term trend breaks the new high after going from discount zone.
$XRPUSD - #Ripple- $2.80 RetestBITSTAMP:XRPUSD is about to break the next level of resistance - $2.54 - and has since continued its push on to $2.64 with a $2.80 Retest before we see resistance kicking in again.
More to see! @MyMIWallet
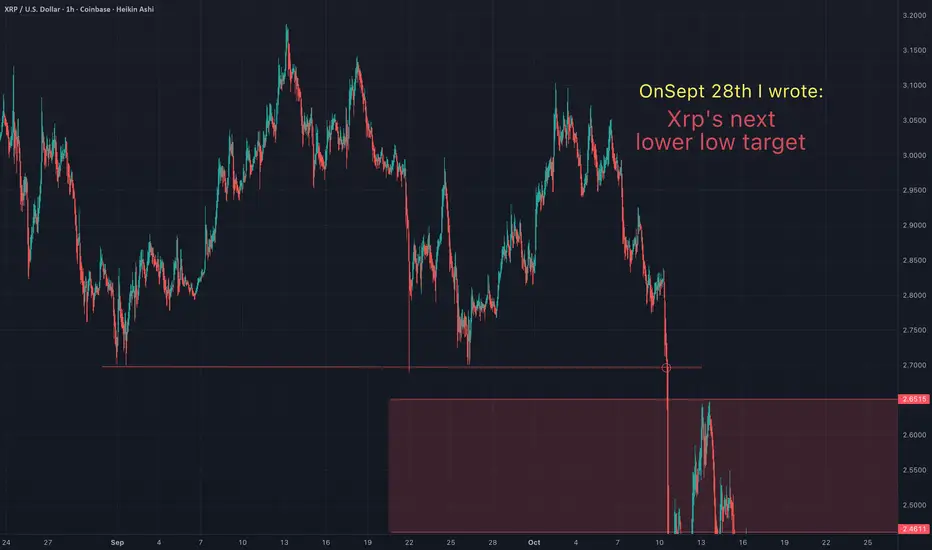
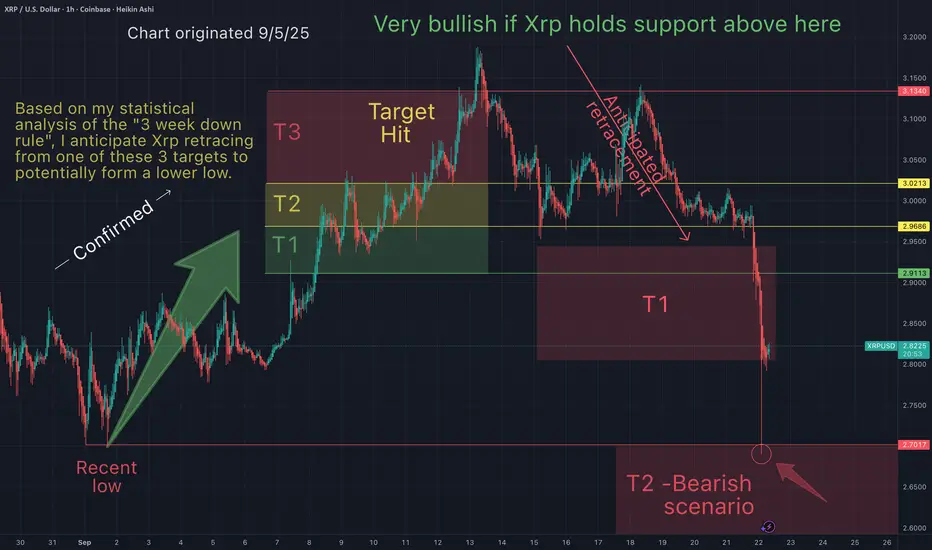
You will ask yourself "how did he know Xrp would do that"?On Sept 28th I suggested that Xrp was headed for a lower low. Congrats to all of you that took that trade and are in profit. The "3 Red Week Down Rule" played out as anticipated. TA works!
May the trends be with you.
You will ask yourself, "how did he know Xrp would do that"?On Sept 5th I wrote, "Based on my statistical analysis of the "3 week down rule", I anticipate Xrp retracing from one of these 3 targets to form a lower low". Congrats to all who rode the gains up to the 3rd target and shorted the top. Also, as expected, Xrp got the lower low for all the doubters of the "3 Red Week Down Rule".

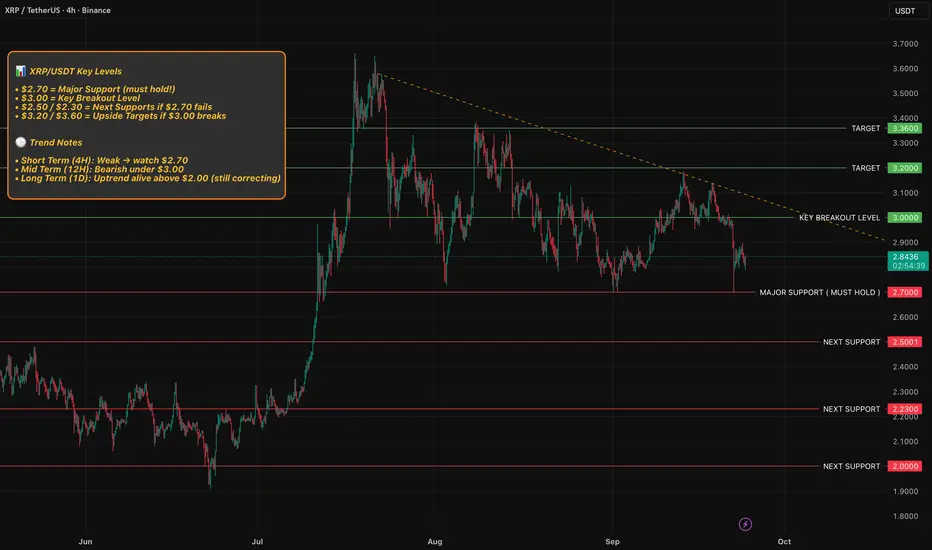
XRP is at a MAJOR decision point !
📊 XRP/USDT Key Levels
• $2.70 = Major Support (must hold!)
• $3.00 = Key Breakout Level
• $2.50 / $2.30 = Next Supports if $2.70 fails
• $3.20 / $3.60 = Upside Targets if $3.00 breaks
🕒 Trend Notes
• Short Term (4H): Weak → watch $2.70
• Mid Term (12H): Bearish under $3.00
• Long Term (1D): Uptrend alive above $2.00 (still correcting)
Thank you for reading my idea, let me know your thoughts and please support by leaving a simple comment as this helps me stay motivated and keep going.
Xrp - Lower low incoming?Here's a simplified version of my next target. This next bottom could go even lower than my red box. But i'll be tracking Xrp closely because this next low may prove to be a good buying opportunity for me.
May the trends be with you.
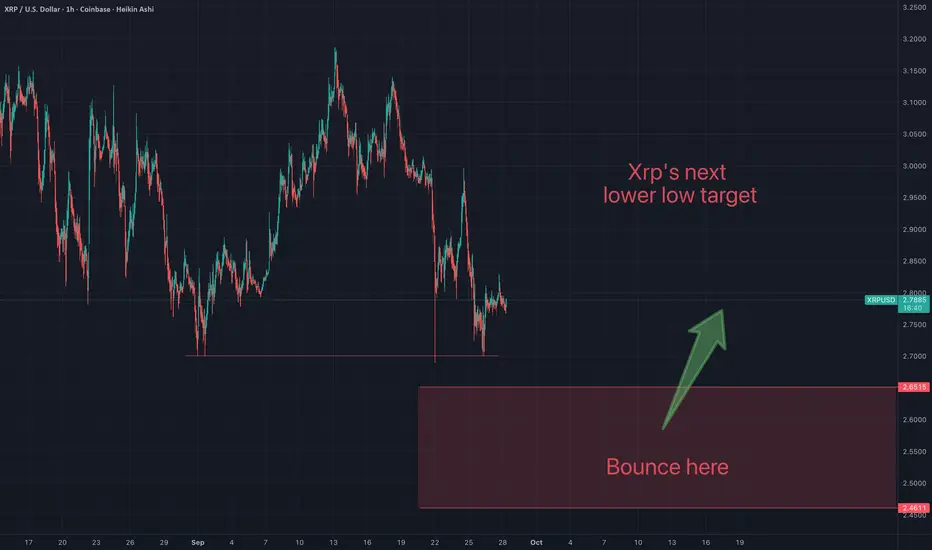
You will ask yourself "how did he know Xrp would do that"?On Sept 5th I suggested that Xrp had bottomed ($2.7), would bounce up to 1 of my 3 targets, then retrace to a lower low (below $2.7). Things are going according to what I anticipated.
Since then, the lows have been swiped...but I anticipate Xrp going even lower (below $2.65)
Congratulations to everyone who have been making gains based on my charts.
May the trends be with you.

You will ask yourself, "how did he know Xrp would do that"?On Sept 5th I suggested that Xrp would bounce up to one of my 3 targets, then retrace to a lower low. This prediction was based on the "3 Red Week Down Rule". Things are going according to what I had expected.
Congratulations to everyone who have been making gains here based on what I have been outlining on my charts.
By applying historical data, statistical analysis and technical analysis, it becomes easier to forecast price action. The most important thing is to have a strategy and these strategies have made incredible gains here across the board.
May the trends be with you.
XRP; The double top pattern is fake!!!Hello friends
Regarding the price channel we had, after a long time this channel has been broken and now a double top pattern has formed which looks fake and wants to trap sellers.
If the price continues to move upwards, it can move to the specified areas.
If the formed pattern really wants to act and we have a price drop, the bottom of the channel and its midline are good supports.
*Trade safely with us*
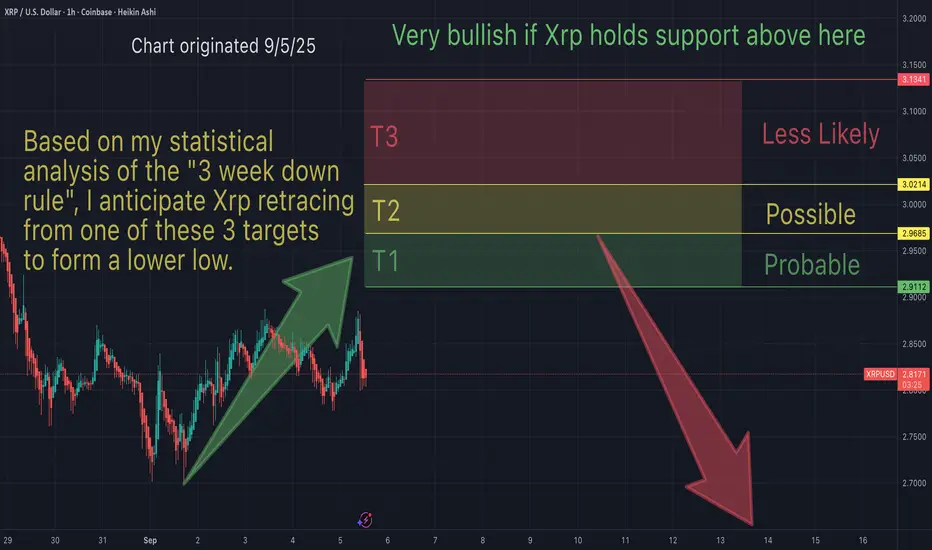
Is Xrp going lower?On Sept 5th I suggested that Xrp was bullish and heading up towards my take profit (T1-T3), then retrace.
Things are going according to what I was expecting. Congratulation to everyone who has made some gains here based on everything suggested on my charts. The most important thing is a trading strategy. And these strategies have made incedible gains over time.
Question remains, will Xrp bounce off my T1 red target or make a lower low? What do you think?
I'd like to hear form you to gauge sentiment.
May the trends (continue to) be with you.
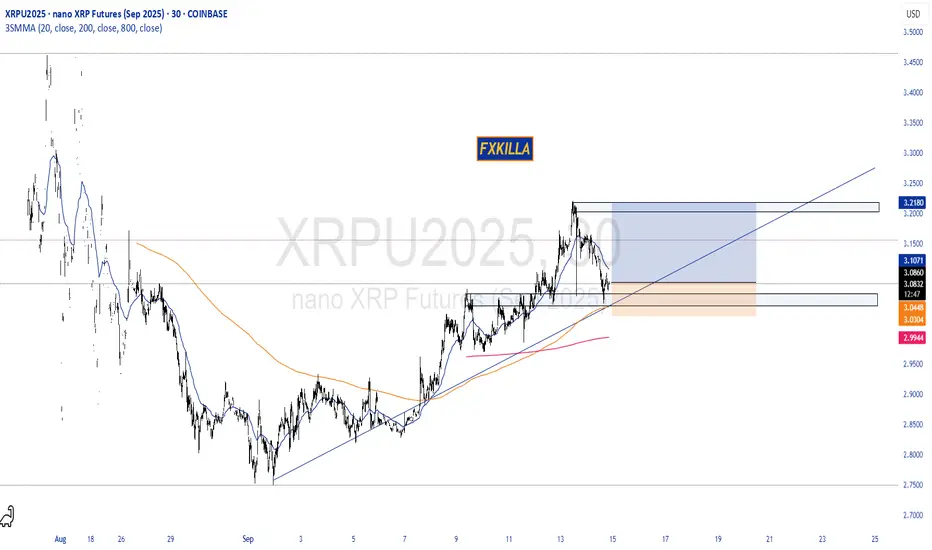
XRP HIGH PROBABILITY SETUP SOON!!!🚨 XRP HIGH PROBABILITY BUY SETUP 🚨
* Here We Can See Clearly The Next Potential Move For XRPUSD Coming Hours/Days.
* Keep Your Eyes Close On Your Trading Positions.
* Happy PIP Hunting Traders.
FXKILLA.
XLong
Xrp - Take profit targetsOn Sept 5th I suggested that Xrp would bounce to 1 of my 3 take profit targets. Target 2 has now been hit and I am trailing stops up towards T3.
Can Xrp go higher...sure. But my strategy is to take the highest probability trades so I will win way more than I lose. I don't need to ride alts to the moon, I just need to be in profit week after week, so I can keep playing this game and afford to travel the world at will.
May the trends be with you.

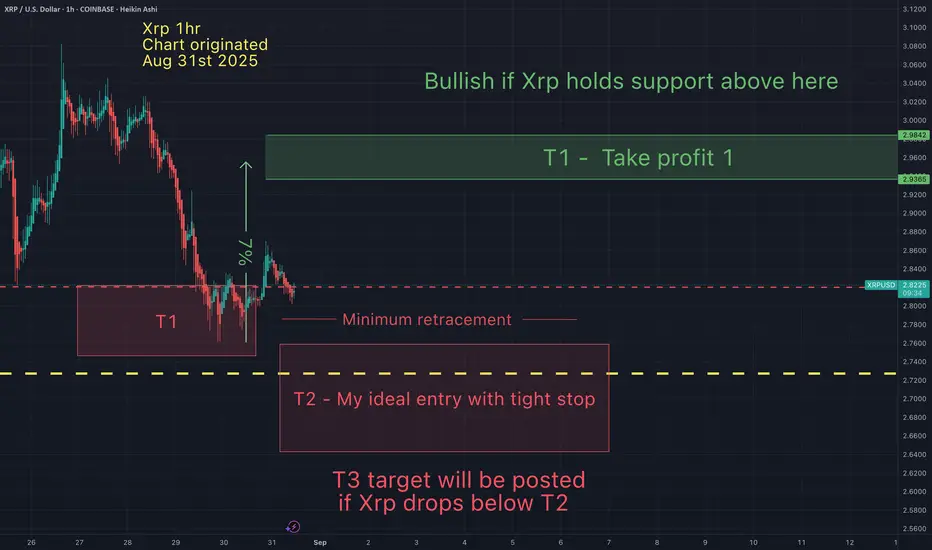
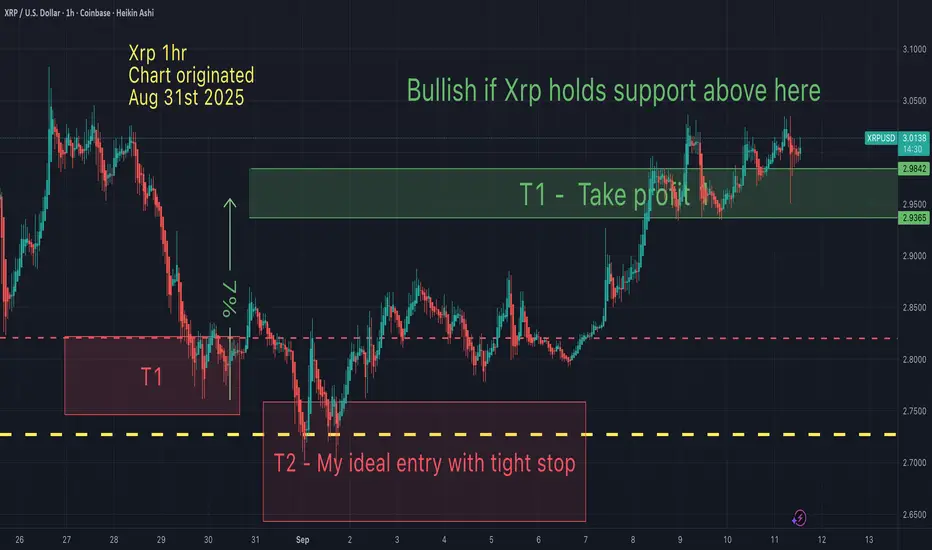
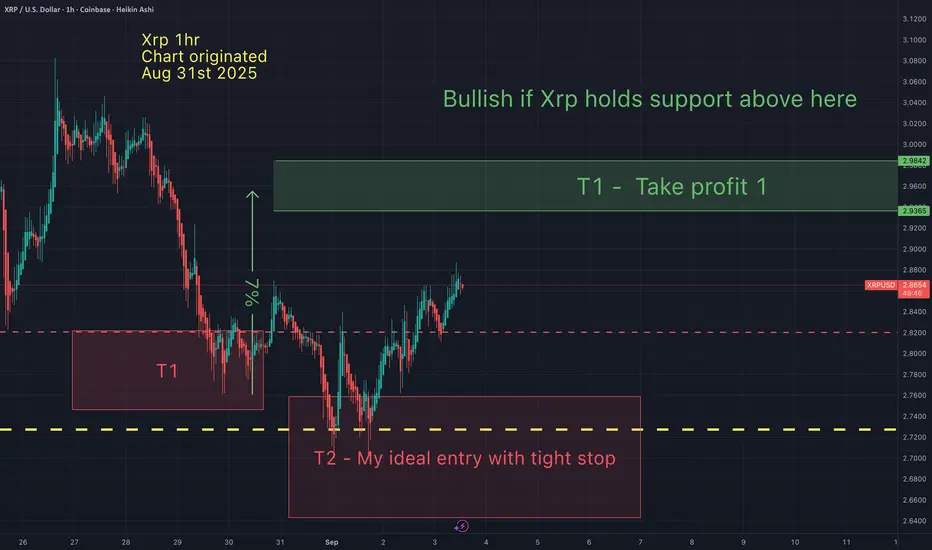
XRP - Take profit targets On Aug 31st I suggested that Xrp would drop lower (to T2) then bounce to my 1st take profit. That played out perfectly. Now the question remains, what next?
Taking some profits at this level is not a bad idea, although I do have 2 other targets slightly higher where I anticipate taking all profits. Until the 3 week down rule plays out, I continue to remain cautious.
I will post these 2 other targets in a chart to follow soon.
May the trends be with you.
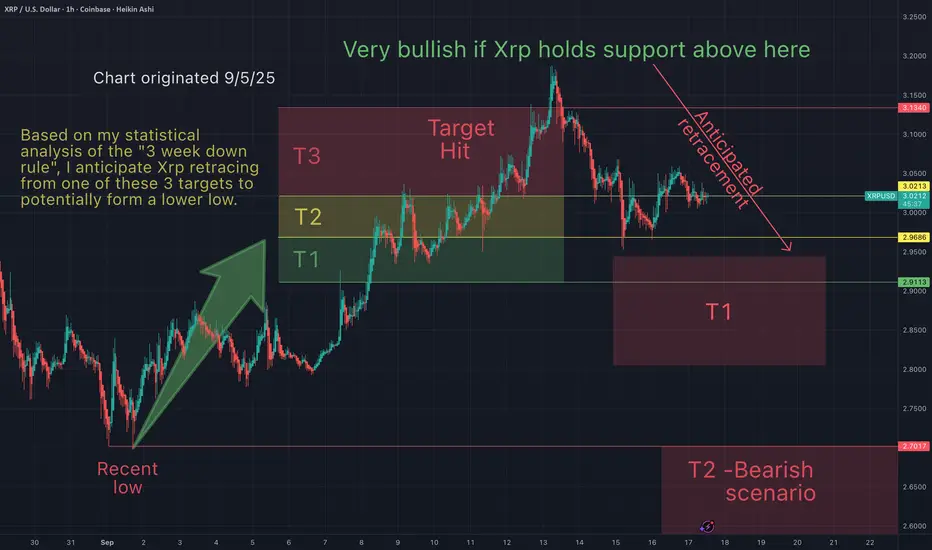
Xrp - support and resistance & take profit targetsBased on my statistical analysis of the "3 week down rule", I anticipate Xrp retracing from one of these 3 targets...to form a lower low.
I hope I'm wrong, but I'm just following the historical data and considering the statistical analysis. I can only follow the stats to anticipate price action.
This trade idea gets invalidated above T3. Although less probable, if Xrp breaks above T3 (and holds support), I become super bullish.
May the trends be with you.
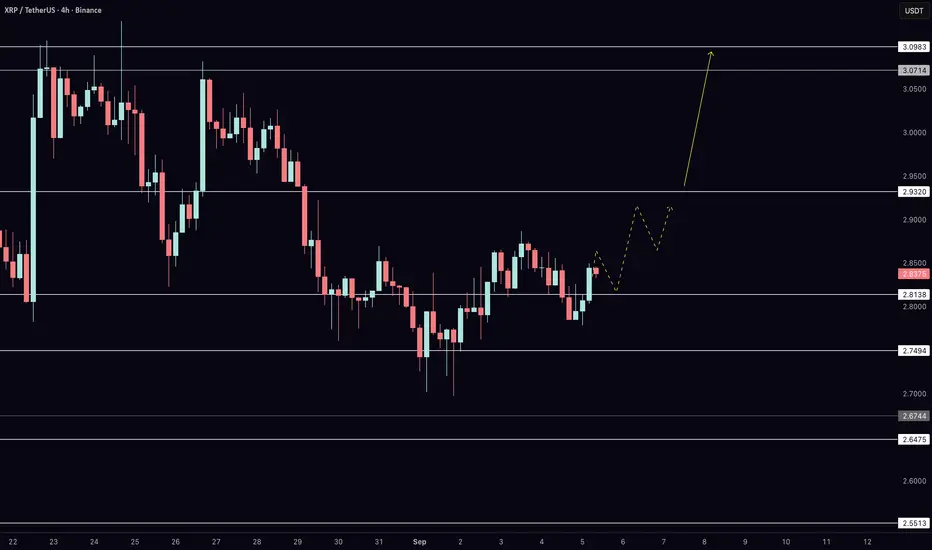
XRP Ready? NFP Volatility+Bitcoin Rally Could Drive XRP to $3.10In today’s XRP update, we analyze the 4-hour chart as price consolidates just under key resistance. After defending $2.75, buyers have managed to push XRP back toward $2.87 and $2.93. These are the levels that will decide whether momentum shifts in favor of the bulls. If $2.93 is reclaimed, the path opens toward $3.09 and possibly higher. On the downside, supports remain at $2.81 and $2.75, with deeper zones at $2.67 and $2.65 if selling pressure increases.
This update also comes on a major day for global markets, with the U.S. Non-Farm Payrolls release driving volatility across assets. Bitcoin has already shown bullish attempts on the 4-hour chart, which I covered in detail earlier today on the channel. The big question now is whether XRP can align with that strength by breaking its own resistance barriers.
Xrp - My ideal entry target was hit. Now approaching take profitMy ideal entry at T2 was hit, as anticipated. Now approaching take profit 1.
I unfortunately don't expect this rally last long before a retrace (or possibly a reversal). I hope I'm wrong. Either way, I will soon be taking profits at the indicated targets.
May the trends be with you.
XRP Could Hit All-Time High In September 2025BINANCE:XRPUSDT is trading at $2.81 , maintaining support above $2.74 at the time of writing. The altcoin’s ability to move toward its all-time high depends heavily on investor sentiment. Market participation will play a decisive role in whether XRP sustains momentum or faces pressure from renewed selling activity.
The Ichimoku Cloud indicates bullish momentum could be developing, offering a potential boost for BINANCE:XRPUSDT . This technical signal suggests favorable conditions for upward price action. If sustained, the altcoin may climb 29.8% to retest its all-time high of $3.66, a level that has remained unbroken since previous market cycles.
If investors remain cautious, BINANCE:XRPUSDT may struggle to hold its current position. A break below $2.74 would expose the token to additional losses. Continued selling pressure could push the price down to $2.54 , weakening support levels and invalidating the bullish outlook that is currently forming for XRP.
Xrp - Support and resistance & my take profitsThese are my Xrp support and resistance & my take profits. I've been patiently waiting for price to come to me. Now that my T1 has been hit, I'm hoping for a swipe of those lows for my ideal entry. I am cautiously bullish, because there is a chance Xrp goes one leg lower. For now I will chance a long from T1 and T2 (with tight stops) and take profit at my green T1 box.