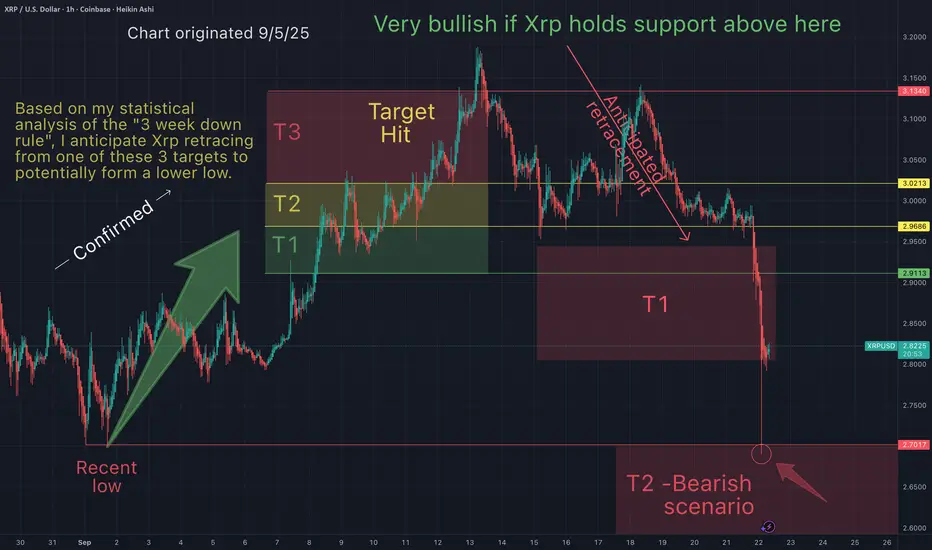
You will ask yourself "how did he know Xrp would do that"?On Sept 5th I suggested that Xrp had bottomed ($2.7), would bounce up to 1 of my 3 targets, then retrace to a lower low (below $2.7). Things are going according to what I anticipated.
Since then, the lows have been swiped...but I anticipate Xrp going even lower (below $2.65)
Congratulations to everyone who have been making gains based on my charts.
May the trends be with you.
Xrpusdlong

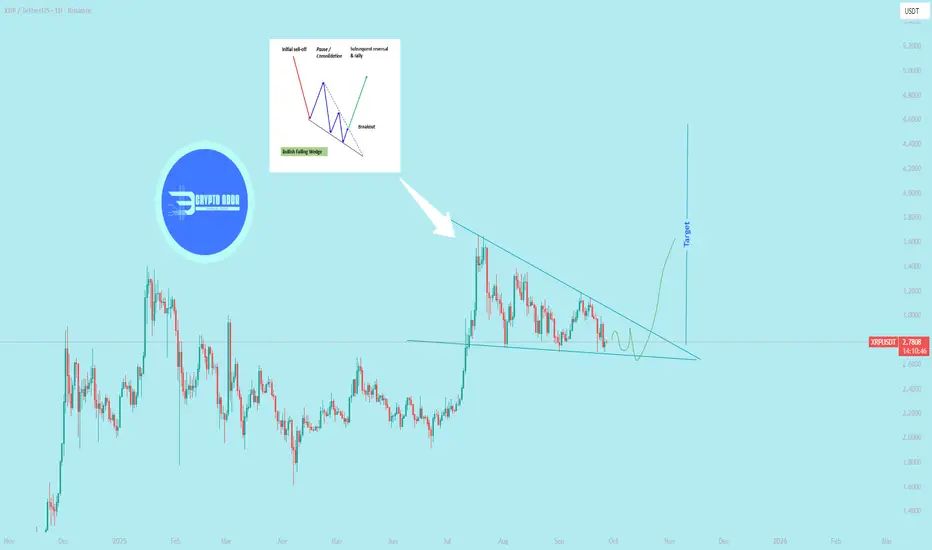
$XRP Performing falling wedge pattern in 1D
> Falling wedge as a reversal vs. continuation pattern
`As a reversal pattern`
`Location:` Occurs at the end of a prolonged downtrend.
Signal: The narrowing price action and declining volume suggest that sellers are exhausting their momentum. The pattern is completed when the price breaks above the upper resistance line, signaling a potential bullish reversal.
`As a continuation pattern`
`Location: `Appears after a strong uptrend.
Signal: The falling wedge acts as a temporary consolidation or pause in the current trend. The price then breaks out to the upside, continuing the original uptrend. @everyone
BUY AND HOLDHello friends
You see that after the good rise we had, the price has entered a correction and it is a good opportunity to buy in a stepwise manner in the price correction with capital and risk management and move with it to the specified goals.
Ripple is a currency whose holders have a good expertise in disappointing short-term traders.
Note that the holding period is at least 3 months, so be patient and observe capital management.
*Trade safely with us*

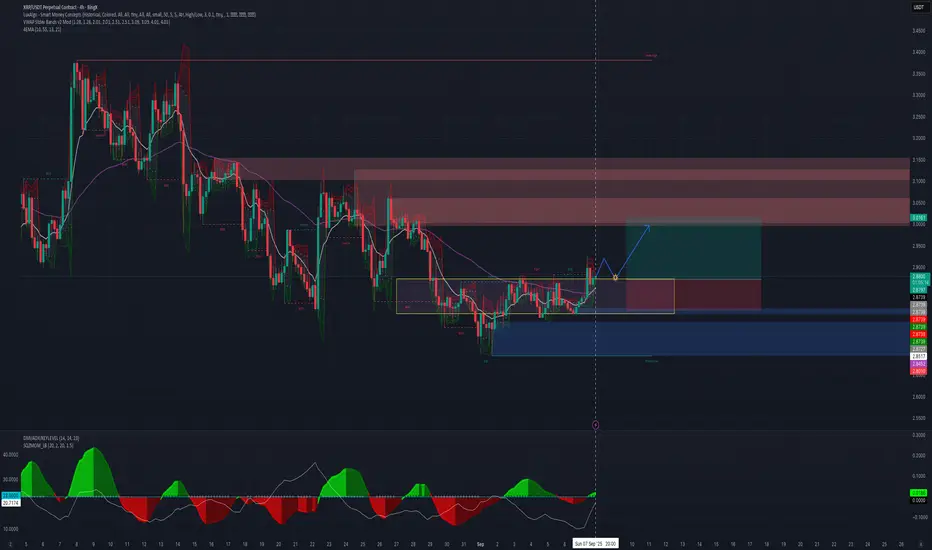
XRP ETF Approved, But Price Hurts—Will Big Players Act?At the time of writing, XRP trades at $2.84, just under the $2.85 resistance. A flip of this barrier into support would likely signal the beginning of a reversal, strengthening bullish sentiment. Traders are closely watching this zone for confirmation.
If support from LTHs holds, XRP could climb toward $2.94 in the short term. Breaching this level would pave the way for a further rise to $3.02, signaling broader recovery potential and invalidating near-term bearish concerns.
However, if market conditions worsen or LTHs shift their strategy to selling, XRP could lose momentum. The altcoin risks sliding toward $2.75 or even deeper to $2.64, putting bullish expectations in jeopardy and prolonging the consolidation phase.

Xrp - The path remains bullish!🔔Xrp ( CRYPTO:XRPUSD ) will still head higher:
🔎Analysis summary:
Looking at the overall picture, Xrp has still been consolidating for the past eight years. This does not mean however, that Xrp cannot break out and head much higher in the future. It simply all just comes down to an all time high breakout, together with the potential bullish triangle breakout.
📝Levels to watch:
$3.0, $1,7
SwingTraderPhil
SwingTrading.Simplified. | Investing.Simplified. | #LONGTERMVISION

You will ask yourself, "how did he know Xrp would do that"?On Sept 5th I suggested that Xrp would bounce up to one of my 3 targets, then retrace to a lower low. This prediction was based on the "3 Red Week Down Rule". Things are going according to what I had expected.
Congratulations to everyone who have been making gains here based on what I have been outlining on my charts.
By applying historical data, statistical analysis and technical analysis, it becomes easier to forecast price action. The most important thing is to have a strategy and these strategies have made incredible gains here across the board.
May the trends be with you.
XRP; The double top pattern is fake!!!Hello friends
Regarding the price channel we had, after a long time this channel has been broken and now a double top pattern has formed which looks fake and wants to trap sellers.
If the price continues to move upwards, it can move to the specified areas.
If the formed pattern really wants to act and we have a price drop, the bottom of the channel and its midline are good supports.
*Trade safely with us*
Is Xrp going lower?On Sept 5th I suggested that Xrp was bullish and heading up towards my take profit (T1-T3), then retrace.
Things are going according to what I was expecting. Congratulation to everyone who has made some gains here based on everything suggested on my charts. The most important thing is a trading strategy. And these strategies have made incedible gains over time.
Question remains, will Xrp bounce off my T1 red target or make a lower low? What do you think?
I'd like to hear form you to gauge sentiment.
May the trends (continue to) be with you.
XRP AGAIN!!!Hello friends
As you can see, the price had a price action gap that has now come and filled this gap and this area has become a strong support that if this area is maintained, we will go for higher targets and if the price falls further in the two support areas, we can buy in steps with capital and risk management.
*Trade safely with us*

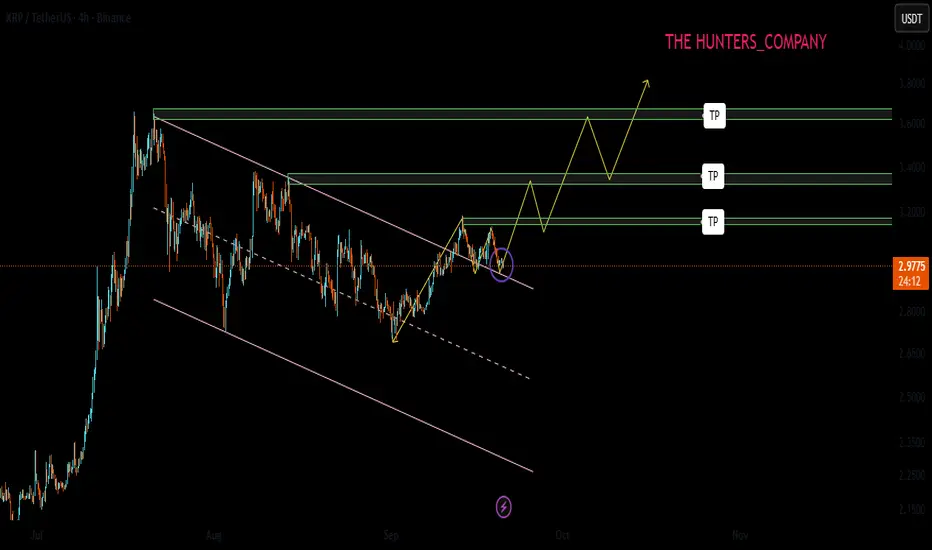
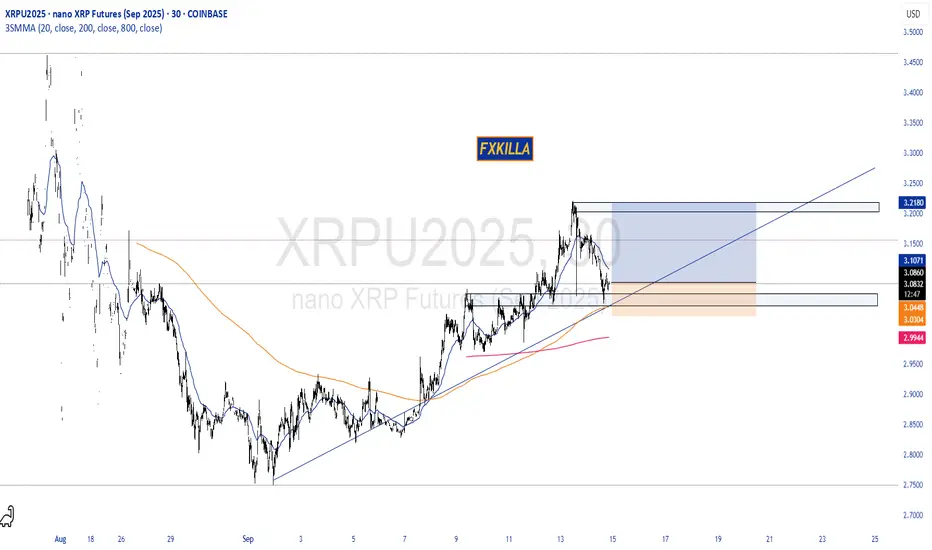
XRP HIGH PROBABILITY SETUP SOON!!!🚨 XRP HIGH PROBABILITY BUY SETUP 🚨
* Here We Can See Clearly The Next Potential Move For XRPUSD Coming Hours/Days.
* Keep Your Eyes Close On Your Trading Positions.
* Happy PIP Hunting Traders.
FXKILLA.
XRP Ready for a Bullish Rally?XRP is breaking out of a descending wedge structure on the daily chart after weeks of consolidation. Price is reclaiming moving averages (50 EMA & 100 EMA), showing renewed bullish momentum.
✏️ Entry Zone: ~$3.05
✏️ Target (TP): $5.00 (major resistance from previous high)
✏️ Stop-Loss (SL): ~$2.70(below support / invalidation level)
✏️ Risk/Reward Ratio: 1:6
Key Points
- Daily structure shows a series of higher lows holding strong.
- Breakout accompanied by volume confirmation suggests buyers stepping in.
- If price sustains above the breakout trendline, momentum could extend toward $5+.
- Losing $2.70 support would invalidate the bullish setup.
Cheers
Hexa

Xrp - Take profit targetsOn Sept 5th I suggested that Xrp would bounce to 1 of my 3 take profit targets. Target 2 has now been hit and I am trailing stops up towards T3.
Can Xrp go higher...sure. But my strategy is to take the highest probability trades so I will win way more than I lose. I don't need to ride alts to the moon, I just need to be in profit week after week, so I can keep playing this game and afford to travel the world at will.
May the trends be with you.

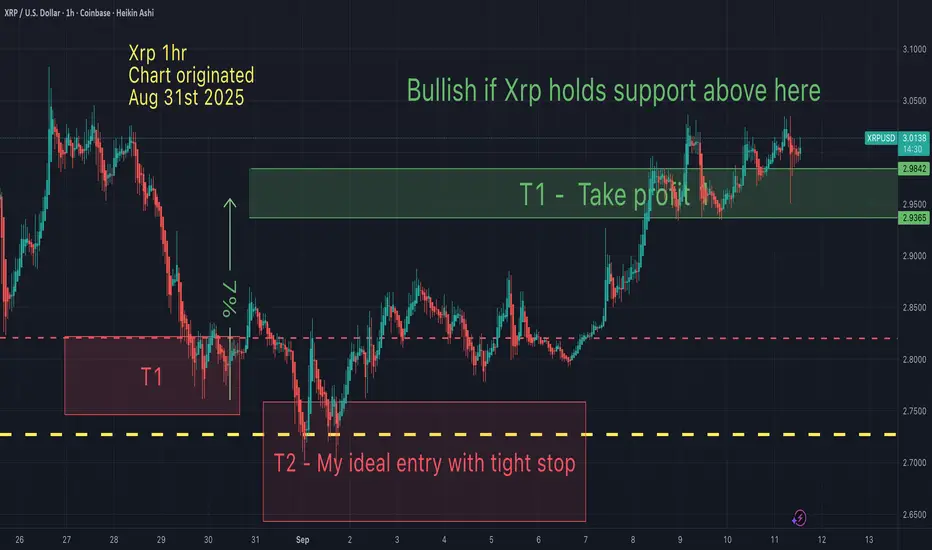
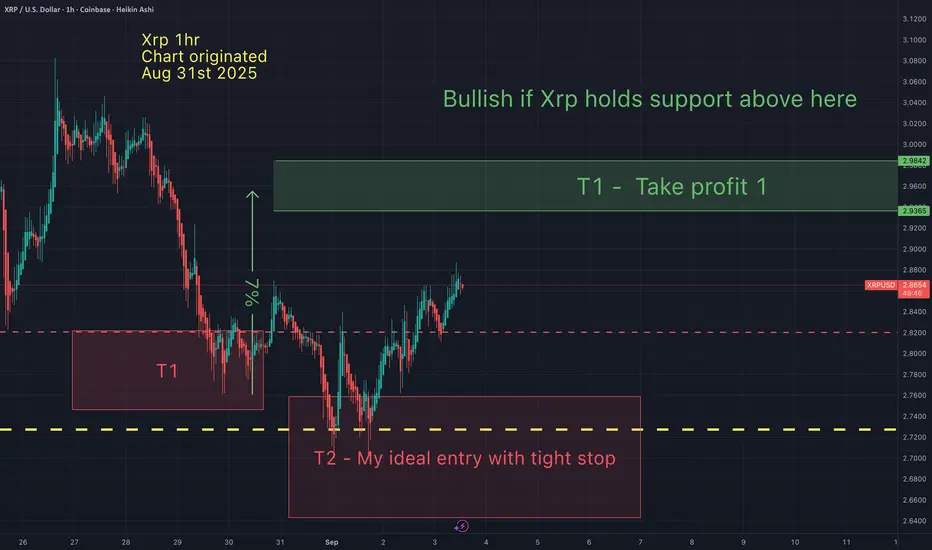
XRP - Take profit targets On Aug 31st I suggested that Xrp would drop lower (to T2) then bounce to my 1st take profit. That played out perfectly. Now the question remains, what next?
Taking some profits at this level is not a bad idea, although I do have 2 other targets slightly higher where I anticipate taking all profits. Until the 3 week down rule plays out, I continue to remain cautious.
I will post these 2 other targets in a chart to follow soon.
May the trends be with you.
XRP Up 4% as Fed Rate Cut Bets as Bulls Eye $3.00 BreakoutTitle: XRP Climbs 4% as Fed Rate Cut Bets Hit 99% — Bulls Eye $3.00 Breakout While Institutional Flows Dictate the Range
XRP extended its recent upside, gaining roughly 4% intraday as market-implied odds of a Federal Reserve rate cut surged to 99%. The move sent XRP back to the critical psychological level at $3.00, where it briefly tagged the handle before consolidating. While support has held firmly above $2.88, repeated failures near $2.99 underscore how institutional flows are increasingly dictating short-term ranges, with systematic and high-frequency participants leaning on predefined liquidity pockets. The big question now: Can bulls engineer a clean break and weekly close above $3.00 to unlock a sustained trend toward $3.30–$3.60?
Below, we unpack the macro catalyst driving crypto risk appetite, the microstructure of XRP’s order flow around $3.00, the key technical levels to watch on multiple timeframes, and how sector stories—from stablecoin settlement initiatives to real-estate tokenization narratives—might reinforce or derail momentum. We also briefly revisit the regulatory overhang and expert takes on whether the Ripple lawsuit paradoxically protected crypto market structure at a fragile moment.
1. Macro Tailwind: Fed Cut Probability at 99% Reignites Risk Appetite
• Policy backdrop: Markets now price a near-certainty of a 25-basis-point rate cut at the Fed’s September 17 meeting, according to interest-rate derivatives and futures-implied probabilities. In crypto, such a setup typically marginally lowers the discount rate on long-duration risk assets, boosts liquidity appetite, and narrows the opportunity cost of holding non-yielding tokens.
• Liquidity impulse: Crypto has historically responded positively to dovish inflections, especially when dovish signals coincide with risk-friendly cross-asset flows—softening yields, a weaker dollar, and compression in credit spreads. While a 25 bp cut is modest in isolation, the signaling effect—especially if paired with data-dependent guidance—can keep speculative positioning skewed to the upside.
• Caveat: With a 99% probability already priced, the risk of a “buy the rumor, sell the news” reaction grows. If the Fed underwhelms on forward guidance or flags stickier inflation risks, crypto could see a fast fade from local highs. That puts heavy emphasis on the path of real yields and the post-meeting press conference tone.
2. Market Microstructure: Institutions Framing the $2.88–$2.99 Range
• Range mechanics: XRP has established a resilient support shelf above $2.88, with responsive buying stepping in on each probe lower. Conversely, the $2.99–$3.00 area continues to attract supply. This behavior often reflects larger players managing liquidity with tight stop-clusters and iceberg orders near round numbers.
• Repeated failures near $2.99: Such failures typically indicate either (a) active distribution by larger holders who prefer to offload inventory into strength, or (b) systematic strategies (quant funds, HFT) sweeping micro-liquidity into offers and resetting the book to keep price contained until a new exogenous catalyst hits.
• Order book dynamics: Thick sell walls near $3.00 can be both a magnet and a lid. The magnet effect pulls price upward during risk-on waves, while the lid effect stalls rallies unless buyers are willing to consume stacked liquidity. A clean break often requires a combination of momentum ignition (positive macro headline, cross-asset tailwind) and absorption of passive offers.
3. Technical Landscape: Higher Lows Intact, $3.00 the First Gate
Intraday and hourly structure
• Trend context: XRP is trading above $2.90 and the 100-hour Simple Moving Average, keeping the immediate trend biased to the upside. A bullish trend line supports price near $2.93 (Kraken spot data), with a near-term defense zone down to $2.86–$2.88.
• Key intraday bullets:
o XRP price is facing hurdles and struggling to clear the $3.00 resistance.
o The price is trading above $2.90 and the 100-hourly SMA.
o A bullish trend line is forming with support near $2.930 on the hourly chart.
o The pair could continue to rise if it holds above the $2.860–$2.88 zone.
• Alternative micro-view: In earlier sessions, price action emphasized the $2.90–$2.92 band as an initial pivot. Dip wicks into $2.86–$2.87 have been bought, aligning with the 100-hourly SMA and trend-line confluence around $2.865–$2.93.
Momentum and RSI
• RSI stance: Hourly RSI has remained constructive, avoiding deep oversold prints even on pullbacks. That supports the “higher lows” narrative. If RSI holds above the midline on dips while price defends the trend line, bulls retain the initiative.
• Breakout momentum: A decisive hourly or 4-hour close above $3.00, followed by a successful retest holding $2.97–$2.99 as new support, would likely tilt momentum accounts long and invite fresh breakout buyers. Such a confirmatory structure reduces the probability of a false break.
Higher timeframes
• Daily chart context: The market is coiling beneath a psychological barrier. A daily close above $3.00 with expanding volume would project toward $3.15–$3.20 initially, then $3.30—a level that aligns with measured move projections from prior range widths.
• Pattern watch: A narrowing descending triangle under $3.00 has formed over recent sessions. While descending triangles are often bearish continuations, in crypto they can also resolve upward when macro tailwinds are strong. The critical tell is whether buyers keep front-running higher lows into the apex.
4. Scenario Map: Paths Above and Below $3.00
Bullish continuation (probability improves on Fed follow-through)
• Trigger: Clean 4-hour close above $3.00, ideally accompanied by rising volume and positive breadth across large-cap alts.
• Upside targets:
o $3.15–$3.20: First resistance band from prior supply and extension targets based on the local range height.
o $3.30: Key magnet if momentum persists; confluence with measured move from the $2.88–$2.99 box.
o Stretch target $3.45–$3.60: Requires continuation flow, favorable macro tone, and sector risk-on. A path to $3.60 likely needs cumulative breadth improvement and rotation from BTC or ETH dominance.
• Market structure tells:
o Flip of $3.00 to support on retests.
o Shallow pullbacks that hold the 20- and 50-period MAs on 1-hour/4-hour frames.
o Momentum divergence avoidance on RSI and MACD.
Neutral consolidation (base-building under resistance)
• Behavior: Price oscillates between $2.88 and $3.00, with volatility compressing. This can be constructive if it resolves higher. Watch for absorption at $2.92–$2.95: sustained bid depth indicates smart-money accumulation.
• Risks: Choppy stop-runs against both sides. Patience and disciplined entries near range extremes become important.
Bearish fade (news or liquidity shock)
• Triggers: Disappointing Fed guidance, risk-off in equities, or an adverse regulatory headline.
• Downside levels:
o $2.88: First defense. A clean break opens $2.86–$2.85 (trend-line and 100-hourly SMA cluster).
o $2.82–$2.80: Next liquidity shelf; loss of this area would weaken the intermediate uptrend.
o $2.72–$2.75: High-volume node from prior consolidation, potential swing-long reload zone if broader trend remains constructive.
5. Order Flow and Liquidity: What to Watch Around $3.00
• Liquidity pockets: Expect resting offers at $2.99–$3.02 and stop clusters just beyond. A burst through $3.02–$3.05 often reflects stop-fuel rather than sustained demand. The follow-through test is whether bid support appears on the first retest.
• VWAP and session profiles: Monitor intraday VWAP alignment. If price holds above session VWAP after the breakout, it signals strong participation; repeated reversion below VWAP suggests weaker conviction.
• Funding and perp basis: Elevated long funding rates without spot confirmation can forewarn of squeezes. A healthy breakout typically shows rising spot volumes and moderate-perp leverage.
6. Cross-Asset Check: Is Crypto-Wide Breadth Confirming?
• BTC and ETH: If Bitcoin holds or advances alongside XRP, breakouts tend to stick better. Conversely, a BTC pullback from resistance or ETH weakness can sap liquidity from alts and render XRP breakouts vulnerable.
• Dollar and yields: A softer DXY and benign real-yield backdrop would reinforce crypto appetite. Watch the 10-year real yield. A re-acceleration higher could cap upside in risk assets.
• Equities and credit: Positive equity momentum and stable credit spreads are supportive. Risk-off rotations often tighten crypto ranges or trigger downside wicks.
7. Narrative Catalysts: From RLUSD Payments to Real-Estate Tokenization
• RLUSD payments angle: Reports of an electric car maker tapping RLUSD for payments has refocused attention on enterprise-grade settlement rails and Ripple-adjacent stablecoin strategies. If RLUSD or similar fiat-linked tokens embed more deeply into commercial workflows, network effects could lift transactional relevance for XRP and related liquidity pools. Watch for on-chain settlement volumes and treasury adoption headlines.
• Real estate tokenization: The idea that real estate could unlock the next parabolic leg for XRP hinges on two levers: (a) tokenized asset issuance/settlement requiring high-throughput, low-cost rails; (b) institutional-grade custody and compliance frameworks. If pilot programs scale—fractionalized property claims, escrow automation, and cross-border closings—liquidity migration to chains and bridges that interoperate with Ripple ecosystem tools could grow. Concrete KPIs to track include tokenized asset market cap growth, settlement finality times, and custodial integrations with major brokers.
• Payments and remittances: Continued traction in corridors—especially where FX frictions are high—can underpin a fundamental bid for liquidity tokens. Macro volatility tends to increase remittance volumes, indirectly supportive for settlement networks if fees and speed remain competitive.
8. Regulatory Overhang: Did the Ripple Case “Save Crypto” or Just Buy Time?
• Expert discourse: Some analysts argue that the Ripple lawsuit, by forcing clarity on the application of securities laws to token distributions and secondary market activity, reduced systemic legal uncertainty at a critical juncture. The view is that the case delineated boundaries that prevented broader enforcement spillover into secondary liquidity for many assets.
• Counterpoint: Others caution that the landscape remains fragmented. Jurisdictional differences and evolving interpretations keep headline risk alive. Markets may have priced in a partial détente, but precedent is not monolithic, and appeals or parallel actions can re-introduce volatility.
• Trading implication: Regulatory catalysts tend to be binary and gap-inducing. Position sizing around major court dates and policy announcements should reflect that asymmetry.
9. Strategy Playbook: Traders’ Checklist Into and After the Fed
For breakout traders
• Entry logic: Wait for a 4-hour close above $3.00, then look for a retest of $2.97–$2.99 holding as support. Confirmation improves if the retest coincides with an intraday VWAP reclaim and rising spot volume.
• Risk: Place invalidation below the retest low or below $2.93 (trend-line confluence), depending on risk tolerance. Avoid chasing if funding spikes and spot-volume confirmation is lacking.
• Targets: Scale at $3.15–$3.20; trail remainder toward $3.30. Only pursue $3.45–$3.60 if momentum and breadth broaden.
For range traders
• Buy-response zones: $2.86–$2.88 with tight stops if trend line and 100-hour SMA remain supportive.
• Sell-response zones: $2.99–$3.00 if order flow shows absorption and lack of follow-through; cover quickly on decisive breaks.
• Tools: Footprint charts, delta, and cumulative volume profiles to gauge absorption vs. initiative buying.
For swing traders
• Thesis: As long as daily closes hold above $2.82–$2.85, the medium-term bias remains constructive. A weekly close above $3.00 turns the path of least resistance up toward $3.30–$3.60 over coming weeks, contingent on macro tone.
• Invalidations: A daily close below $2.80 suggests a breakdown from the base, opening risk to $2.72–$2.75.
10. Risk Management: Practical Guardrails
• Volatility budgeting: Size positions based on realized volatility. Consider scaling rather than all-in entries around binary macro events.
• Correlation traps: Avoid over-concentration in alts that move in lockstep. If you’re long XRP into the Fed, offset with cash or lower-beta exposures.
• Leverage discipline: Elevated funding and crowded longs can unwind fast. Keep leverage modest and stops hard, especially near psychological levels like $3.00.
• News reaction function: Predefine responses to three scenarios—dovish surprise, baseline cut with cautious guidance, or hawkish tilt. Adjust exposure automatically rather than emotionally.
11. What the Tape Is Saying Now
• Price behavior: XRP has surged through $2.88, probed $2.92, and repeatedly tested $2.99–$3.00. Each dip toward $2.86–$2.90 has found buyers, aligning with the 100-hourly SMA and ascending trend line near $2.93.
• Participation: The best breakouts in XRP historically come on broad-based alt strength and rising spot participation. Watch whether volumes cluster on green candles during NY hours; institutional involvement often intensifies then.
• Sentiment skew: Elevated expectations around the Fed cut can create asymmetry—good news may be “priced in,” while any disappointment can trigger fast downside to first supports.
12. Price Levels Summary
• Immediate resistance: $3.00, then $3.02–$3.05. A strong break above targets $3.15–$3.20 and $3.30.
• Immediate support: $2.93 trend-line, then $2.90, with a stronger shelf at $2.86–$2.88. Below that, $2.82–$2.85 and $2.72–$2.75.
• Momentum markers: RSI holding above midline on pullbacks; MACD on 1-hour/4-hour staying positive; rising OBV on rallies.
13. Frequently Asked Questions
Q: Why does $3.00 matter so much?
A: It’s a psychological round number clustered with offers, stop orders, and optionality hedging. Breaking and holding above it often forces systematic strategies to rebalance, creating momentum.
Q: How reliable is the Fed cut catalyst for crypto?
A: Cuts tend to support risk assets if they signal easier financial conditions ahead. However, when odds are near 100%, the market demands supportive guidance to avoid a fade. It’s the path of policy, not the single step, that matters.
Q: Could XRP reach $3.60 on this leg?
A: It’s possible if $3.00 flips to support, $3.15–$3.30 clears with volume, and macro remains benign. Realistically, $3.15–$3.30 is the first major test; $3.45–$3.60 would likely need follow-through and broader alt strength.
Q: How do institutional flows “dictate” the range?
A: Large players anchor liquidity at key levels, providing both buy-side and sell-side depth. They often fade extremes unless a meaningful catalyst forces them to move, resulting in repeated tests and rejections around known levels.
Q: Is the descending triangle bearish?
A: By textbook definition, yes. But crypto often violates textbook patterns when macro liquidity turns supportive. The resolution depends on who runs out of patience first—sellers defending the ceiling or buyers stepping up on higher lows.
14. Bottom Line
• The setup: XRP is coiled just beneath $3.00 after a 4–5% push, with $2.88–$2.93 acting as a dependable springboard. The hourly trend remains constructive above the 100-hour SMA, and RSI supports further upside if pullbacks stay shallow.
• The catalyst: A near-certain Fed cut anchors the macro bid, but with odds already near 99%, sustained upside likely requires reassuring forward guidance or a concurrent broad-based crypto risk-on.
• The trigger: A decisive close and hold above $3.00 is the primary unlock. If achieved, $3.15–$3.20 and then $3.30 come into view, with $3.45–$3.60 reserved for stronger momentum phases.
• The risk: Failure to clear $3.00 followed by a loss of $2.86–$2.88 would hand control back to sellers and invite a deeper test toward $2.80–$2.75.
As XRP consolidates under $3.00 and the descending triangle narrows, the next directional move will likely hinge on whether institutional sellers maintain the lid or capitulate to momentum post-Fed. Traders should remain flexible, respect key levels, and let the tape confirm the path.

XRPUSD - Monthly Not Done Yet XRPUSD is looking for more with this nice almost like flag structure signaling a further breakout on the Monthly
This can be seen on the RSI in the green circles. Two peaks are created as price moves up. This pattern is repeating itself.
Very bullish, probably even leading alts into altszn

XRPUSD is following our projectionThe red pressure line is broken.
After dabbling with the L-MLH, price decided to jump back into the fork, projecting a potential huge move ahead.
But not so fast!
The slope of the white fork is super steep.
In such situations I like to throw a Modified-Shiff-Fork, or a Shiff-Fork on the chart too. This gives me often more realistic profit targets.
The trade could be managed by using the light-grey fork's centerline as PTG1 and the rest of the position aims for the white mooning centerline §8-)
A second steak of the position could be loaded, after the yellow CIB-Line is broken. I like to wait for a test of it after the crack and jump-above. It's the same like a test/retest of a Medianline-Parallel if price broke out of it.
Let's have fun here §8-)

From Sideways to Skyward: XRP Setting Up Another BoomXRP has been following a simple pattern, accumulate, then boom. We saw this play out earlier where months of sideways action led to a sharp rally.
Right now, the weekly chart is showing a similar setup. Price is consolidating again inside a tight range, holding steady in the current zone. This looks like healthy accumulation before the next move.
If history repeats, a breakout from this consolidation could trigger another explosive leg upward, potentially sending XRP much higher. As long as it stays above the accumulation box, the bias remains bullish.
DYOR, NFA
Next updates coming soon!

what I will do with xrp“Expecting a pullback near 2.8712, aiming for 3.01. This represents a potential 5% move, with a protective stop around 2.79 (≈2.5%), giving a risk-reward ratio of 2:1.”
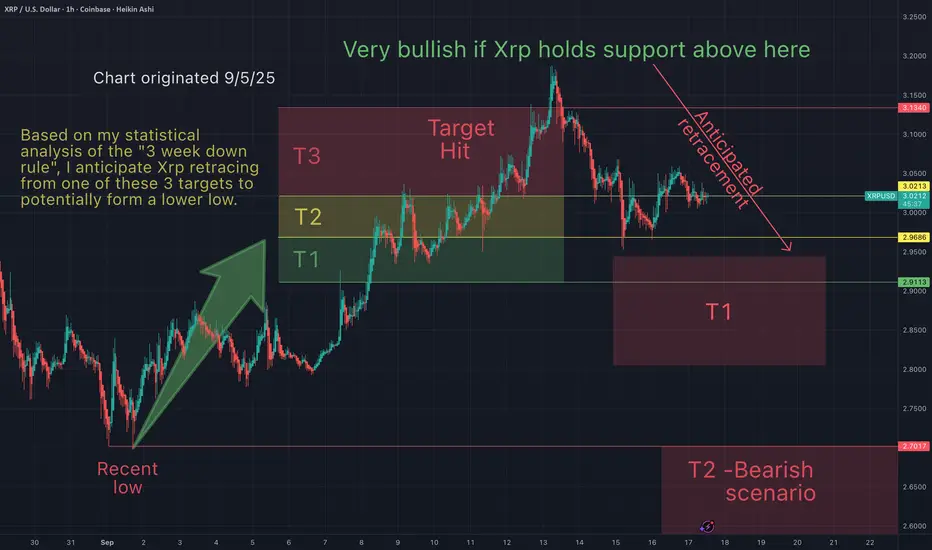
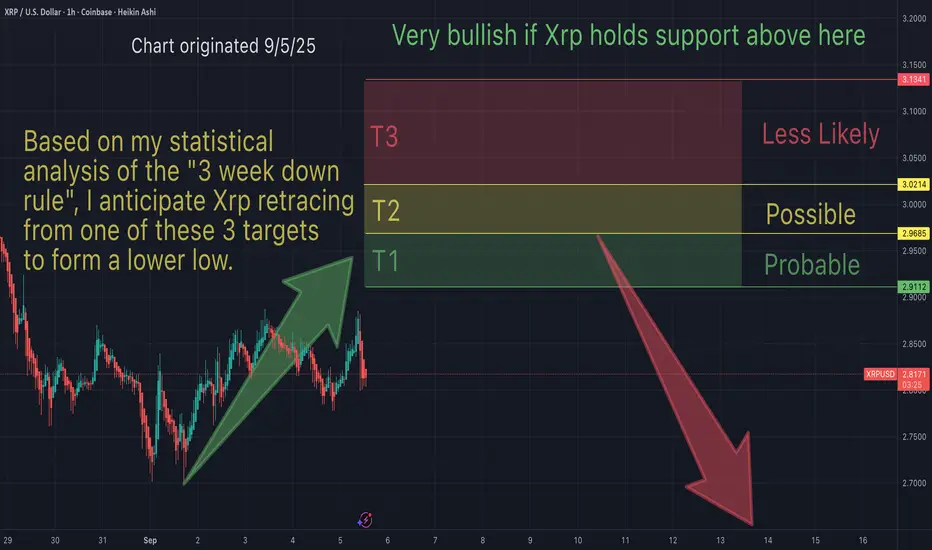
Xrp - support and resistance & take profit targetsBased on my statistical analysis of the "3 week down rule", I anticipate Xrp retracing from one of these 3 targets...to form a lower low.
I hope I'm wrong, but I'm just following the historical data and considering the statistical analysis. I can only follow the stats to anticipate price action.
This trade idea gets invalidated above T3. Although less probable, if Xrp breaks above T3 (and holds support), I become super bullish.
May the trends be with you.
XRP Price Update: Next Targets $2.93 and $3.19In today’s XRP update, we focus on the 4-hour chart where price is consolidating between $2.81 and $2.87. After defending the $2.75 level yesterday, XRP is trying to build a recovery structure. The big question now is whether buyers can reclaim $2.87 and push toward $2.93. A breakout there would open the path to $3.09, which is the key resistance on this timeframe.
On the downside, immediate support is at $2.81. If lost, pressure shifts back to $2.75, and below that the deeper buyer zones at $2.67 and $2.65 come into focus. My bias remains for upside, but confirmation comes only with resistance breakouts. Watch these levels closely as the short-term structure develops.

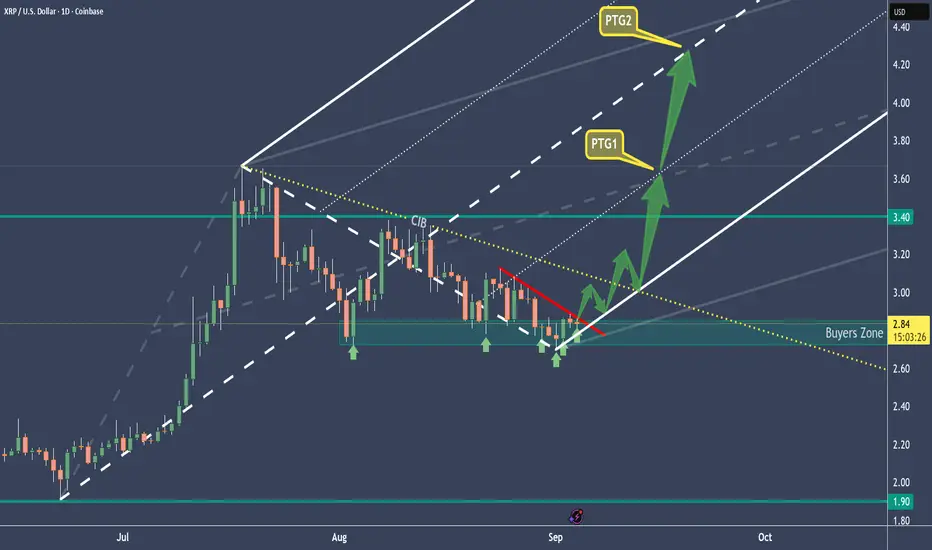
XRPUSD - How Ripple is preparing for a potential big moveThe white Fork marks the most probable path of price.
There is currently no indication, that Ripple really want's to take off to the upside, but: We have some potential points that could give us a clue:
1. Price seems to stabilize at the L-MLH.
2. There's a clear pressing going on (red line), which mostly will vanish when price pops above.
3. The L-MLH and the yellow CIB are pullback levels where price pauses
If we trade below the Support Zone, the idea is thrown in the bin.
Let's hold the water and see what happens .
Xrp - My ideal entry target was hit. Now approaching take profitMy ideal entry at T2 was hit, as anticipated. Now approaching take profit 1.
I unfortunately don't expect this rally last long before a retrace (or possibly a reversal). I hope I'm wrong. Either way, I will soon be taking profits at the indicated targets.
May the trends be with you.
Is $XRP ready for another leg higher? After breaking out of a 6 month consolidation, XRP broke out from 2.4 and hit 3.6 in late July - is it ready to test the 3.6 level again after consolidating for about 40 days? 2.85 appears to be a good entry with a stop loss of 2.6. Best of luck if you are following.
