DeGRAM | XRPUSD reached the strong support area📊 Technical Analysis
● XRP is forming a bullish base inside the 1.98–2.03 support zone, where multiple rebounds confirm strong demand. A recovery toward the descending resistance line near 2.09 is likely as price stabilizes after a capitulation wick and begins building higher lows.
● The broader structure shows compression against downtrend resistance, favoring an upward retest once buyers regain short-term control.
💡 Fundamental Analysis
● Market sentiment improves as Ripple’s institutional partnerships expand and crypto flows strengthen, supporting medium-term accumulation.
✨ Summary
● Long bias: support zone holds → targets 2.06 and 2.09; key support 1.98–2.03.
-------------------
Share your opinion in the comments and support the idea with a like. Thanks for your support!
Xrpusdsignal

DeGRAM | XRPUSDT held the support area📊 Technical Analysis
● XRP/USD is rebounding from the green support zone, forming higher lows and breaking into a short-term ascending structure aimed toward 2.0990.
● The price is approaching the descending resistance line; a push from the rising trendline suggests momentum building for a test of 2.0990 and potentially the upper trendline next.
💡 Fundamental Analysis
● FXStreet notes improving sentiment around altcoins as liquidity returns and regulatory pressure eases, supporting short-term upside for XRP.
✨ Summary
● Long bias: targets 2.0990 while support holds near 2.02.
-------------------
Share your opinion in the comments and support the idea with a like. Thanks for your support!

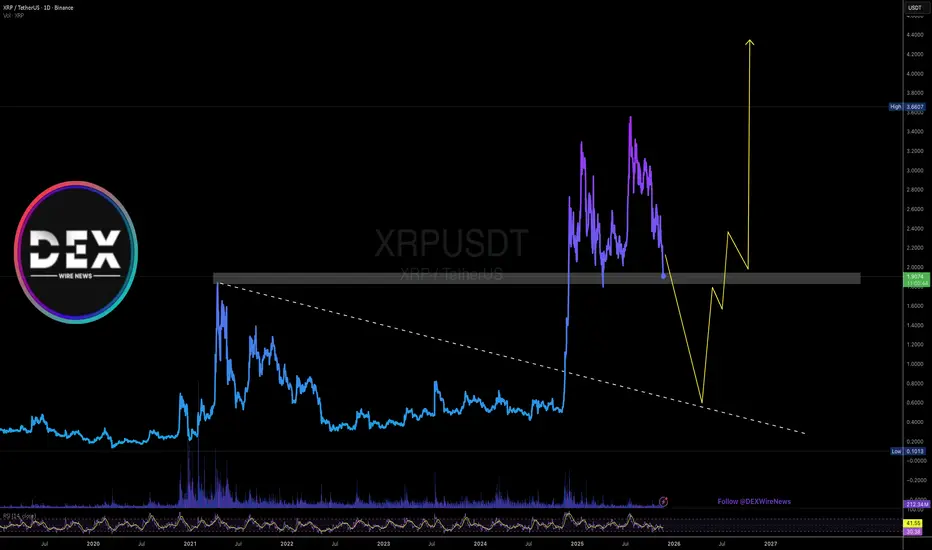
XRP – Bearish Breakout Expected from Rising ABC StructureXRP has formed a rising corrective ABC structure, moving inside a narrowing ascending channel. The market has already shown weakness near the upper boundary, and the structure looks exhausted.
I expect a downward breakout from this ABC formation , which should lead to a broader corrective phase.
The primary downside target is located near $0.90 , aligning with a major horizontal support level and the origin of the previous impulsive move.

XRP/USD Swing Trade Playbook — Bullish Breakout Profit Pathway📌 Asset:
XRP/USD – “Ripple vs U.S. Dollar” | Crypto Market Profit Pathway Setup (Swing Trade)
📈 Trade Plan (Bullish Bias)
Waiting for a HULL Moving Average breakout above 2.2500 to confirm bullish continuation momentum.
Once price breaks decisively, the structure opens room for a strong push toward the next liquidity zone.
🎯 Entry
Enter any price level AFTER a clean Hull MA breakout with candle body confirmation + volume uptick.
No breakout → No trade.
🛡️ Stop-Loss (Risk Protocol)
SL: 2.0500 — This is the Thief SL, designed to protect capital once breakout is confirmed.
Dear Ladies & Gentlemen (Thief OG’s), adjust your SL according to:
Your personal risk tolerance
Your system’s volatility rules
Timeframe-based noise filtering
You’re not required to follow my SL — trade safe, protect your bag. 🛡️
💰 Target (Exit Strategy)
Our next potential trouble zone — where the police (sellers) are waiting — stands near:
TP: 2.5500
This zone aligns with:
Overbought conditions
Previous liquidity sweep
Correlation pressure from broader crypto sentiment
Dear Ladies & Gentlemen (Thief OG’s), take profits based on your own system. Take money → Leave the market → Stay safe. 💸
🔍 Related Pairs to Watch (Correlation & Confirmation Signals)
1️⃣ BITSTAMP:BTCUSD – Bitcoin
Why watch it?
XRP often follows BTC’s trend.
A BTC breakout boosts liquidity across altcoins.
BTC above key moving averages = XRP tailwind.
2️⃣ BITSTAMP:ETHUSD – Ethereum
Why watch it?
Strong indicator of altcoin strength.
ETH momentum = altcoins tend to expand.
If ETH stalls while XRP breaks → caution (divergence).
3️⃣ COINBASE:XLMUSD – Stellar
Why watch it?
XRP & XLM share similar utility narratives.
High correlation during liquidity rotations.
XLM breakout → XRP often lags then follows.
4️⃣ BITSTAMP:XRPBTC Pair
Why watch it?
Shows whether XRP is outperforming BTC.
Rising XRP/BTC ratio = stronger XRP pump potential.
Falling ratio = breakout may fake out.
🧭 Key Correlation Notes
BTC strength = XRP stability + possible breakout fuel
ALT dominance rising → higher probability XRP joins the move
USD weakness boosts all crypto pairs priced in USD
Watch volatility cycles: XRP typically pumps after Bitcoin’s volatility cools

DeGRAM | XRPUSD will correct from the resistance line📊 Technical Analysis
● XRP/USD repeatedly rejects the descending resistance line, forming lower highs and preserving the broader bearish structure inside the falling channel.
● Price is approaching the upper boundary near 2.28–2.32, where previous reversals occurred, suggesting limited bullish continuation before a likely drop toward channel support.
💡 Fundamental Analysis
● Regulatory uncertainty around Ripple and slowing altcoin inflows continue to cap upside potential as traders rotate into stronger majors.
✨ Summary
● Bearish bias below 2.32. Targets: 2.10 → 1.95. Resistance: 2.32.
-------------------
Share your opinion in the comments and support the idea with a like. Thanks for your support!

XRP Approaching Key Supply Zone: Break or Reject?Hi!
Bullish Scenario
A bullish continuation becomes likely only if price breaks and closes above the $2.12–$2.18 S&D zone.
If that happens:
Buyers regain control
A retest could confirm support
Next target -> descending trendline at $2.35–$2.45
Conclusion:
Break S&D -> Long toward the descending trendline.
Bearish Scenario
If price rejects from the S&D zone and fails to reclaim $2.12–$2.18:
Momentum shifts back to the downside
Price may retest the $1.90–$1.92 zone, the most recent low
Further breakdown could lead to new cycle weakness

Breaking; It is Time to Sell $XRPThe price of the notable altcoin Ripple ( CRYPTOCAP:XRP ), saw its value nosedived tanking to the $1.9 support enroute to breaking the $1.8 support point.
With the RSI at 30, if CRYPTOCAP:XRP breaks the $1.8 bottom, we will expect a selling spree to the $0.60 support offering a buy opportunity for traders and investors. Hence the statement "It is time to sale CRYPTOCAP:XRP ".
A bearish symmetrical triangle is already forming as the asset breaks the $1.9 support point.
However, in a bullish thesis, if the asset makes a bounce from the current support point to the $2.5 resistant there might be hope for Ripple.
In another news, XRP has fallen 12% this week as its ongoing decline continues despite growing institutional interest. The altcoin is struggling to recover, even with two XRP ETFs already live and two more scheduled to launch next week.
What Is XRP / XRP Ledger?
Launched in 2012, the XRP Ledger (XRPL) is an open-source, permissionless and decentralized technology. Benefits of the XRP Ledger include its low-cost ($0.0002 to transact), speed (settling transactions in 3-5 seconds), scalability (1,500 transactions per second) and inherently green attributes (carbon-neutral and energy-efficient). The XRP Ledger also features the first decentralized exchange (DEX) and custom tokenization capabilities built into the protocol. Since 2012, the XRP Ledger has been operating reliably, having closed 70 million ledgers.
DeGRAM | XRPUSD will test the $2 level📊 Technical Analysis
● XRP/USD remains inside a broad descending channel, rejecting the upper resistance line near 2.45 and failing to reclaim the broken structure.
● Price is retesting the 2.25–2.30 resistance zone from below, and rejection here opens the path toward the 2.00 level and the channel’s lower boundary.
💡 Fundamental Analysis
● Ripple faces renewed pressure as broader altcoin sentiment weakens and regulatory uncertainty persists.
✨ Summary
Resistance: 2.25–2.30. Targets: 2.05 → 2.00. Medium-term bearish bias below channel resistance.
-------------------
Share your opinion in the comments and support the idea with a like. Thanks for your support!

Ripple Market Warning! Strong Bearish Setup Emerging🚨 XRP/USDT BEARISH REVERSAL SETUP 🎯 | Swing Trade Blueprint
Asset: XRP/USDT (Ripple vs Tether) 💎
Market: Cryptocurrency
Strategy: Swing Trade - BEARISH 🐻📉
📊 TRADE SETUP
🔴 BIAS: Bearish Momentum Building
📍 ENTRY: Flexible Entry - Any Current Price Level ($2.26 area)
⚠️ RISK MANAGEMENT (CRITICAL)
🛑 Stop Loss Reference: $2.7000
⚡ IMPORTANT: This is a reference SL only. Adjust based on YOUR strategy & risk tolerance.
✅ PRO TIP: Place SL AFTER breakout confirmation. DO NOT set it prematurely!
🎯 Dear Traders & OG's: I'm NOT recommending you blindly follow my SL. This is YOUR trade, YOUR capital, YOUR risk. Manage it accordingly!
🎯 PROFIT TARGET
🔥 PRIMARY TARGET: $1.6000
📌 Technical Support:
Triangular Moving Average acting as strong support zone
Oversold conditions developing
Liquidity trap zone - TAKE PROFITS strategically
💰 Risk Disclaimer: I'm NOT recommending you follow only my TP. Scale out, take profits at YOUR comfort levels. Secure the bag at YOUR own discretion!
🔗 CORRELATED PAIRS TO WATCH
Direct XRP Pairs:
XRP/USD 💵 - Monitor for divergence signals
XRP/BTC ₿ - Bitcoin pair correlation strength
XRP/ETH Ξ - Ethereum cross-pair dynamics
Related Market Movers:
BTC/USDT - Bitcoin dominance impacts alt direction
ETH/USDT - Ethereum weakness = altcoin pressure
SOL/USDT - High-cap alt comparison
ADA/USDT - Similar smart contract platform competitor
🧠 KEY TECHNICAL FACTORS
✅ Descending channel formation
✅ Triangular MA support confluence
✅ Oversold RSI conditions approaching
✅ Volume divergence patterns
✅ Liquidity zones below current price
🔗 Market Correlation Logic:
When BTC/USDT shows weakness, XRP typically follows with amplified moves. Monitor Bitcoin for confirmation of bearish continuation. If Bitcoin stabilizes above key support, XRP may find temporary relief before next leg down.
⚡ ACTION PLAN
1️⃣ ENTRY: Scale in at current levels
2️⃣ CONFIRMATION: Wait for breakout validation
3️⃣ STOP PLACEMENT: Set SL after confirmation (suggest above $2.70)
4️⃣ PROFIT MANAGEMENT: Scale out profits toward $1.60 target
5️⃣ MONITORING: Watch BTC dominance & overall crypto market sentiment
🔔 Follow for more setups | 👍 Like if this helps | 💬 Comment your thoughts!
📊 Stay disciplined. Trade smart. Protect capital.
#XRPUSDT #CryptoTrading #SwingTrade #BearishSetup #RippleTrade #CryptoAnalysis #TradingView #AltcoinTrading

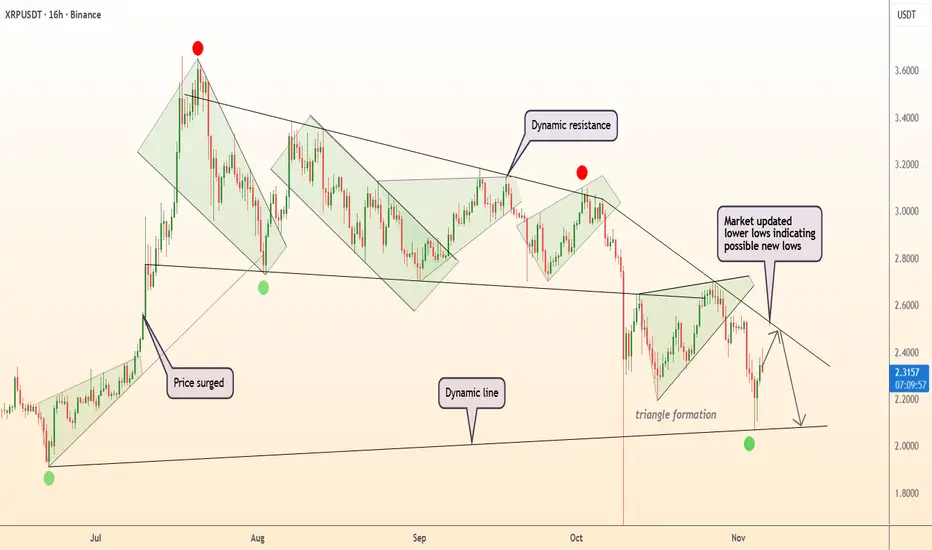
DeGRAM | XRPUSD keeps a descending structure📊 Technical Analysis
● XRP/USD remains below the dynamic resistance line, forming a series of lower highs and lower lows that reinforce the bearish structure. The recent rejection from $2.60 and continuation within the descending pattern point to possible retests of lower supports.
● A breakdown below the $2.20–$2.00 zone could accelerate selling pressure, confirming a move toward new lows within the broader downtrend channel.
💡 Fundamental Analysis
● Recent market uncertainty and reduced risk appetite among crypto investors continue to weigh on altcoins, with XRP showing weaker recovery compared to peers.
✨ Summary
● Key resistance: $2.60. Support: $2.00. A sustained move below $2.20 could extend the decline toward $1.90.
-------------------
Share your opinion in the comments and support the idea with a like. Thanks for your support!
XRP Profits at 12-Month Low, But New Investors Eye Price RevivalAt the time of writing, XRP trades at $2.26, down 10% over the past 24 hours. The altcoin continues to face resistance amid broader bearish market sentiment. However, strong support remains near the $2.27 mark, offering hope for a potential recovery.
If XRP maintains this key support level, it may move sideways in the short term, with possible rebounds to $2.35 or $2.45 as buyers regain confidence. This consolidation could set the stage for a stronger move upward later in November.
However, if selling pressure intensifies, XRP could fall below $2.27, slipping through $2.23 and hitting $2.13. Such a drop would invalidate the bullish scenario and confirm a deeper corrective phase.

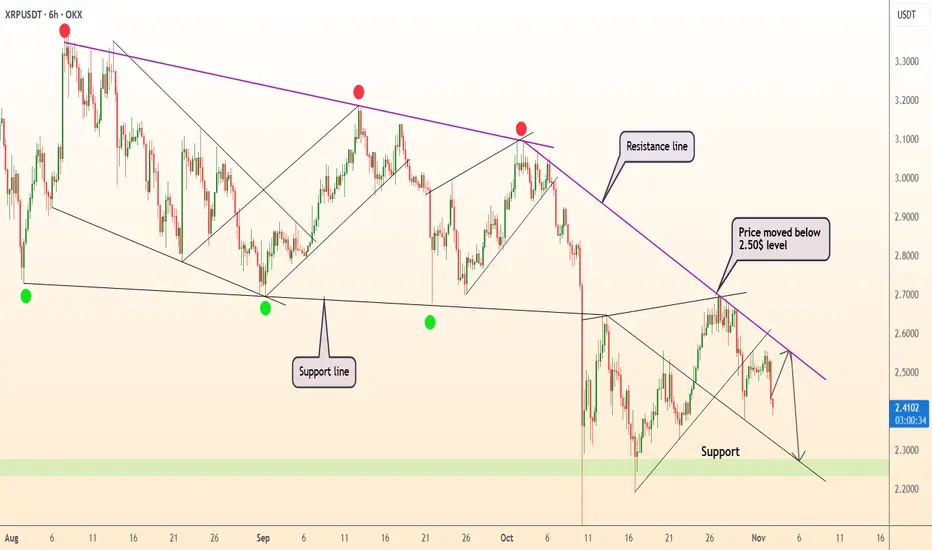
DeGRAM | XRPUSD moved below the $2.5 level📊 Technical Analysis
● XRP/USD continues to move within a descending structure, consistently rejecting from the resistance line near $2.50. The price broke below this level, confirming renewed selling momentum.
● With repeated failures to hold higher lows, the pair targets the next support zone around $2.30–$2.25, aligning with the broader bearish channel formation.
💡 Fundamental Analysis
● Ripple’s price remains under pressure as market liquidity tightens and investor appetite for altcoins declines amid rising U.S. yields.
✨ Summary
● Short bias below $2.50; targets $2.30–$2.25. Technical rejection and weaker sentiment reinforce bearish continuation.
-------------------
Share your opinion in the comments and support the idea with a like. Thanks for your support!
Ripple on the Verge of a Heavy DropGiven the breakdown of the trend line (green line), the formation of a supply zone (orange zone), and the price pulling back to the supply zone with a reaction at the supply level, our first support area is the blue line zones. This is because, after breaking the trend line, the price tends to oscillate between the trend line and the next level. If the price breaks below the blue level, it will reach the marked areas, indicating that Ripple could potentially drop to around 1.16. BINANCE:XRPUSDT

DeGRAM | XRPUSD seeks to the $2.4 level📊 Technical Analysis
● XRP/USD continues to trade under a major descending resistance trendline, facing repeated rejection near 2.70. Price consolidation beneath this zone signals waning bullish momentum.
● The pattern shows lower highs and potential for a corrective decline toward 2.38 support, aligning with prior reaction lows and structural confluence.
💡 Fundamental Analysis
● Investor caution remains as Ripple awaits further regulatory clarity post-SEC settlement, while broader crypto risk sentiment weakens amid dollar strength.
✨ Summary
● Short bias below 2.70; target 2.38. Failing momentum and macro headwinds reinforce bearish continuation.
-------------------
Share your opinion in the comments and support the idea with a like. Thanks for your support!

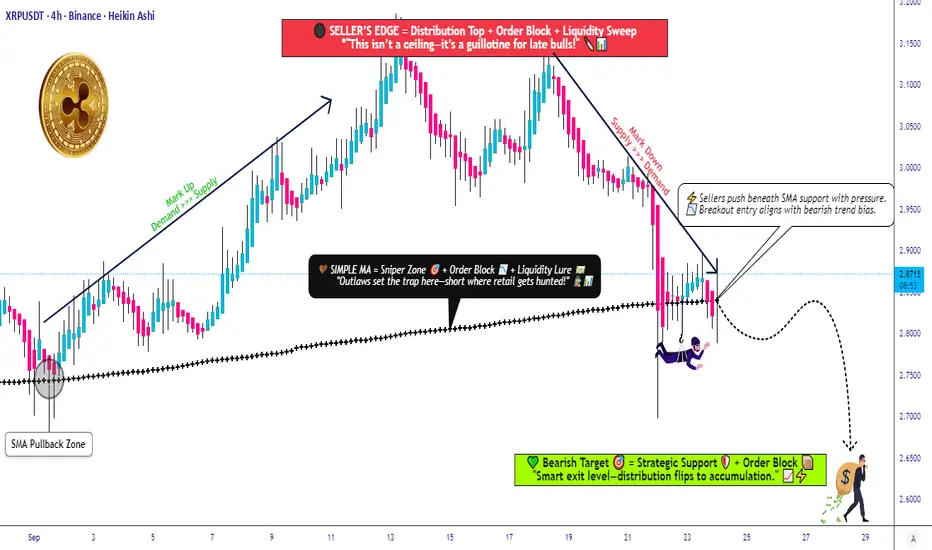
Ripple vs Tether: Key Technical Levels Every Trader Should WatchXRP/USDT | "RIPPLE vs TETHER" Market Wealth Strategy Map (Swing/Day Trade)
📊 Plan:
We’re eyeing a bearish confirmation if candles break below the 0.786 Fibonacci zone + SMA breakout @ 2.8300. At that point, sellers could gain momentum and dominate short positioning.
💡 Thief Strategy Highlight → Using a layered entry style (multiple limit orders). This method allows staggered entries rather than “all-in at once.”
🎯 Layered Short Entries (Sell Limits):
2.9300
2.9000
2.8800
2.8600
(You can expand layers based on your own strategy adjustment.)
🛑 Stop Loss (Thief SL):
Placed near 3.0000 — but ⚠️ please note: Risk management is personal. Thief OG’s — make your own choices. My SL is just an example.
✅ Target (Thief TP):
The “police barricade” (aka strong resistance zone with overbought pressure + possible trap) aligns around 2.6500. That’s where profit-taking may be wise before liquidity hunters catch us.
Again, this is flexible — adjust TP to your own risk/reward plan.
🔗 Related Pairs to Watch
$BTC/USDT → Major market leader, XRP often follows Bitcoin’s momentum.
$ETH/USDT → Correlation with altcoin sentiment; strong ETH moves ripple across XRP.
$ADA/USDT & $SOL/USDT → Competing Layer-1s, often mirror similar retail/institutional flows.
$XLM/USDT → Direct cousin of XRP, highly correlated in macro movements.
Watching these can help confirm broader market bias & correlation flows.
✨ “If you find value in my analysis, a 👍 and 🚀 boost is much appreciated — it helps me share more setups with the community!”
⚠️ Disclaimer: This is a Thief style trading strategy shared just for fun & community engagement. Not financial advice. Manage your own risk, make your own decisions.
#XRP #Ripple #CryptoTrading #SwingTrade #DayTrading #Fibonacci #TechnicalAnalysis #CryptoCommunity #TradingStrategy
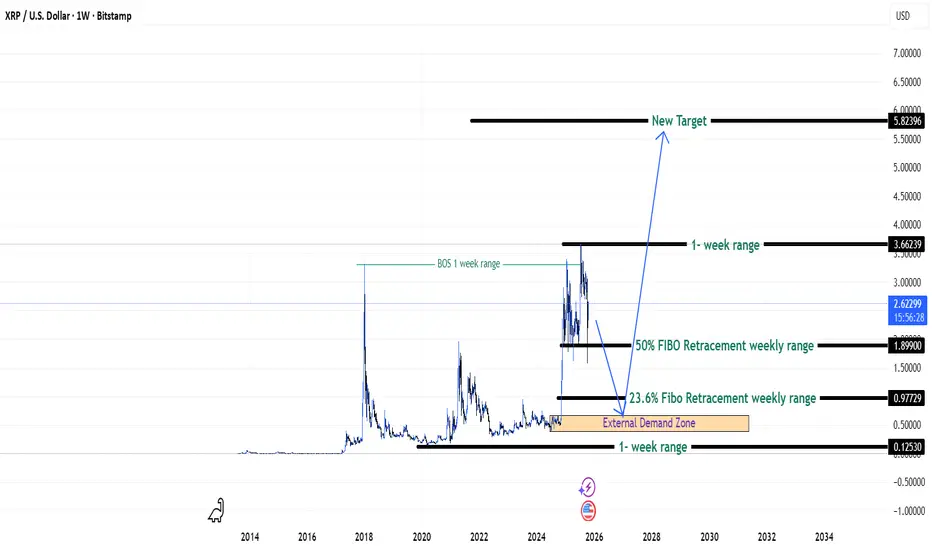
XRP Chasing New Highs - {26/10/2025}Educational Analysis says that XRPUSD or XRPUSDT (Crypto Pair) may give trend Trading opportunities from this range, according to my technical analysis.
Broker - Bitstamp
So, my analysis is based on a top-down approach from weekly to trend range to internal trend range.
So my analysis comprises of two structures: 1) Break of structure on weekly range and 2) Trading Range to fill the remaining fair value gap
Let's see what this Crypto Pair brings to the table for us in the future.
DISCLAIMER:-
This is not an entry signal. THIS IS FOR EDUCATIONAL PURPOSES ONLY.
I HAVE NO CONCERNS WITH YOUR PROFITS OR LOSS,
Happy Trading,
FX Pairs & Crypto Curreny Trade Analysis.
My Analysis is:-
Short term trend may be go to the external demand zone.
Long term trend breaks the new high after going from discount zone.
Ripple vs Tether — Can Bulls Escape the Resistance Trap?📌 TradingView Idea Description (XRP/USDT Thief Strategy)
Asset: XRP/USDT — “Ripple vs Tether”
Market: Crypto Wealth Strategy Map (Swing/Day Trade)
Bias: 🔵 Bullish Setup
🗺️ Trading Plan
Entry Style (Thief Layer Strategy):
Multiple buy-limit layered entries →
✅ 2.8000
✅ 2.8500
✅ 2.9000
✅ 2.9500
(Layers can be increased based on your own risk tolerance)
Stop Loss (Thief SL):
@ 2.7000 (personal setup — adjust as per your own risk appetite)
Target Zones:
🎯 Primary Target: 3.1500 → Key resistance zone + overbought condition + potential bull trap (take profits smartly).
🎯 Secondary Target: 3.3500 → Strong resistance cluster (“police barricade” zone) + overbought trap risk (partial/exit profits advised).
⚠️ Important Notes
👥 Dear Ladies & Gentlemen (Thief OGs):
I’m not recommending my exact stop loss or target — these are my personal levels.
Manage your own risk responsibly: “Make money, then take money at your own risk.”
This strategy is built around layered entries for flexibility in volatile markets.
🔍 Correlation & Related Pairs to Watch
Ripple (XRP) often shows sentiment correlation with broader altcoin momentum and BTC’s dominance. Key pairs worth monitoring for confirmation:
BINANCE:BTCUSDT → Bitcoin drives overall crypto market liquidity.
BINANCE:ETHUSDT → Strong ETH moves can influence Ripple flows.
BINANCE:XLMUSDT → Stellar often mirrors or diverges from XRP due to similarity in use cases.
BINANCE:ADAUSDT → Watch ADA for altcoin sentiment correlation.
Monitoring these pairs can give early signals of potential XRP strength or weakness.
✨ If you find value in my analysis, a 👍 and 🚀 boost is much appreciated — it helps me share more setups with the community!
📜 Disclaimer
This is a “Thief Style” Trading Strategy, shared for educational & entertainment purposes only.
Not financial advice. Trade responsibly — risk management is your best weapon.
#XRP #Ripple #Crypto #Altcoins #USDT #TradingStrategy #SwingTrade #DayTrade #LayeredEntries #ThiefStrategy

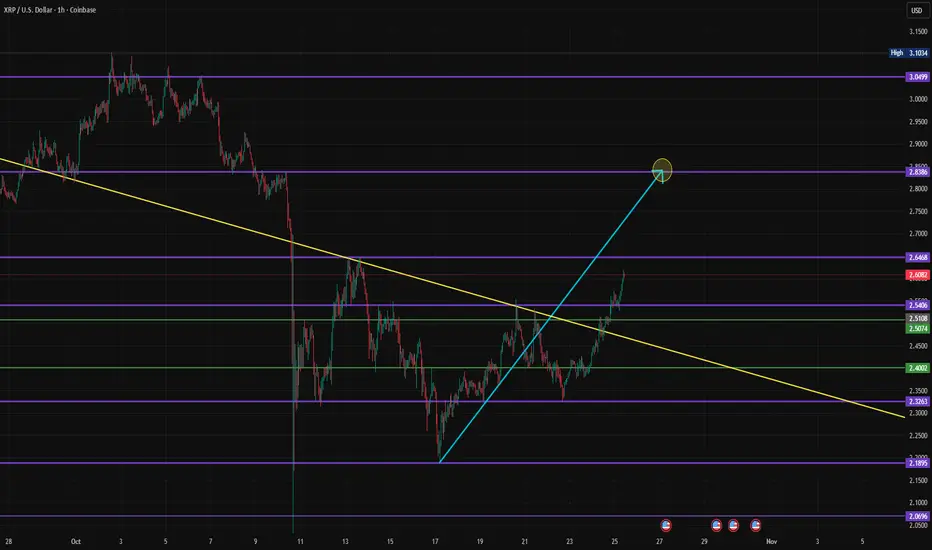
$XRPUSD - #Ripple- $2.80 RetestBITSTAMP:XRPUSD is about to break the next level of resistance - $2.54 - and has since continued its push on to $2.64 with a $2.80 Retest before we see resistance kicking in again.
More to see! @MyMIWallet
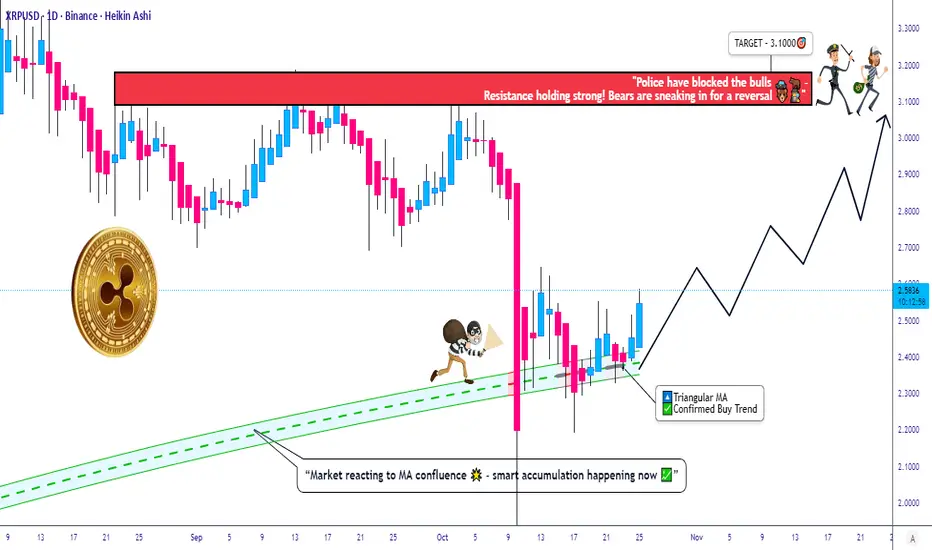
Is XRP Building for a Major Move? | Capital Flow Analysis🎯 XRP/USD: The Great Heist Setup | Swing Trade Blueprint 💰
📊 ASSET OVERVIEW
Pair: XRP/USD (Ripple vs. U.S. Dollar)
Market: Cryptocurrency
Trade Type: Swing Trade (Bullish Accumulation Play)
Chart Style: Capital Flow Blueprint with Triangular Moving Average Confirmation
🎭 THE HEIST PLAN
Ladies & Gentlemen, welcome to the ultimate Thief's Playbook! 🕵️
We've spotted a bullish accumulation pattern confirmed by our trusty Triangular Moving Average showing strong pullback support. The vault door is creaking open, and it's time to execute the perfect heist! 💎
Market Structure: XRP has been consolidating beautifully, building up energy like a coiled spring. The triangular MA convergence suggests institutional accumulation is underway. Translation? The big players are loading their bags while retail panics. Classic.
🎯 ENTRY STRATEGY: THE LAYERED HEIST
Here's where the "Thief Strategy" comes into play—we're not going all-in at once like amateurs. We're professionals. We layer our entries like a mastermind planning multiple escape routes! 🎪
Entry Method: Multiple Buy Limit Orders (Layering Strategy)
Recommended Entry Layers:
🎯 Layer 1: $2.3000 (First probe)
🎯 Layer 2: $2.4000 (Main accumulation zone)
🎯 Layer 3: $2.5000 (Final entry before liftoff)
Note: You can add more layers based on your bag size and risk appetite. The beauty of this strategy is flexibility—if price dips, you average down; if it rips, you're already in! Feel free to adjust these levels to suit your own master plan.
🛡️ STOP LOSS: THE EMERGENCY EXIT
Thief's SL: $2.2000
Listen up, OG Thieves! 👑 This is my stop loss based on technical invalidation below the accumulation zone. However, I'm NOT your financial advisor (I'm just a dude with charts and dreams). You set your own risk management. If you want to be more conservative or aggressive, that's YOUR heist to plan. Remember: scared money don't make money, but reckless money don't KEEP money! 💯
Why $2.2000? Breaking below this level invalidates the bullish structure and triangular MA support. At that point, we abort mission and live to steal another day! 🚪
💰 TAKE PROFIT: THE ESCAPE ROUTE
Primary Target: $3.1000 🚨
Here's the deal: At $3.1000, we hit what I call the "Police Barricade Zone"—a confluence of:
⚠️ Strong historical resistance
⚠️ Overbought conditions on multiple timeframes
⚠️ Potential bull trap territory
Exit Strategy: Scale out as you approach the target. Take some profits along the way! Maybe 33% at $2.8000, another 33% at $2.9500, and let the rest ride to $3.1000 with a trailing stop.
Note to Thief OG's: Again, this is my target based on technical analysis and risk/reward. You're the mastermind of your own operation! If you want to take profits earlier or swing for higher targets, that's your prerogative. Your money, your rules, your risk! 🎲
🔗 RELATED PAIRS TO WATCH (Correlation Analysis)
Keep your eyes on these accomplices—they often move together! 🕵️♂️
1. BITSTAMP:BTCUSD (Bitcoin) 📈
The godfather of crypto. When BTC pumps, altcoins like XRP usually follow. Currently hovering around all-time high zones—if BTC consolidates healthily, expect altseason momentum.
2. BITSTAMP:ETHUSD (Ethereum) ⚡
The second-in-command. ETH's strength or weakness often dictates altcoin sentiment. Watch the $2,500-$2,700 zone for continuation signals.
3. BINANCE:XRPBTC (XRP vs. Bitcoin Pair) 🔄
This tells us if XRP is outperforming or underperforming BTC. Currently showing relative strength—a bullish sign for XRP/USD longs.
4. TVC:DXY (U.S. Dollar Index) 💵
Inverse correlation alert! When DXY weakens, crypto typically strengthens. Keep an eye on the 104-106 resistance zone on DXY.
Key Correlation Point: If BTC holds structure and DXY rolls over, XRP could see explosive upside as capital rotates into high-beta altcoins. The macro backdrop matters! 🌍
🧠 KEY TECHNICAL HIGHLIGHTS
✅ Triangular MA Convergence: Bullish alignment across multiple timeframes
✅ Accumulation Zone: Smart money quietly loading between $2.30-$2.50
✅ Volume Profile: Strong support cluster in our entry zone
✅ Market Structure: Higher lows forming—textbook bullish continuation
✅ Risk/Reward: Approximately 3:1 RR ratio (solid!)
🎬 FINAL WORDS
The setup is clean, the plan is laid out, and the vault is waiting. Will XRP execute the perfect heist to $3.10? Only time will tell! Remember: patience beats panic, and risk management beats revenge trading!
Stay sharp, stay disciplined, and may the charts be ever in your favor! 🎰
✨ If you find value in my analysis, a 👍 and 🚀 boost is much appreciated — it helps me share more setups with the community!
#XRP #XRPUSD #Ripple #CryptoTrading #SwingTrade #TechnicalAnalysis #CryptoSetup #Altcoins #BullishSetup #ThiefStrategy #LayeredEntry #RiskManagement #CryptoSignals #TradingView #ChartAnalysis #XRPArmy #CryptoTA #SwingTrading #PriceAction #SupportAndResistance
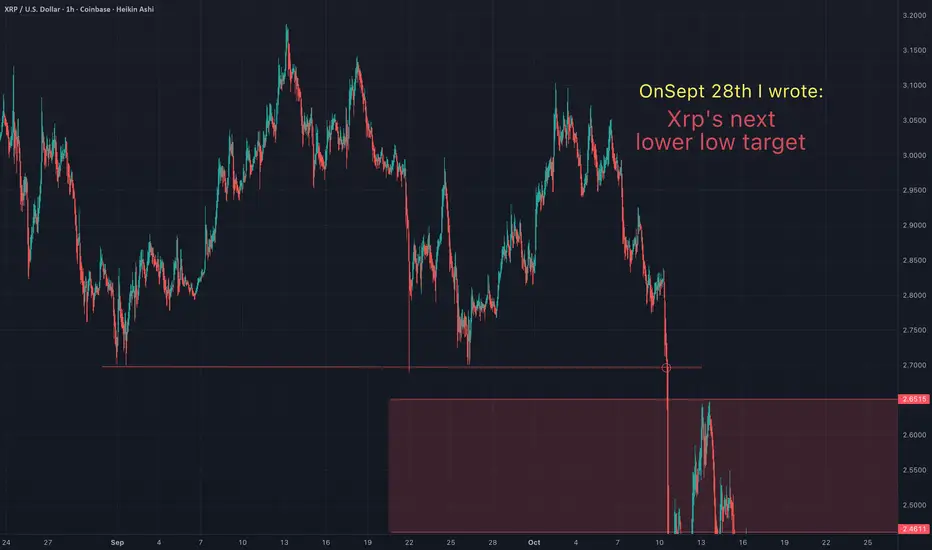
You will ask yourself "how did he know Xrp would do that"?On Sept 28th I suggested that Xrp was headed for a lower low. Congrats to all of you that took that trade and are in profit. The "3 Red Week Down Rule" played out as anticipated. TA works!
May the trends be with you.
You will ask yourself, "how did he know Xrp would do that"?On Sept 5th I wrote, "Based on my statistical analysis of the "3 week down rule", I anticipate Xrp retracing from one of these 3 targets to form a lower low". Congrats to all who rode the gains up to the 3rd target and shorted the top. Also, as expected, Xrp got the lower low for all the doubters of the "3 Red Week Down Rule".

DeGRAM | XRPUSD protected the support line📊 Technical Analysis
● XRP/USD defended the 2.35 support zone after a false breakdown, forming a base along dynamic support. The price structure suggests consolidation within a minor channel, preparing for a potential rebound.
● A break above 2.65 would confirm bullish continuation toward 2.85–3.00, aligning with the dynamic resistance zone.
💡 Fundamental Analysis
● Ripple sentiment improves as market optimism returns following SEC-related clarity and rising transaction volumes.
✨ Summary
● Long bias above 2.35; targets 2.85–3.00. Technical base formation and renewed market confidence support medium-term recovery.
-------------------
Share your opinion in the comments and support the idea with a like. Thanks for your support!

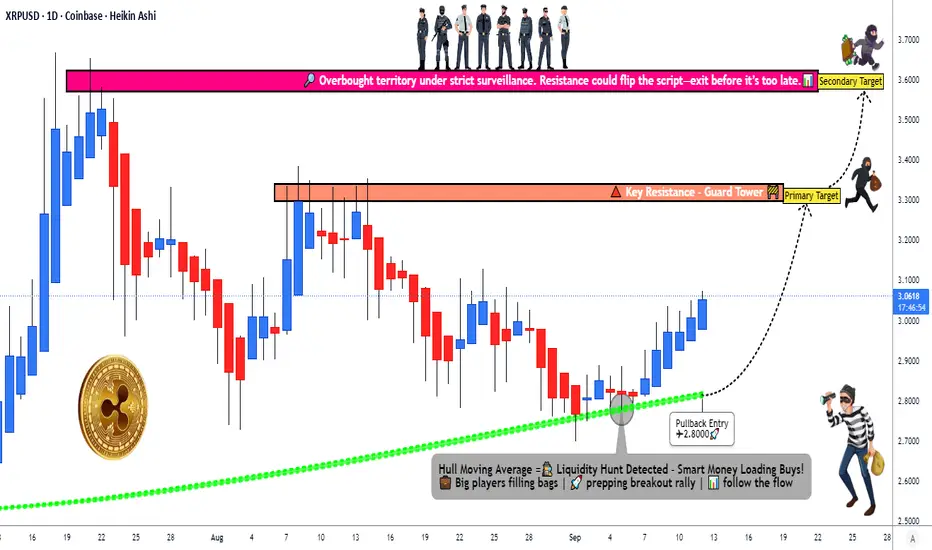
XRP/USD Analysis | Smart Entry, Risk, and Exit Plan🚨 XRP/USD: The Great Crypto Heist Plan (Swing/Day Trade) 🤑💰
Asset: XRP/USD (Ripple vs. U.S. Dollar)
Vibe: Bullish Bandit Mode
😎Plan: Steal the profits with a slick swing/day trade setup using the Thief Layering Strategy! The Hull Moving Average (HMA) is flashing green 📈, signaling a buy trend, and institutional players are sneaking in. Time to execute the heist! 🕵️♂️
📜 The Heist Plan: Key Details
🎯 Entry (The Sneaky Break-In):Deploy the Thief Layering Strategy with multiple buy limit orders to maximize your loot:
🪜 Layer 1: $2.9000
🪜 Layer 2: $2.9500
🪜 Layer 3: $3.0000
🪜 Layer 4: $3.0500
Pro Tip: Stack more layers based on your risk appetite and market conditions. Be the slickest thief in the crypto game! 😏
🛑 Stop Loss (The Getaway Car):Set your escape plan at $2.8000 after the breakout confirms. Dear Ladies & Gentlemen (Thief OGs), tweak your SL based on your strategy and risk tolerance. This is your heist, so protect your loot! 🚗💨
Note: I’m not your financial consigliere—set your SL wisely to avoid getting caught! ⚠️
🎉 Targets (The Big Score):Watch out for the police barricade (resistance + overbought zones + traps)! 🕴️
💰 Primary Target: $3.3000 — Grab your profits and slip away.
💎 Secondary Target: $3.6000 — For the bold thieves aiming for the jackpot!
Note: Don’t get greedy, Thief OGs! These are my suggested TPs, but take profits at your own risk and style. 💸
🔍 Related Pairs to Watch 👀
📊 BTC/USD: Bitcoin often leads the crypto market. If BTC pumps, XRP might follow the bullish vibe.
🦄 ETH/USD: Ethereum’s moves can influence altcoins like XRP. Watch for similar bullish signals.
🧩 ADA/USD: Cardano’s price action often correlates with XRP due to similar market dynamics.
Why Watch These?These pairs can act as your lookout crew. If BTC or ETH shows strength, it could boost XRP’s breakout potential. Conversely, if they tank, be ready to pivot your getaway plan! 🚨
🧠 Key Points & Correlations
📈 Hull Moving Average (HMA): The HMA is our trusty lookout, confirming the bullish trend with its smooth, low-lag signals.
💼 Institutional Flow: Big players are entering, adding fuel to XRP’s upward momentum. Follow the smart money!
🌊 Market Correlation: XRP often dances in sync with BTC and ETH. A rising tide in crypto could lift XRP to our targets faster.
⚖️ Risk Management: The Thief Layering Strategy spreads your entries to reduce risk, but always adjust SL/TP based on your own heist style.
🚨 Risk Disclaimer
Dear Thief OGs, this is a high-stakes crypto heist! I’m sharing my setup, but you’re the mastermind of your trades. Set your SL and TP based on your risk tolerance, and never bet the farm. Trade smart, stay sharp, and escape with profits! 😎
✨ “If you find value in my analysis, a 👍 and 🚀 boost is much appreciated — it helps me share more setups with the community!”
#XRPUSD #CryptoTrading #SwingTrading #DayTrading #ThiefStrategy #Bullish