$XRP Gearing for $5 Move The price of CRYPTOCAP:XRP is down 0.21% today however, should the asset break the ceiling of the symmetrical triangle, the $5 resistant seems feasible with investors and VC's migrating to utility tokens positioning for the so-called "Uptober".
Albeit all the bullish thesis, the Open Interest of CRYPTOCAP:XRP on all exchanges is down 2.15% losing roughly $1.3B.
XRPUSDT

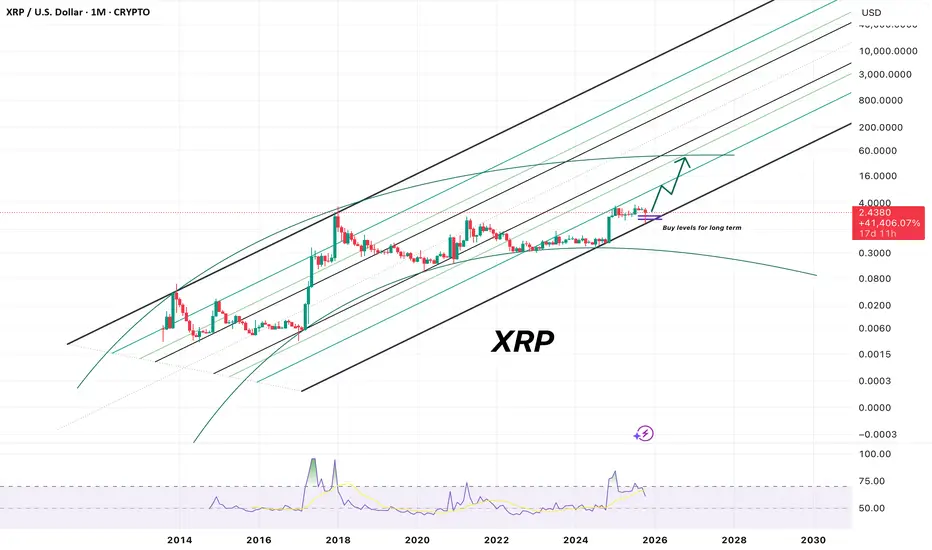
Xrp super cycleBeen a while , things didn’t go as expected for many of the coins and some of mine as well which I will update today , the amount of frustration and hopelessness I see is crazy , people getting off the market with loss specially after recent event of liquidation, waiting took so long and promised Altseason didn’t came as many of us anticipated it for October and late 2024 , this all gives me clue to expect something more , different and exciting.
Looking at dino coins they seems like getting ready to do something extraordinary, something they couldn’t manage to do last cycle and that is going beyond expectations, I see many of them including XRP getting ready for that , I believe we haven’t finished any altseason and in fact we didn’t even start it yet , giving it the momentum it shall start from next month and extend through the next year till late September and October , what I have in mind is that all markets in order to trap your money and keep you inside have to have a cycle including Alts .
So what we witnessed in the last few years should eventually gives us something we can use and be happy for .
I’m gonna add XRP to my bag but please be aware that this is my own personal decision and I won’t be responsible for your losses.
Wish you all the best .
XRP Selling Hits 3 Year High As Whales Dump $5 Billion In 4 DaysAt the time of writing, XRP trades at $2.44, hovering just below the $2.45 support level. If bearish momentum persists and investor confidence weakens further, the altcoin could slide to $2.35 or even $2.27 in the coming days.
This would make recovery increasingly challenging for XRP, which needs to climb back toward $2.85 to reclaim its recent losses. Sustained selling activity, particularly from large holders, could delay this process and push prices lower.
However, if selling pressure eases and investors begin accumulating once again, XRP could rebound. A push above $2.54 and $2.64 could pave the way toward $2.75, signaling renewed market optimism and invalidating the bearish outlook.

#XRP/USDT long idea/classic pattern#XRP
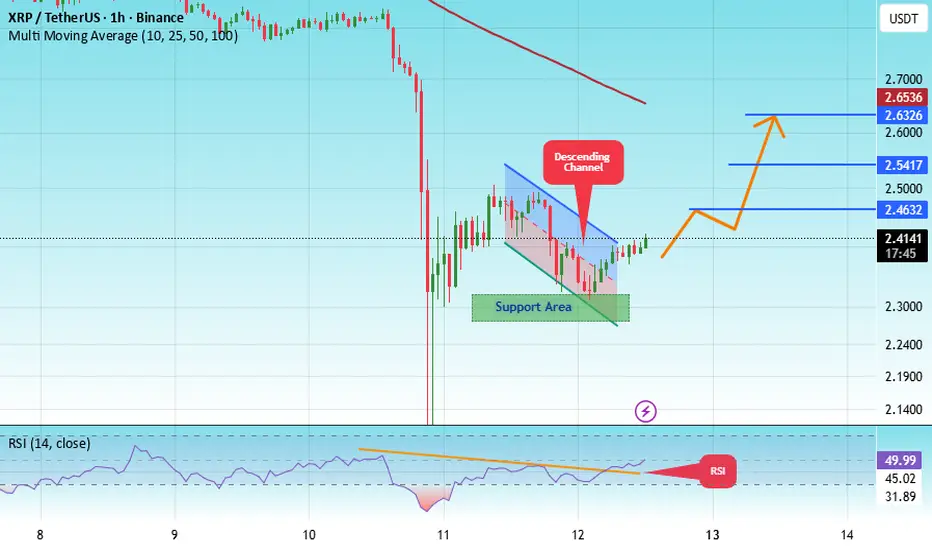
The price is moving within a descending channel on the 1-hour frame, adhering well to it, and is heading for a strong breakout and retest.
We have a bearish trend on the RSI indicator that is about to be broken and retested, which supports the upward breakout.
There is a major support area in green at 2.30, representing a strong support point.
We are heading for consolidation above the 100 moving average.
Entry price: 2.41
First target: 2.46
Second target: 2.54
Third target: 2.63
Don't forget a simple matter: capital management.
When you reach the first target, save some money and then change your stop-loss order to an entry order.
For inquiries, please leave a comment.
Thank you.
Beyond the Chart - XRP AltCoin Market AnalysisBINANCE:XRPUSDT
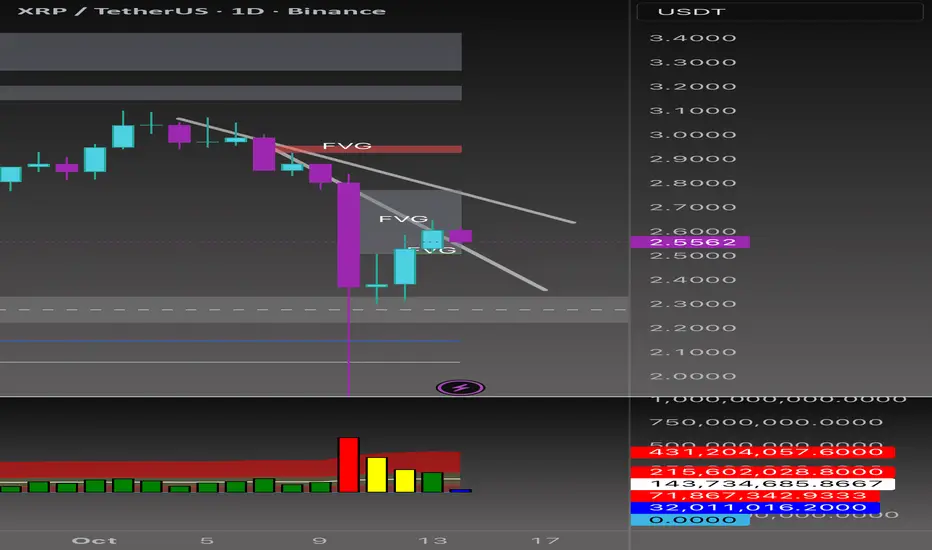
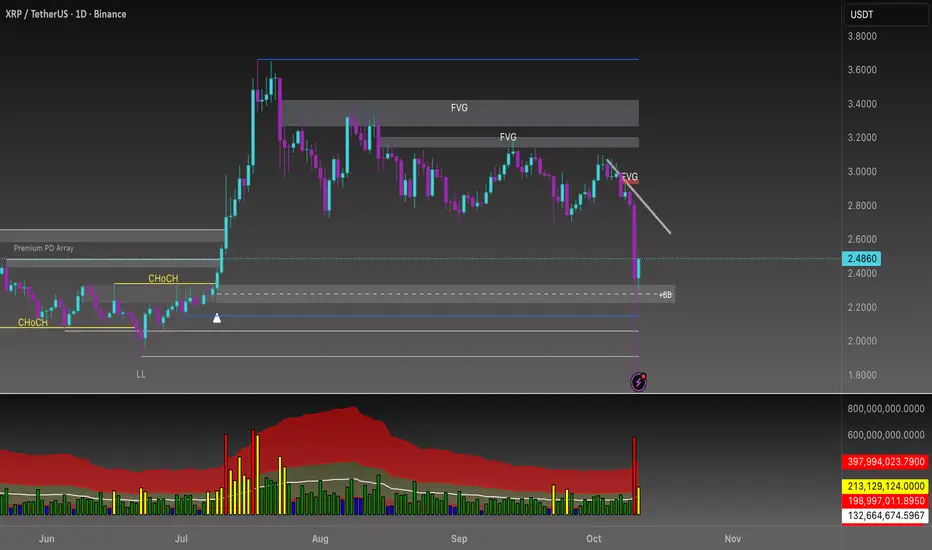
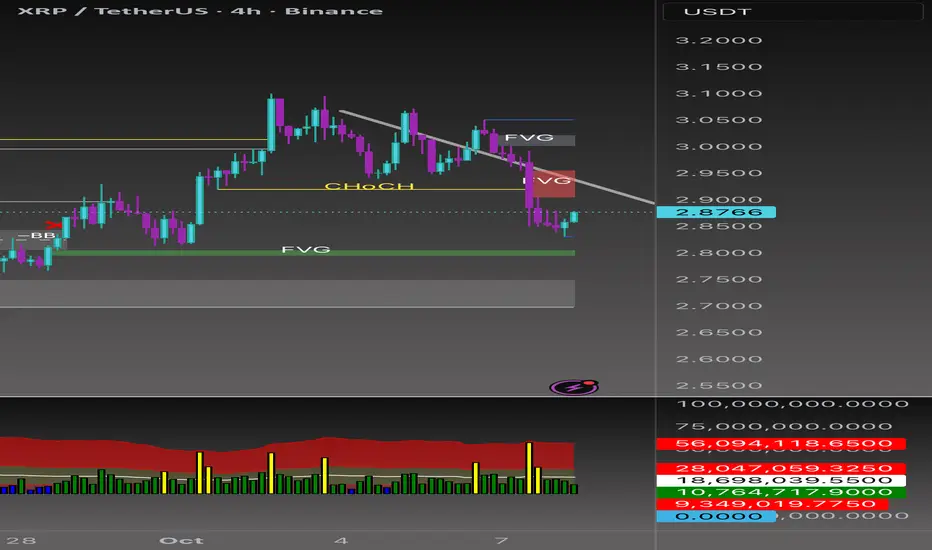
Perfect reaction to my Oct 11 plan price bounced from the 2.290 Breaker Block and rallied into the FVG + trendline confluence. 🎯
Volume shows heavy sell-side liquidation but strong absorption after bulls now need a daily close above 2.72–2.73 to aim for the 3.0–3.2 zone.
If price closes below 2.29, expect a deeper drop toward 2.10–1.90.
High volatility today trade light or wait for daily confirmation. ⚡📈
Next volatility period: Around October 23rd (October 22nd-24th)
Hello, traders!
By "Following," you can always get the latest information quickly.
Have a nice day today.
-------------------------------------
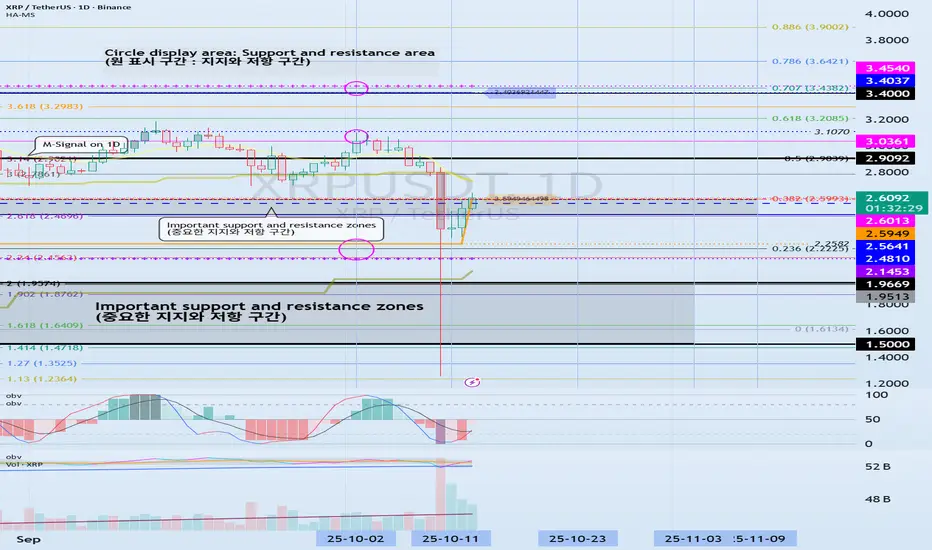
(XRPUSDT 1D Chart)
After this period of volatility, the HA-Low indicator on the 1D chart is forming at the 2.5949 level.
Therefore, if the HA-Low indicator forms at the 2.5949 level, it will be important to determine whether support is found near that level.
Furthermore, the HA-High indicator on the 1M chart is forming at the 2.4810 level.
Therefore, the key question is whether the price can find support and rise near the important support and resistance levels of the left Fibonacci ratio (2.618 (2.4696)) and the right Fibonacci ratio (0.382 (2.5993)).
However, to continue the step-up trend, the price must rise above 3.4037-3.4540 and hold, so you should also consider a countermeasure.
-
The basic trading strategy is to buy in the DOM(-60) ~ HA-Low range and sell in the HA-High ~ DOM(60) range.
However, if the price rises in the HA-High ~ DOM(60) range, a step-up trend is likely, while if the price falls in the DOM(-60) ~ HA-Low range, a step-down trend is likely.
Therefore, the basic trading strategy should be a segmented trading strategy.
Currently, the HA-Low indicator is showing signs of forming, so if support is confirmed near the HA-Low indicator, it would be a good time to buy.
From a medium- to long-term perspective, if the price holds above the 1.5-1.9669 range, the upward trend is likely to continue.
-
Thank you for reading to the end. I wish you successful trading.
--------------------------------------------------
XRP 1D Analysis - Key Triggers Ahead☃️ Welcome to the cryptos winter , I hope you’ve started your day well.
⏰ We’re analyzing XRP on the 1-Day timeframe .
👀 On the daily timeframe of Ripple (XRP), we can see that — for this analysis — I decided to share my perspective from left to right across the chart.
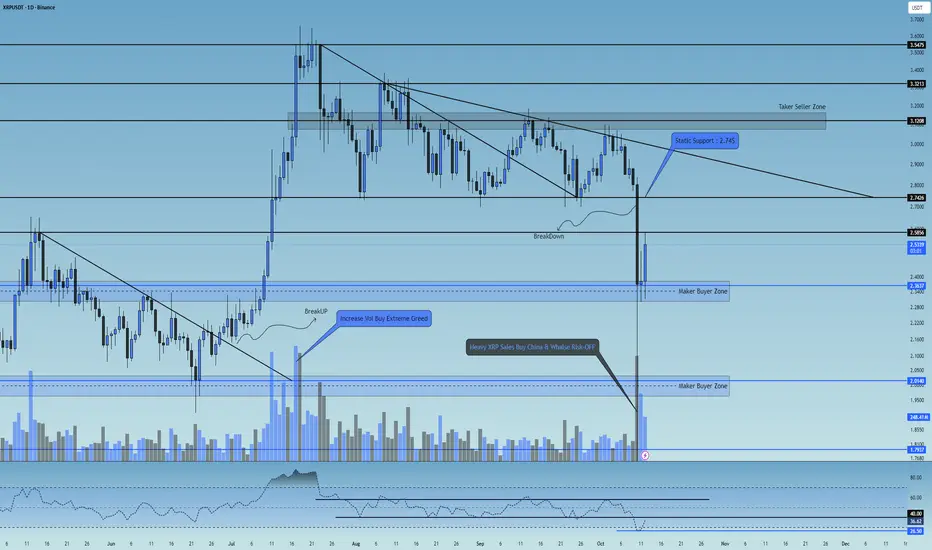
From mid-May to late June, Ripple was trading below a descending dynamic resistance trendline, which it successfully broke to the upside, rallying from $2 to $3.5. In that area, heavy profit-taking occurred, pushing the price downward. The first major support after that sharp rally was at $2.74.
Later, Ripple formed a lower high at $3.23 and a double bottom (equal low) around $2.74, which created a strong static support and positioned the price within the final third of its triangle pattern. It then broke its dynamic trendline resistance again and managed to make a higher high, but this time it failed to show the same sharp bullish momentum. It was quickly rejected from $3.1, which was a taker-seller zone, and pulled back toward its static support.
Buyers didn’t allow the key floor to break — they defended the level aggressively, pouring in additional liquidity to keep XRP above support. However, since no major new capital inflow entered the market and Ripple remained compressed within multiple overlapping triangle formations, a new dynamic resistance was formed. Even with intense effort from buyers, that resistance couldn’t be broken, and eventually, Ripple lost its key static support at $2.74 and dropped further.
Although this move was technically predictable, the speed and depth of the fall were hard to manage in real time. Now, Ripple is sitting above a strong buyer-maker support zone, and much of the selling volume is being absorbed by buybacks. Retail traders are also accumulating again.
The interesting point: Ripple has a critical resistance at $2.58 — if it breaks and holds above this level, it can reignite a bullish move upward. The main resistance zone remains the same old static support area that buyers previously tried hard to protect. Once the $2.74 level is broken back to the upside, Ripple could experience a strong pump.
🧮 On the daily RSI oscillator, Ripple had a very strong static resistance zone around 62, and on its last touch it got heavily rejected, dropping below 50 and 30 without much resistance. Currently, RSI has a support around 26.5 and a key resistance around 40 — these are the main RSI pivot levels. If Ripple’s RSI breaks out of this range, it can trigger higher volatility and momentum aligned with the market direction.
🕯 The recent candle structures — especially the large bearish candle with a long lower wick — caused panic and FOMO among Ripple holders. This led many institutions and big wallets to switch into risk-off mode, dumping their XRP positions and causing a 50% crash within hours.
However, Ripple has recovered well, and the last two bullish candles came with solid buying volume, likely supported by the RSI exiting its oversold zone. With continued buying volume and a break above the key taker-seller resistance at $2.58, Ripple could resume its upward movement.
🧠 If we held Ripple — what would we do?
Personally, if I owned XRP right now, I’d strictly follow capital and risk management, avoiding emotional decisions driven by fear or greed. Ripple is currently forming a new trading range with tight highs and lows, meaning that breaking either boundary will likely start the next major leg of movement.
The upcoming week, especially with the meeting between Trump and the Chinese President, could significantly impact risk markets.
So for now, I’d do nothing major — and if I decided to open a position, I’d do it with minimal risk (and yes, I call that “a bad habit” on purpose 🙂).
This scenario will be updated with more precision and detail in future analyses.
❤️ Disclaimer : This analysis is purely based on my personal opinion and I only trade if the stated triggers are activated .
Bearish divergence on the 1WLast time XRP experienced such a bearish divergence at 1W, the price dropped to touch the 100 EMA.
This next drop will take a few weeks, coinciding with the dynamics of the markets and Bitcoin.
It will be a good opportunity to take advantage of the next rally to 3.6 and the subsequent ATH.
Enjoy your journey.

Beyond the Chart - XRP AltCoin Market AnalysisThe trendline I previously drew for BINANCE:XRPUSDT continues to hold strong. 💪
Price has formed a Breaker Block around 2.2900, and I expect a correction toward the trendline 🎯first targeting the 2.7294 area.
XRP’s reaction here will decide the next phase:
• 📈 If a bullish candle closes above the trendline, my next target will be the upper FVG zone.
• 📉 If a bearish candle closes below it, I’ll be watching the 2.3021 area as the next downside target.
XRP back to realityOne of the worst shitcoins of them all, short it, avoid it, whatever you do don't buy at least in a year.
GL

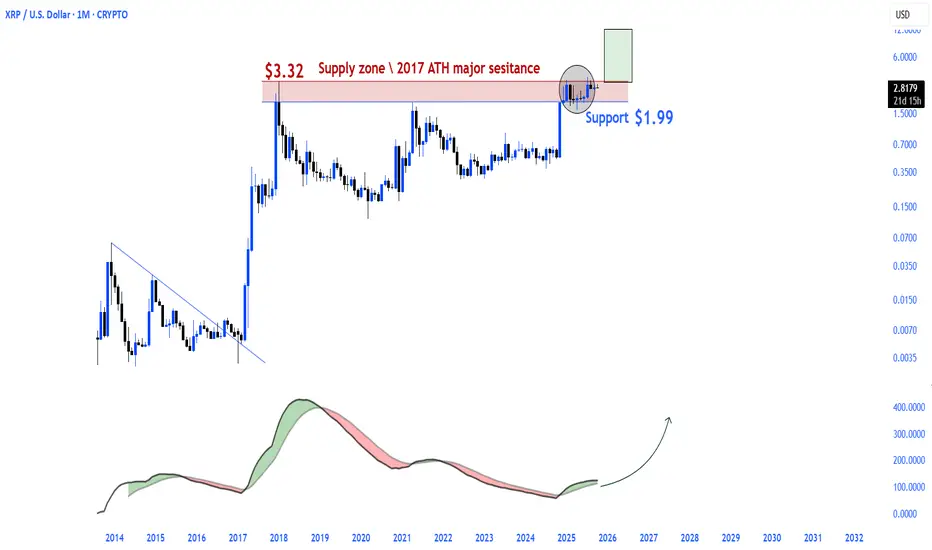
$XRP Explosion After Re-Accumulation.XRP has been strengthening in a horizontal consolidation pattern for quite some time.
The $3.32 region, which was the 2017 peak, was retested on the monthly chart and rejected.
This level was a significant resistance area in the past, but it is now a pivot point that could potentially open the door to a new parabolic rise.
Major support at $1.99, staying above this level confirms the bullish reversal of the structure.
The momentum indicator is in an area where it could move upward.
This table may signal the awakening of a giant that has been silent for a long time.
Emerging from the re-accumulation phase is not always without surprises.
XRP Update📊 CRYPTOCAP:XRP Update
CRYPTOCAP:XRP is testing the red resistance zone 🔴
If it breaks out, the first target will be the green line level 🟢

A Massive Altcoin Explosion Is ComingAltcoins are on the verge of a huge surge, and market moves will be fast.
If you want to catch this opportunity before everyone else, this guide is for you.
The tools and strategies below will help you make smarter trading decisions.
Hello✌️
Spend 2 minutes ⏰ reading this educational material.
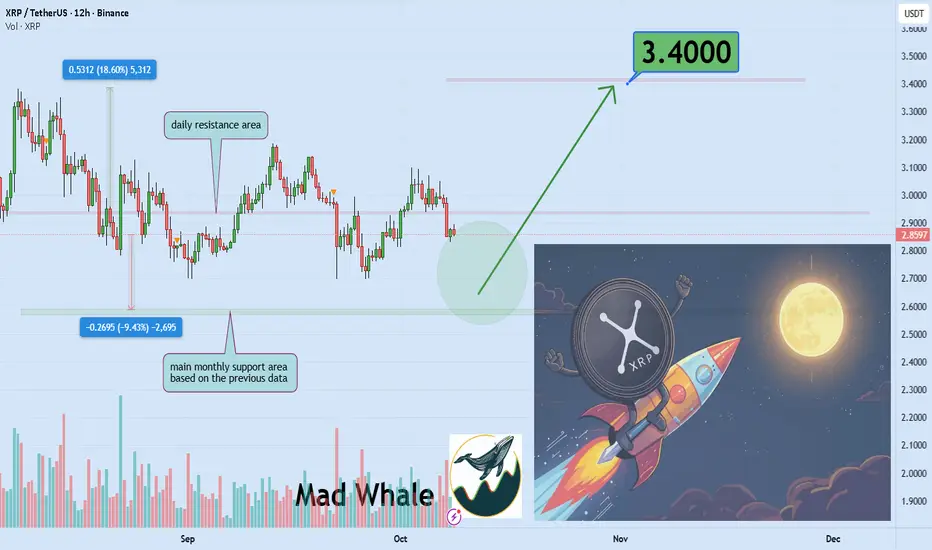
🎯 Analytical Insight on Ripple:
BINANCE:XRPUSDT is approaching a critical monthly support zone, backed by strong market volume. If this level holds, XRP could potentially rally 18% toward the $3.40 target, signaling renewed bullish momentum. 📈🚀
Now , let's dive into the educational section,
🔥 Explosive Altcoin Trends
Altcoin trading volumes have spiked unusually high.
High volumes often signal upcoming explosive moves.
Fear and greed play a central role in rapid price changes.
FOMO drives impulsive buying and fast market waves.
Whale movements can steer the market in their favor.
Short squeezes are ready to trigger in some altcoins.
💹 Market Psychology
Collective trader behavior moves prices unexpectedly.
Spotting areas where most traders are emotionally influenced is key.
Fear leads to panic selling, greed to impulsive buying.
Professional traders use market psychology to anticipate moves.
Understanding this psychology helps prevent major mistakes.
📈 Profitable Opportunities
Strong support zones highlight safe entry points.
Combining technical analysis with indicators improves decision accuracy.
Staggered entries and risk management reduce psychological pressure.
Short-term profit targets increase the chance to capitalize quickly.
Smaller altcoins can also create explosive waves.
Checking potential breakout zones before entry is essential.
🛠 TradingView Tools & Indicators
Volume Profile
Shows where liquidity is concentrated.
Helps identify strong support and resistance areas.
RSI
Highlights overbought and oversold conditions.
Signals the right time to enter or exit trades.
MACD
Indicates main trends and potential reversals.
Combining these three tools makes your analysis professional and reliable.
Even beginners can make better decisions by following these indicators.
Advanced traders can improve precision using multiple timeframes.
📝 Summary
Altcoins are ready to surge, and market psychology is the key.
Using TradingView tools and managing emotions is the best strategy.
Smart entry and risk management prepare you to seize explosive opportunities.
💡Key Trading Recommendations
Check trading volumes and potential breakout zones before entering.
Control your emotions and avoid impulsive decisions.
Use multiple indicators together to anticipate market moves.
🌟 Golden Opportunity to Level Up
Continuous practice with indicators and market psychology prepares you for explosive altcoin waves.
✨ Need a little love!
We pour love into every post your support keeps us inspired! 💛 Don’t be shy, we’d love to hear from you on comments. Big thanks, Mad Whale 🐋
📜Please make sure to do your own research before investing, and review the disclaimer provided at the end of each post
Beyond the Chart - XRP AltCoin Market Analysis 🚀 BINANCE:XRPUSDT XRP/USD AltCoin Market 🚀
XRP stuck between ⚙️ Accumulation ($2.80–$2.85) and 💰 Distribution ($3.00–$3.10) zones.
Descending triangle 🔻 hinting possible breakdown if $2.80 fails — eyes on $2.65 next.
But a clean breakout + hold above $3.05 could flip bias bullish → $3.20–$3.40 🟢
🌐 Macro View:
ETF delays 🏦 + U.S. shutdown ⚠️ keep pressure on alts.
Still, crypto inflows 💸 remain strong — extreme negativity could fuel a contrarian bounce.
🎯 Setups
📈 Long: Breakout + retest above $3.05 → 🎯 $3.20 / $3.40
📉 Short: Breakdown below $2.80 or rejection from $3.05 → 🎯 $2.70 / $2.55
Xrp/Usdt - Bullish Reversal From Support ZoneXRP is currently trading within a well-defined support zone, showing potential signs of a bullish reversal after multiple structure shifts (CHoCH) indicating seller exhaustion. Price tapped into the support area with a rejection wick, suggesting strong buyer interest.
The entry zone is highlighted near the support, aligning with liquidity sweep and a possible accumulation phase. A clean break of internal structure toward the upside would confirm bullish momentum.
As buyers gain control, the market is expected to form a higher-low structure before pushing toward the target zone, potentially reclaiming previous highs. The overall setup favors a buy scenario, with confirmation upon sustained bullish candles above minor resistance.
Key Points:
• Timeframe: 15M
• Zone: Support Rejection / Liquidity Sweep
• Entry: Near support confirmation
• Bias: Bullish Reversal
• Target: Previous strong high level

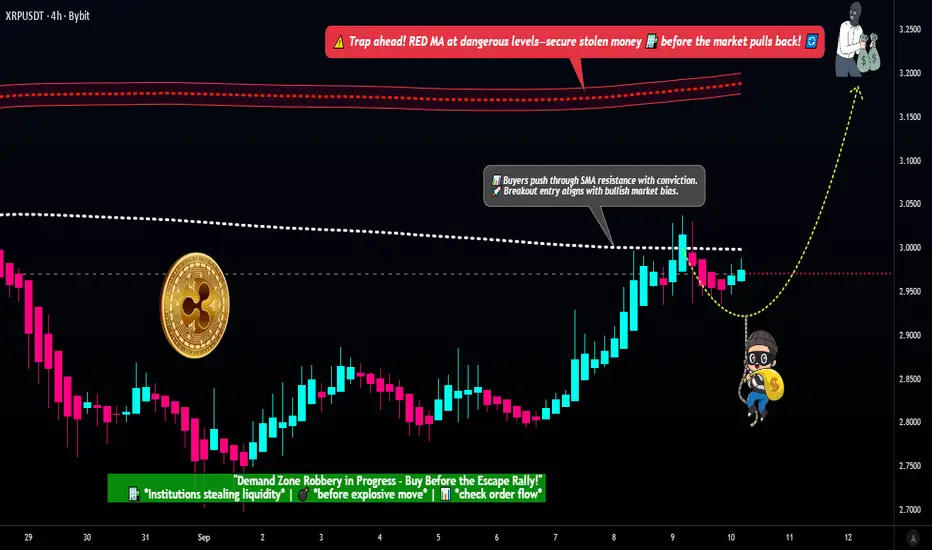
XRP/USDT — Breakout Pending! Will Thief Layers Unlock Profits?🔥 XRP/USDT "RIPPLE VS TETHER" Thief Plan (Swing/Day Trade)
🎯 Trade Setup
Plan: Bullish (Pending Order Plan)
Entry: Breakout at 328 SMA ➝ $3.0000 ⚡
🛎 Set alarm in TradingView to catch the breakout easily.
Thief Strategy = Layered Entries:
$2.9300
$2.9500
$2.9800
$3.0000
(You can increase layers based on your own strategy).
Stop Loss: Thief SL ➝ $2.8800 (after breakout). Adjust SL to your risk preference.
Target (TP): Escape before trap ➝ $3.2000.
Note: Targets & stops are flexible. Risk management is your responsibility.
📊 XRP/USDT Real-Time Data (10 Sept 2025)
Current Price: $2.97
24h Change: -1.11%
Trading Volume: High (4.4B+ XRP traded)
📈 Retail & Institutional Sentiment
Retail Sentiment (Greed 60/100)
Optimism on ETF speculation & rebound momentum.
High social/media buzz fueling greed.
Institutional Sentiment (Neutral–Cautious)
Whales accumulated 340M XRP near $3.20–$3.30 = long-term confidence.
But $1.9B liquidations since July = short-term caution.
😨 Fear & Greed Index
XRP-Specific Score: 60/100 🟢
Volatility: Greed
Volume: Greed
Whale Activity: Extreme Fear (selling pressure)
Order Book: Extreme Greed (buying demand)
Overall Crypto Market: 51/100 (Neutral)
📉 Fundamental & Macro Analysis
Fundamental Score: 7/10
✅ ETF approval speculation (Grayscale/Franklin Templeton).
✅ Ripple expanding RLUSD stablecoin into Africa.
⚠️ Risks: SEC lawsuit uncertainty + Ripple’s centralization issue.
Macro Score: 6/10
Global crypto cap $3.85T (+2.5% weekly), but under 50D avg.
U.S. inflation release = key volatility trigger this week.
🐂 Why This Thief Plan?
Bullish Case (60%)
ETF approval hype (90%+ probability).
Whale accumulation + strong institutional positioning.
Historical September strength (+87% avg. gains).
Bearish Case (40%)
Resistance failure at $3.20.
Whale sell-offs + profit taking.
Crypto-wide sentiment still neutral.
💎 Key Takeaways
High volatility expected around ETF & macro news.
Short-term breakout = fast profit chance with thief layering.
Long-term = bullish bias if ETF approvals confirmed.
👀 Related Pairs to Watch
$BTC/USD (Overall market direction)
$ETH/USD (Altcoin leader)
$SOL/USD (Key altcoin sentiment)
✨ “If you find value in my analysis, a 👍 and 🚀 boost is much appreciated — it helps me share more setups with the community!”
#XRP #Ripple #Crypto #CryptoTrading #USDT #Bitcoin #Ethereum #ThiefTrading #SwingTrade #DayTrading #Breakout #TradingView
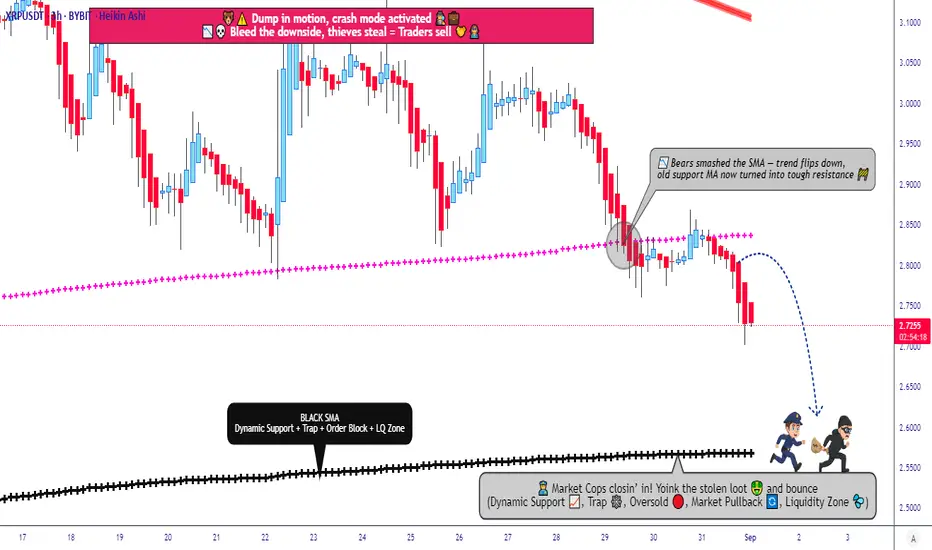
XRP/USDT Market Report + Strategic Entry Levels🚀 XRP/USDT Market Report & Layered Trading Plan (Day/Scalping Trade) 📊
Current Price Snapshot 💰
XRP/USDT is trading at $2.81, down slightly 0.04% over the last 24 hours amid broader market consolidation. Daily volume is strong at over $3B, showing steady interest. Market cap sits around $167B, ranking XRP in the top 4 cryptocurrencies. Support has held near $2.80 over the past week, with potential for a rebound if key levels break.
📈 Trading Plan: Bearish (Layered Strategy)
Entry : Any price level; use multiple limit orders (layering strategy) for controlled exposure. Example layers: 2.7500 | 2.7700 | 2.8000 | 2.8200. Adjust layers based on your own risk/reward preference.
Stop Loss 🛑: Suggested 2.8800. Adjust according to your personal strategy.
Target 🎯: 2.5700. Use smart exits and scale out of positions based on market momentum.
✅ Layered entries help reduce risk while maximizing opportunity. Ideal for scalping/day trades.
😊 Investor Mood & Sentiment
Overall Bullishness: 65%
Retail Traders: 70% bullish – excitement over payments utility, ETF expectations, partnerships.
Institutional Traders: 55% bullish – whale accumulation + cautious optimism, with some profit-taking.
Fear & Greed Index ⚖️: 48 (Neutral) – market steady, volatility at 4.27%. Consolidation phase ideal for strategic positioning.
🏗️ Fundamental Score: 85/100
Strengths: High adoption (300+ partners, $1.3T yearly transactions), fast XRPL settlements (3-5s), low fees, escrowed supply cap, burned fees reduce circulating supply.
Weaknesses: Competition from stablecoins like USDC could cap growth if banks shift focus.
🌍 Macro Score: 75/100
Bullish Drivers: Fed rate cuts, crypto-friendly policies, ETF approvals likely.
Challenges: Trade tensions, inflation, emerging market pressures.
Net positive: adoption in Asia/Africa outweighs headwinds for now.
🔮 Overall Market Outlook
Bullish (60% probability) 🟢 – potential to test $3.35 resistance, with $4 possible if ETF news hits.
Key Watch: Break above $3.00 confirms strength. Buy dips near $2.72 support for upside.
🗂 Related Pairs to Monitor
ETH/USDT | BTC/USDT | LTC/USDT | ADA/USDT
#XRPUSDT #Ripple #CryptoTrading #Scalping #DayTrade #LayeredStrategy #CryptoAnalysis #MarketReport #CryptoSentiment
#XRP/USDT looking extremely bullish#XRP
The price is moving within a descending channel on the 1-hour frame, adhering well to it, and is heading for a strong breakout and retest.
We have a bearish trend on the RSI indicator that is about to be broken and retested, which supports the upward breakout.
There is a major support area in green at 2.93, representing a strong support point.
We are heading for consolidation above the 100 moving average.
Entry price: 2.96
First target: 3.02
Second target: 3.06
Third target: 3.10
Don't forget a simple matter: capital management.
When you reach the first target, save some money and then change your stop-loss order to an entry order.
For inquiries, please leave a comment.
Thank you.

XRP 1H Analysis - Key Triggers Ahead☃️ Welcome to the cryptos winter , I hope you’ve started your day well.
⏰ We’re analyzing XRP on the 1-Hour timeframe .
👀 On the 1-hour timeframe, XRP recently completed a solid bullish rally, reaching resistance around $3.06, before retracing toward its local support zone near $2.94. The coin has tested its top level about three times, getting rejected each time under selling pressure. After the latest rejection and rebound from the $2.94 zone, a short-term trigger has formed around $2.98 — a breakout above this level could significantly increase the likelihood of a resistance breakout.
🧮 The RSI oscillator shows that after ranging below the 50 zone, it has now crossed above it and is heading upward. A 1-hour candle close above the trigger zone would confirm bullish momentum; otherwise, the move risks failing.
🕯 The recent candle structure on the 1-hour chart has been relatively range-bound, partly due to low market activity during holidays. However, with increasing volume and the larger size of recent bullish candles, there’s potential for stronger upward continuation.
🧠 For XRP positions, traders can consider low-risk entries once a candle closes above the marked trigger zone in this analysis. Rising volume and strong candle closures may fuel volatility and expand long opportunities.
❤️ Disclaimer : This analysis is purely based on my personal opinion and I only trade if the stated triggers are activated .

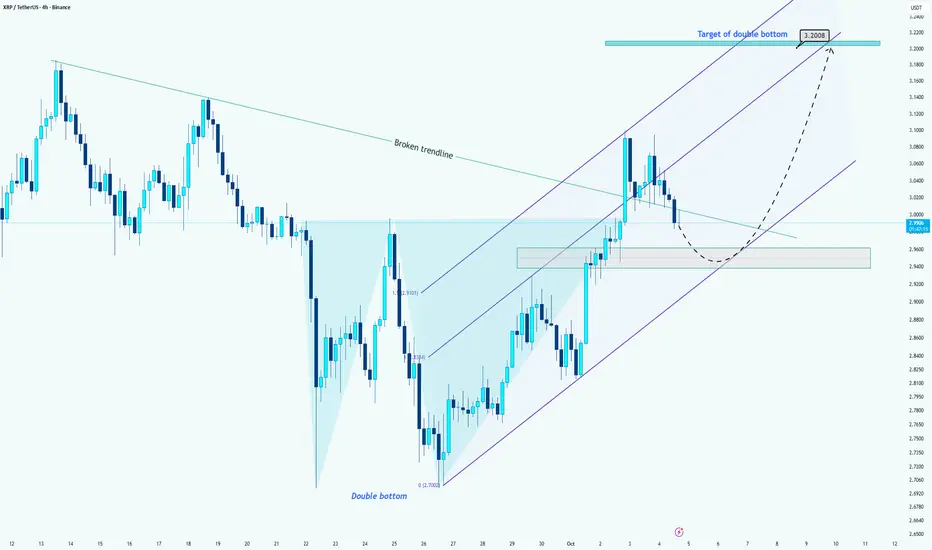
XRP/USDT –> Double Bottom Formation Confirmed!Hi guys!
After breaking above the descending trendline, XRP has confirmed a double bottom pattern around the 2.70 area.
Currently, the price is moving inside an ascending channel, but after facing resistance near 3.10, it has entered a correction phase. The 2.94–2.96 area now acts as a key support zone, aligning with both the previous neckline and the channel’s midline.
If this support holds, we can expect the price to bounce upward and resume its bullish momentum toward the 3.20 area, which represents the target of the double bottom.
However, if the 2.94 support breaks down, we might see a deeper correction toward the lower channel boundary before any continuation move.
🎯 Targets:
First target: 3.20 USDT (double bottom projection)
Extended target: 3.30 USDT (upper channel resistance)
Price Poised for Bullish Flag Surge!$XRP/USDT chart shows an accumulation phase from April to June, followed by a breakout in July. Price is now testing a key zone, acting as support. If it holds, we could see more bullish momentum, especially with the triangle breakout. A break above 3.20 signals further upside.
If not, a retest of lower levels like the accumulation zone is possible. Watch for confirmation at this level.
DYOR, NFA

XRP Price Action – Accumulation Before GrowthXRP is currently navigating a phase defined by liquidity-driven swings and rapid sentiment shifts. After the market endured a heavy decline, buyers have re-emerged, showing resilience through aggressive rebounds. This behavior reflects a deeper pattern: sellers are losing efficiency in driving the market lower, while buyers are treating each dip as an opportunity to accumulate.
In the short term, the market appears to be balancing between two forces — the need for a corrective retracement to secure liquidity, and the desire of participants to push price into higher zones. This tug-of-war often results in shallow pullbacks, where temporary declines are quickly absorbed. Such behavior highlights that speculative capital is rotating back into XRP, aligning with broader risk-on sentiment across digital assets.
If this pattern holds, the near-term trajectory favors gradual expansion, with the asset likely aiming for higher valuations. However, investors should remain aware that short-term corrections are less about trend reversals and more about the mechanics of liquidity collection.

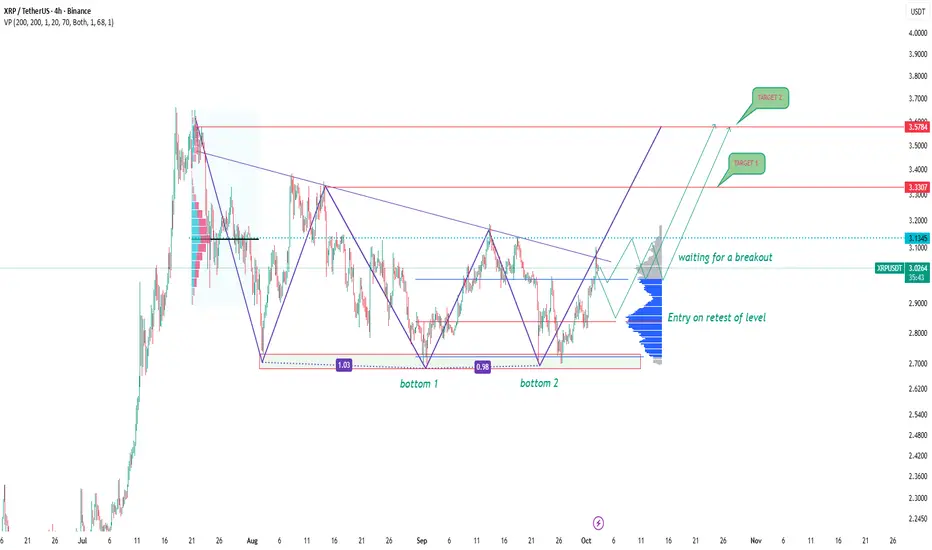
XRPUSDT: double bottom and waiting for a breakoutOn the 4H chart, XRPUSDT is shaping a double bottom around the 1.00 level, and the price is now approaching the key resistance area at 3.14–3.32. A breakout above this zone would be a strong confirmation that the bearish phase is losing momentum.
Technically, the scenario suggests a breakout above 3.14, followed by a retest, and then continuation toward 3.32 and 3.57. This fits the classic pattern where accumulation turns into momentum-driven buying.
From a fundamental perspective, XRP still draws attention thanks to Ripple’s legal battle with the SEC and the use of the token in cross-border transactions. Positive headlines can accelerate the rally, though broader crypto market corrections or regulatory pressure could put the brakes on growth.
This is exactly the kind of setup where expectations and reality may diverge. The structure looks bullish, but without a confirmed breakout, the market can easily roll back. Better to wait for confirmation and trade with discipline.