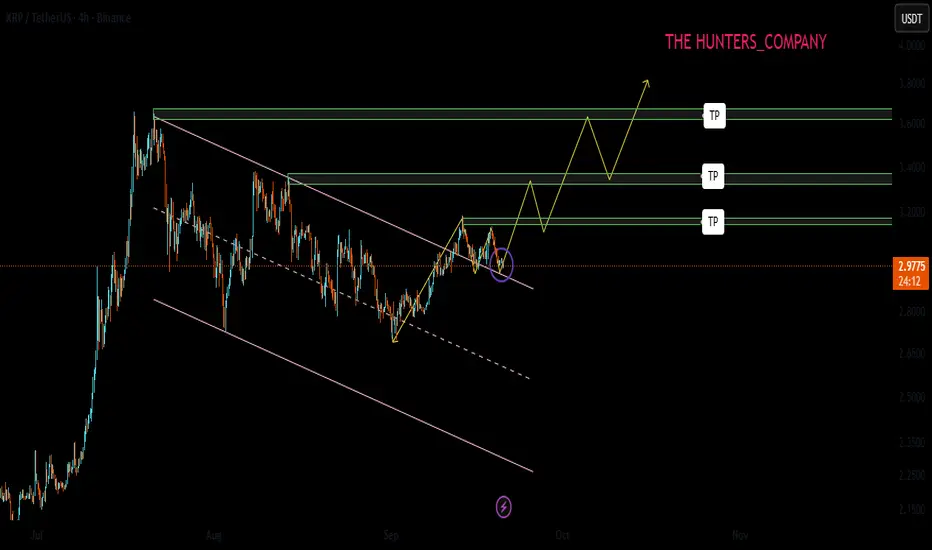
XRP on the moon!As you can see, the chart's trendline has been broken, as indicated by the shown take profits (TPs).
XRPUSDT

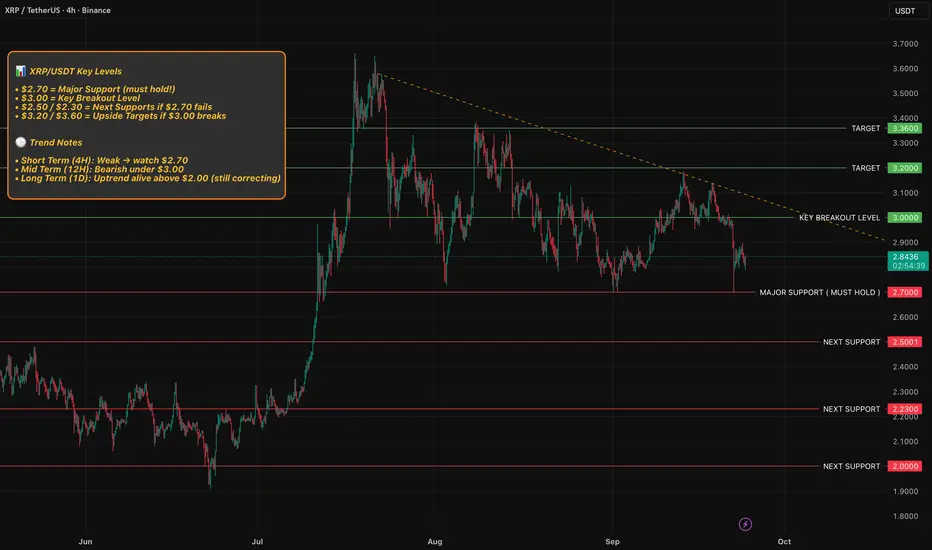
XRP is at a MAJOR decision point !
📊 XRP/USDT Key Levels
• $2.70 = Major Support (must hold!)
• $3.00 = Key Breakout Level
• $2.50 / $2.30 = Next Supports if $2.70 fails
• $3.20 / $3.60 = Upside Targets if $3.00 breaks
🕒 Trend Notes
• Short Term (4H): Weak → watch $2.70
• Mid Term (12H): Bearish under $3.00
• Long Term (1D): Uptrend alive above $2.00 (still correcting)
Thank you for reading my idea, let me know your thoughts and please support by leaving a simple comment as this helps me stay motivated and keep going.
TradeCity Pro | XRP: Key Support and Resistance Zones Testing👋 Welcome to TradeCity Pro!
In this analysis, I will review the XRP coin. One of the oldest crypto projects, XRP aims to align crypto transactions with the SWIFT system. The coin has a market cap of $173 billion and is ranked 4th on CoinMarketCap.
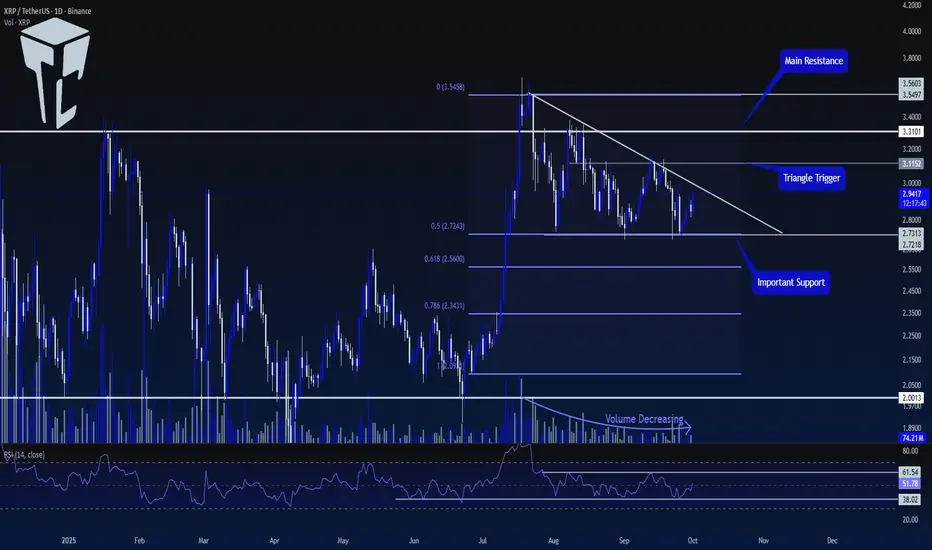
📅 Daily Timeframe
After getting support at the 2.0013 level, XRP made a bullish move up to the 3.5603 resistance. Now, it has formed a descending triangle, and the volume has been decreasing as the price moves down.
⚡️ Currently, a crucial support zone has formed at 2.7218, which overlaps with the 0.5 Fibonacci level, forming a PRZ for us.
🧩 A descending trendline has also been created, and the price has touched it several times, making lower highs.
📊 To confirm the next bullish move for this coin, the first confirmation we need is the breakout of the trendline. The trendline breakout trigger is at 3.1152.
✨ Once this level is broken, we can open a long position. This trigger is the first long position trigger and is considered risky since we haven't yet received the main confirmation for a bullish trend.
🔍 The main trigger for the start of a new bullish trend is the breakout of the 3.3101 level. Breaking this level could start a new upward move for XRP.
💥 A very important confirmation for both long and short positions on the RSI is the breakout of the range between 38.02 and 61.54.
🎲 As long as the RSI remains between these two levels, the probability of hitting stop losses is high. Therefore, for a long position, we can wait for the 61.54 level on the RSI to be broken.
🔽 For a short position, the 38.02 level on the RSI is a good momentum trigger. We can also use the 2.7218 level as a trigger, but keep in mind that the main market momentum is bullish, so this short trigger is considered risky.
📝 Final Thoughts
Stay calm, trade wisely, and let's capture the market's best opportunities!
This analysis reflects our opinions and is not financial advice.
Share your thoughts in the comments, and don’t forget to share this analysis with your friends! ❤️
$XRP are we back run it.As supported by momentum on the XRP side, upward momentum is accelerating with the reaction from the demand zone.

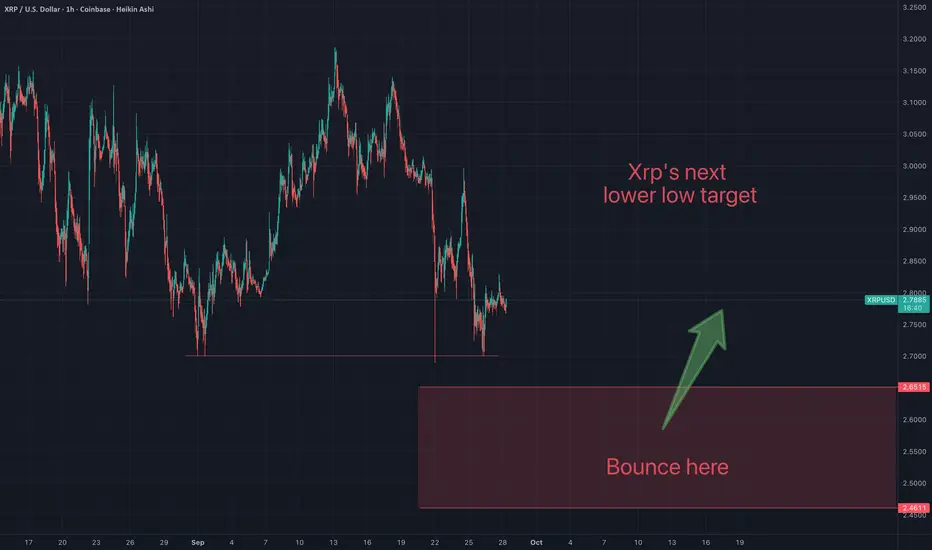
Xrp - Lower low incoming?Here's a simplified version of my next target. This next bottom could go even lower than my red box. But i'll be tracking Xrp closely because this next low may prove to be a good buying opportunity for me.
May the trends be with you.
BUY AND HOLDHello friends
You see that after the good rise we had, the price has entered a correction and it is a good opportunity to buy in a stepwise manner in the price correction with capital and risk management and move with it to the specified goals.
Ripple is a currency whose holders have a good expertise in disappointing short-term traders.
Note that the holding period is at least 3 months, so be patient and observe capital management.
*Trade safely with us*

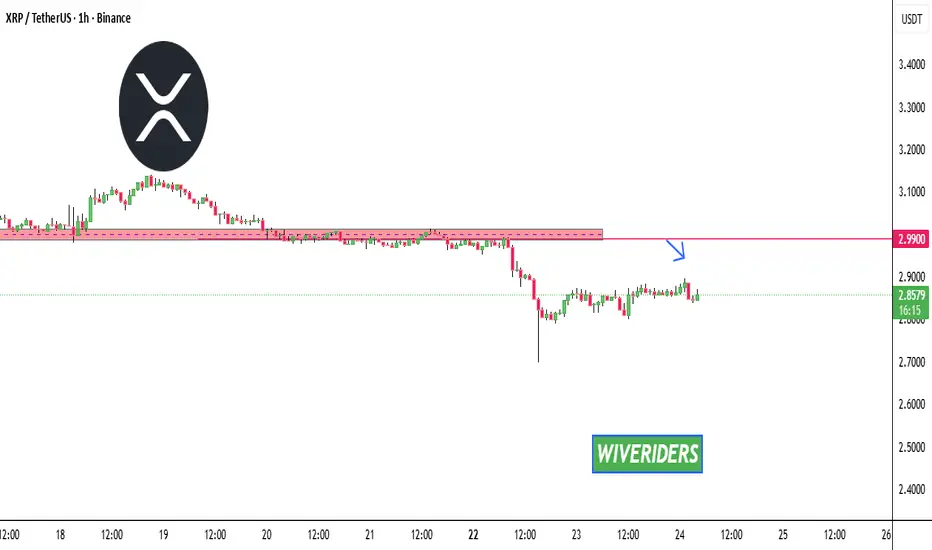
XRPUSDT, Ripple Bearish Short ScenarioPrice Action & Structure
• The chart clearly shows lower highs and lower lows, a classic downtrend structure.
• After the sharp sell-off around the 21st, XRP attempted a small rebound, but it stalled near the $2.99 – $3.00 resistance zone, aligning with the Fibonacci 0.5 retracement and pivot level.
• Since then, price has rejected again and is consolidating near $2.72, which is sitting close to the Fibonacci 1.618 extension. This suggests continuation pressure from sellers.
________________________________________
Fibonacci Levels & Resistance Zones
• $2.88 – $2.99 (Fib 0.382–0.5 + Pivot cluster): Heavy resistance. Sellers defended this zone aggressively, proving that bulls are weak at higher levels.
• $3.09 (Fib 0.618 + R2): Next resistance above, but price failed to even test it, further validating bearish strength.
• $2.62 (Fib support zone): First potential bearish target, as price seems to be heading in that direction.
• $2.57 – $2.50: Deeper extension support if breakdown accelerates.
________________________________________
Volume & Momentum
• The heavy red candles around the 21st–22nd show that sellers had much stronger momentum than buyers.
• Recent green candles are smaller in size and lack follow-through, which usually signals weak buying attempts in a bearish market.
• Momentum remains tilted toward the downside as long as XRP stays under $2.88–$2.99.
________________________________________
📌 Trade Setup (Bearish Bias)
• Entry: $2.72 (current levels or on a pullback to $2.85 resistance)
• Stop-Loss: $3.00 (above Fib 0.5 and pivot cluster)
• Take-Profit 1: $2.62 (Fib support)
• Take-Profit 2: $2.50 (extended bearish target)
• Risk/Reward: Approx. 1:2.
________________________________________
✅ Justification for Bearish Bias:
The trend structure is clearly bearish (lower highs/lows), XRP is failing to reclaim strong resistance zones ($2.88–$3.00), and Fibonacci + pivot confluence points confirm sellers are in control. Unless bulls break and sustain above $3.00, downside remains the path of least resistance.
________________________________________

$XRP Mild Bearish (September 25, 2025)BINANCE:XRPUSDT
CRYPTOCAP:XRP Mild Bearish Bias with Neutral RSI Hinting at Rebound Potential
Current Chart Analysis:
Overall Price Trend: XRP has declined from highs around 3.0 USDT earlier in the period, now at about 2.82-2.85 USDT (per chart labels). Recent candlesticks show a mix of red (bearish) with some green relief, suggesting easing selling pressure but overall downward bias. This aligns with a ~3.5% 24-hour uptick from broader data.
Ichimoku Cloud:Price is near or slightly below the cloud, a mild bearish signal indicating dominant downtrend, though the cloud is thickening slightly greenish (positive).
Tenkan-sen (red) below Kijun-sen (blue) in a bearish cross, but Chikou Span (lagging line) approaching from below offers hope for reversal. Cloud acts as resistance around 2.90.
RSI (Relative Strength Index): At 37.97 in the bottom panel—neutral, edging toward oversold (below 30). This implies slowing sells and potential short bounce, but no clear bullish divergence yet.
Volume and Momentum: High volume on red candles confirms selling, but trend lines (like green) are stabilizing. Price testing support near 2.80.
Analysis Summary: The chart leans Mildly Bearish overall, with downward momentum, but neutral RSI and recent recovery add room for temporary relief.
Here are the possible scenarios:
Base Scenario (Bearish, 60% probability): Price could test lower levels around 2.75-2.80 USDT if selling resumes (especially if cloud holds as resistance). This without a positive Ichimoku cross or strong green candle.
Alternative Scenario (Mild Bullish, 40% probability): A bounce to 2.90-2.95 USDT, if RSI rises above 50 and price breaks Kijun-sen. This would be short-lived, not altering the bigger bearish picture.
Monitor key levels: Support at 2.80, resistance at 2.90.

XRP ETF Approved, But Price Hurts—Will Big Players Act?At the time of writing, XRP trades at $2.84, just under the $2.85 resistance. A flip of this barrier into support would likely signal the beginning of a reversal, strengthening bullish sentiment. Traders are closely watching this zone for confirmation.
If support from LTHs holds, XRP could climb toward $2.94 in the short term. Breaching this level would pave the way for a further rise to $3.02, signaling broader recovery potential and invalidating near-term bearish concerns.
However, if market conditions worsen or LTHs shift their strategy to selling, XRP could lose momentum. The altcoin risks sliding toward $2.75 or even deeper to $2.64, putting bullish expectations in jeopardy and prolonging the consolidation phase.

The key is whether it can rise above 3.0361
Hello, fellow traders.
Follow us to get the latest information quickly.
Have a great day.
-------------------------------------
(XRPUSDT 1D chart)
The key is whether it can rise above 3.0361 and sustain the price after the next period of volatility, around October 2nd.
This period of volatility is expected to continue until September 25th, and we should examine whether support can be found around 2.9092 and whether it can rise.
-
If the price falls below the M-Signal indicator on the 1W chart,
1st: 2.5102-2.6013
2nd: 2.1453-2.2582
We should check for support near the 1st and 2nd levels above.
-
If the price remains above the M-Signal indicator on the 1D chart, further upside is highly likely, so it's important to determine whether support can be found near 3.0361.
The best time to buy was when support was found at key support and resistance levels, or around the 2.1453-2.2582 range.
Currently, a new buy is possible when support is found near 3.0361.
However, since this does not fit the basic trading strategy, a quick and rapid response is required.
-
The basic trading strategy is to buy in the DOM(-60) ~ HA-Low range and sell in the HA-High ~ DOM(60) range.
However, if the HA-High ~ DOM(60) range rises, a step-up trend is likely, while if the DOM(-60) ~ HA-Low range falls, a step-down trend is likely.
Therefore, the basic trading strategy should be a segmented trading approach.
-
The HA-High ~ DOM(60) range on the 1D chart is currently 3.4037-3.4540.
Therefore, a rise to around 3.4037 is possible.
However, since the DOM(60) point on the 1M chart is formed at 3.0361, if the price rises above 3.0361 and maintains, a long-term step-up trend is likely.
Therefore, the current buying opportunity should be when support is confirmed around 3.0361.
-
(1W chart)
To rise above 3.0361 and maintain support, the upward trend should continue.
- The StochRSI indicator should be trending upward. Ideally, it should not enter the overbought zone.
- The On-By-Value (OBV) indicator should be trending upward. Ideally, it should remain above the High Line.
- The TC (Trend Check) indicator should be trending upward. Ideally, it should remain above the zero level.
If the above conditions are met, the upward trend is expected to continue.
-
Thank you for reading.
We wish you successful trading.
--------------------------------------------------

$XRP run it back turbo.XRP is preparing for a new wave of growth following a breakout from a major downtrend and a retest.

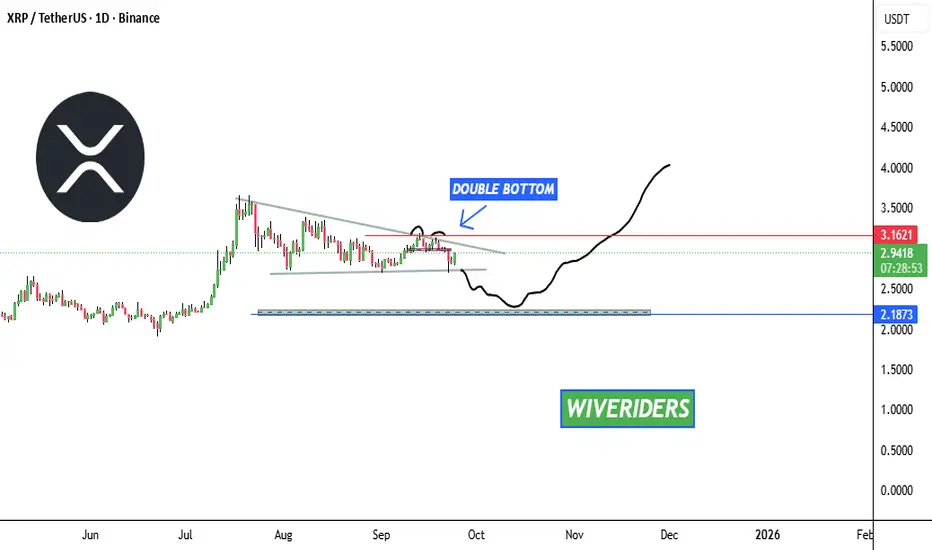
XRP Daily Market Update📊 CRYPTOCAP:XRP Daily Market Update
CRYPTOCAP:XRP is forming bullish patterns overall ✅ but here’s what’s next:
1️⃣ Around $3.1621 there is a Double Top bearish pattern. XRP needs to break this level with confirmation to indicate the trend remains bullish.
2️⃣ Another option ⚠️ — XRP could cross down, grab liquidity, hunt stop-losses, and reach the green support zone around $2.1873. From there, buyers may step in again since strong accumulation and volume exchanged at this level.
🔎 On the higher time frame, XRP is still bullish 📈 — but this is the daily scenario at the moment.
XRPUSDT: Downtrend and Future Trading StrategyHello traders, based on the chart and the latest news on XRPUSDT, the current trend is leaning towards a downtrend. The gradually decreasing resistance indicates strong selling pressure, and XRP is trading below the Ichimoku Cloud, confirming the short-term bearish trend. XRP has dropped sharply from $2.87 to $2.77 on September 23, 2025 , due to a contract liquidation event worth $1.7 billion, mainly from long positions, causing further price correction.
With resistance at $2.8900, if the price cannot break through this level, the likelihood of a further decline towards $2.6200 is high. This is the next key support level to watch. If the downtrend continues, this support zone could be tested again.
Trading Strategy: Watch for selling opportunities near the $2.8900 resistance and set a stop-loss if the price moves above this level.

XRP Technical Setup | Bullish Confirmation or Resistance Trap?🕵️♂️ XRP/USDT – "RIPPLE VS TETHER" Wealth Strategy Map 💰⚡
Idea Type: Swing/Day Trade
Market Mood: Bullish confirmed ✅
📊 Plan Breakdown
📈 Setup: Bullish bias confirmed with TMA (Triangular Moving Average) breakout ➕ pullback.
🕯️ Extra Confirmation: Heikin Ashi Doji → Bull Reversal spotted.
🎯 Execution Style: Thief Strategy = Layered limit order entries (stealthy stacking style).
🎯 Entry Plan (Layering Method)
Multiple buy layers placed around these zones:
💎 3.0400
💎 3.0600
💎 3.0800
💎 3.1000
🔑 Traders can add or reduce layers depending on personal risk preference.
🛑 Stop Loss (Thief’s Shield)
Suggested defense line around 3.0000.
⚠️ Note to Thief OGs: SL is personal. Manage risk wisely, protect your capital.
🎯 Target (The Escape Plan 🚪💨)
Overhead zone = Electric Shock Fence ⚡ (major resistance + overbought trap).
Suggested escape target: take profit before getting trapped at resistance zone.
⚠️ Reminder: Not financial advice — adapt targets to your style.
🔍 Related Pairs to Watch (Correlation Check)
💵 BITSTAMP:BTCUSD → Bitcoin often leads XRP momentum.
💵 BITSTAMP:ETHUSD → Ethereum trend can mirror altcoin sentiment.
💵 COINBASE:XLMUSD → Stellar has historic correlation with XRP moves.
💵 CRYPTOCAP:USDT.D (Tether Dominance) → Watching stablecoin flows gives clues about liquidity shifts.
👑 Thief Notes:
Dear Ladies & Gentlemen (Thief OG’s) 🕶️💼
This map is for educational & strategic illustration.
I’m not recommending you to strictly follow my SL/TP.
Manage your own layers, steal the opportunity, and escape with your own timing.
✨ “If you find value in my analysis, a 👍 and 🚀 boost is much appreciated — it helps me share more setups with the community!”
#XRP #XRPUSDT #Crypto #CryptoTrading #SwingTrade #DayTrade #LayeringStrategy #HeikinAshi #TMA #Altcoins #ThiefTrader

XRP Market Update📊 CRYPTOCAP:XRP Market Update
If CRYPTOCAP:XRP reaches the red resistance zone 🔴, wait for confirmation before entering a short position ⚠️
This is the level where sellers are still active and could push the price down again 📉
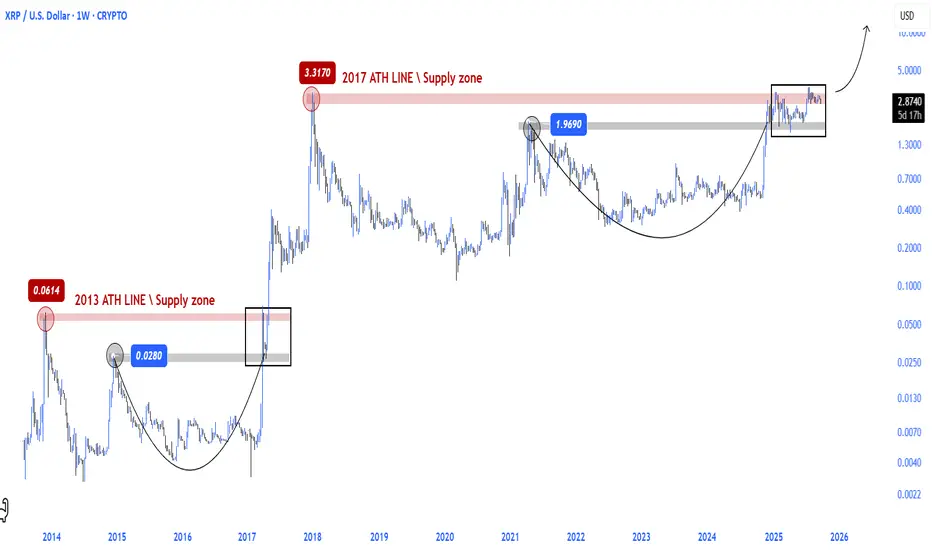
XRP running phaseRipple CRYPTOCAP:XRP before another epic running phase.
In the coming period, another major run may be seen with the breaking of the 2017 ATH level.
XRP Update📊 CRYPTOCAP:XRP Update
If XRP moves back to the red resistance zone, wait for confirmation before entering a short position. ⚠️
This is the zone where sellers could step in again and push the price down from this level. 📉

Why Greed Controls Most Traders During Market PumpsHave you ever felt greed controlling your decisions?
Every trader, even professionals, has fallen victim to this emotion at least once.
This analysis provides strategies to understand greed and avoid emotional trading mistakes.
Hello✌️
Spend 2 minutes ⏰ reading this educational material.
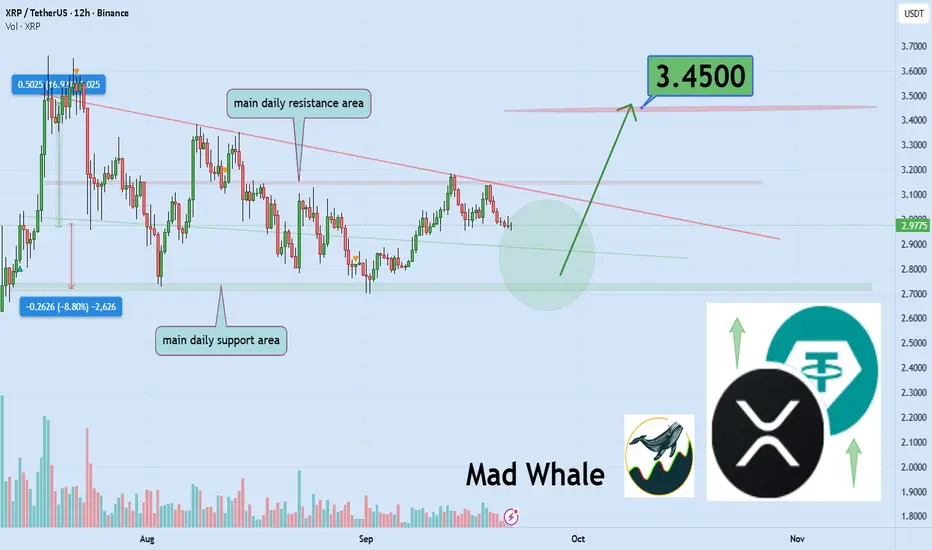
🎯 Analytical Insight on Ripple:
XRP is testing a strong support while facing key trendline resistance near 3.10–3.15. A confirmed breakout with solid volume could drive a 16% rally, targeting 3.45. 📊🚀
Now , let's dive into the educational section,
📈 Market Psychology and Trader Greed
Greed is one of the most powerful drivers in the crypto market.
Sudden pumps trigger FOMO in traders’ minds.
Emotional decisions often lead to liquidation or missed profits.
Understanding how the market plays with emotions is the key to success.
Traders often enter trades during high emotions without logical analysis.
Recognizing market psychology reduces risk and enables smarter decisions.
Fear and greed create a constant cycle that must be understood.
Emotional reactions drive sharp short-term volatility.
Being aware of these cycles helps manage opportunities more effectively.
The market constantly moves with traders’ emotions, always seeking greed.
⚡ Common Trader Mistakes
Entering the market based solely on news hype
Holding too long during pumps
Ignoring technical indicators
Making decisions under others’ FOMO influence
Overusing leverage
Recognizing these mistakes is the first step to controlling greed.
🛠️ TradingView Tools and Indicators
RSI: Identifies overbought and oversold levels, preventing emotional trades.
MACD: Signals trend changes and logical entry/exit points.
Volume Profile: Reveals psychological support and resistance levels.
Moving Averages: Shows the dominant trend, reducing the impact of short-term emotions.
Alerts: Notifies you so you can act timely without constantly watching the chart.
Combining these tools provides a practical and scientific way to manage greed.
🔍 Market Psychological Cycles
The market always cycles through fear and greed.
During price rallies, greed dominates.
During declines, fear paralyzes traders.
Focusing on trends and indicators reduces emotional impact.
Combining technical signals with psychological awareness produces better decisions.
This scientific approach increases the value of your analysis in the eyes of editors.
🔔 Summary
Greed always exists, but it can be controlled with tools and knowledge.
Patience and risk management make the difference between success and failure.
Momentary emotion should never dictate your final decision.
🌟 3 Key Recommendations for Market Success
Always analyze indicators before entering a trade – never let emotions dictate your actions.
Set stop-losses and manage risk – protecting capital is more important than short-term gains.
Practice self-awareness – understanding your fear and greed is a powerful tool for successful trading.
✨ Need a little love!
We pour love into every post your support keeps us inspired! 💛 Don’t be shy, we’d love to hear from you on comments. Big thanks, Mad Whale 🐋
📜Please make sure to do your own research before investing, and review the disclaimer provided at the end of each post
XRP; The double top pattern is fake!!!Hello friends
Regarding the price channel we had, after a long time this channel has been broken and now a double top pattern has formed which looks fake and wants to trap sellers.
If the price continues to move upwards, it can move to the specified areas.
If the formed pattern really wants to act and we have a price drop, the bottom of the channel and its midline are good supports.
*Trade safely with us*

XRPUSDT: A Long Opportunity You Can’t MissXRPUSDT is looking pretty interesting right now. The price has broken through the nearest resistance level and has come back to retest it. Classic breakout and retest setup.
The price got rejected from that level, turning it into a new support zone. This is a solid long signal. My target is 3.3828.
What do you think?

XRPUSD: Buy the Dips Above 2.90, Target the ATHAfter printing a new all-time high at the end of July, COINBASE:XRPUSD entered a correction phase that bottomed in early September around 2.70.
From there, the rebound was strong: price broke above the falling trendline and, even more importantly, reclaimed the 3.00 psychological level.
Looking at the broader chart structure since June, the picture is constructive and it’s reasonable to expect further upside — potentially a retest of the previous ATH, or even the making of a fresh one.
📈 Bias: I remain bullish on XRP as long as price holds above 2.90.
🎯 Trading Plan: The strategy here is to buy dips, with the old ATH as the first big target.

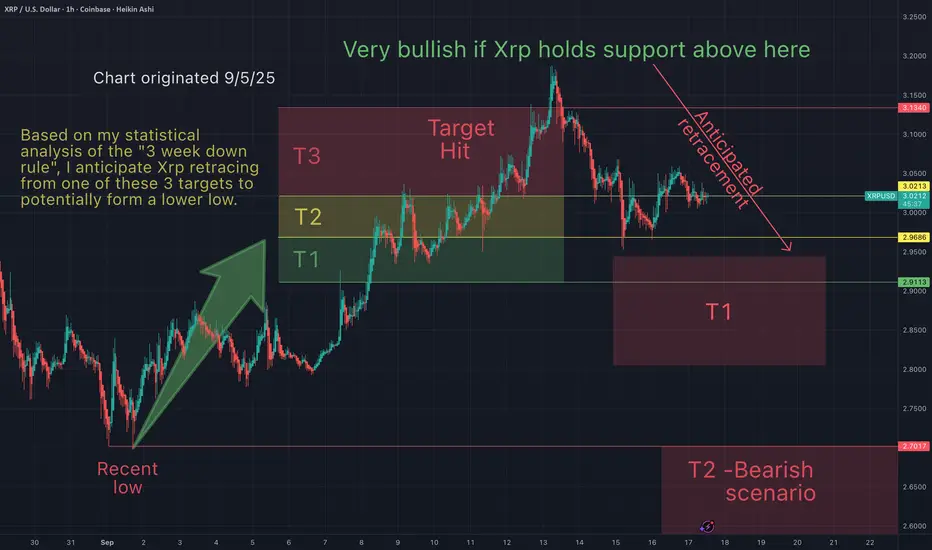
Is Xrp going lower?On Sept 5th I suggested that Xrp was bullish and heading up towards my take profit (T1-T3), then retrace.
Things are going according to what I was expecting. Congratulation to everyone who has made some gains here based on everything suggested on my charts. The most important thing is a trading strategy. And these strategies have made incedible gains over time.
Question remains, will Xrp bounce off my T1 red target or make a lower low? What do you think?
I'd like to hear form you to gauge sentiment.
May the trends (continue to) be with you.