#XRP/USDT XRP (1h) (spot)#XRP
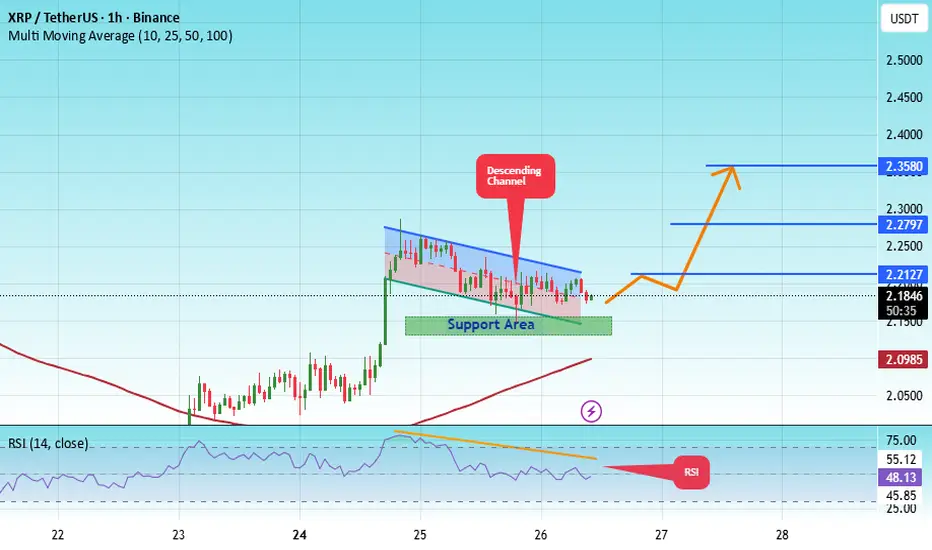
The price is moving within an ascending channel on the 1-hour timeframe and is holding well. It is poised to break out strongly and retest the channel.
We have a downtrend line on the RSI indicator that is about to break and retest, which supports the upward move.
There is a key support zone in green at the price of 2.14, representing a strong support point.
We have a trend to stabilize above the 100-period moving average.
Entry price: 2.18
First target: 2.21
Second target: 2.28
Third target: 2.35
Don't forget a simple money management rule:
Place your stop-loss order below the green support zone.
Once you reach the first target, save some money and then change your stop-loss order to an entry order.
For any questions, please leave a comment.
Thank you.
Xrpusdtlong
XRP Approaching Key Supply Zone: Break or Reject?Hi!
Bullish Scenario
A bullish continuation becomes likely only if price breaks and closes above the $2.12–$2.18 S&D zone.
If that happens:
Buyers regain control
A retest could confirm support
Next target -> descending trendline at $2.35–$2.45
Conclusion:
Break S&D -> Long toward the descending trendline.
Bearish Scenario
If price rejects from the S&D zone and fails to reclaim $2.12–$2.18:
Momentum shifts back to the downside
Price may retest the $1.90–$1.92 zone, the most recent low
Further breakdown could lead to new cycle weakness

XRP/USDT — Reversal Incoming or Deeper Breakdown?XRP is now standing at a make-or-break point. After weeks of movement inside a well-defined descending channel, price is once again testing the critical support zone at 2.32–2.17 — the level that has repeatedly acted as the last line of defense for the bulls.
This zone has held multiple times, yet each bounce has been capped by the upper boundary of the channel — forming a classic corrective structure where bearish momentum gradually weakens, preparing for a potential breakout phase.
---
📊 Pattern & Technical Structure
The chart reveals a descending channel pattern, typically signaling a corrective or consolidation phase within a broader market cycle.
Lower boundary of the channel → potential accumulation area and source of rebound.
Midline → dynamic resistance that has repeatedly rejected upward attempts.
Support box 2.32–2.17 → the decision zone, where bulls and bears will soon reveal the next major trend.
Failure to hold this level could trigger another leg down, while a strong defense here could mark the beginning of a larger trend reversal.
---
🚀 Bullish Scenario
A bullish breakout setup will be confirmed if:
1. Price closes above the descending channel with strong daily momentum.
2. The breakout is followed by a successful retest of 2.75 as a new support.
3. Upside targets then lie at 3.09 – 3.32 – 3.56 – 3.66, representing potential wave extensions.
If validated, this move could trigger a powerful recovery rally and possibly signal a major bullish reversal on the higher timeframes.
---
🔻 Bearish Scenario
On the flip side, if the 2.17 support fails to hold and a daily close occurs below this zone, then:
Price could continue sliding toward the lower boundary of the channel (1.95–1.80),
Extending the correction phase,
And potentially forming a lower-low structure in continuation of the broader downtrend.
This would confirm a sustained bearish control in the medium term.
---
📍 Conclusion
XRP is at the edge of compression, where the next decisive move will define its next big trend.
This descending channel may soon reveal whether it’s a bear trap before a breakout, or the start of another downward leg.
The reaction at the 2.32–2.17 zone will decide everything — this is the battlefield between reversal and breakdown.
Watch for daily closes, volume confirmation, and price behavior around the upper boundary of the channel.
Smart traders know — the calm before the breakout is where the biggest opportunities are born.
---
#XRP #XRPUSDT #Ripple #CryptoAnalysis #TechnicalAnalysis #DescendingChannel #PriceAction #SupportResistance #CryptoBreakout #SwingTrade #ChartPattern

#XRPUSDT: Bullish Reversal Coming With Price Heading Back To 3.5## XRPUSDT Analysis: Long-Term Perspective
In the long term, we anticipate the XRPUSDT price to revert to its all-time high of 3.5. From a fundamental analysis standpoint, we maintain a positive outlook, with the potential for the price to surpass 3.5. We have identified a favourable trading opportunity, as illustrated in the chart.
Our approach is neutral, as the trend remains undecided. Based on the duration of your positions, you can set two targets:
1. **Short-Term Target:** If you intend to hold your positions for a short period, aim for a price level above 3.5.
2. **Long-Term Target:** For long-term investors, a target price of 4.0 or higher is plausible.
We are committed to providing comprehensive analysis and support. Should you have any inquiries or require further clarification, please do not hesitate to contact us.
Additionally, we would appreciate your insights on which cryptocurrency pair you would like to explore next.
Regards,
Team Setupsfx_

#XRPUSDT: Swing Buy At 2.60, Possible Target At 3.50! We have strong bullish confirmation in smaller time frames that we can take a swing buy entry on XRPUSDT. There is a single major target at 3.50 but the price could move beyond that region. Please like and comment on the next cryptocurrency pair you would like us to analyse.
Team Setupsfx

XRPUSDT - BULLISH CONTINUATION IN SIGHTSymbol - XRPUSDT
XRPUSDT is making an attempt to break above the upper boundary of its trading range amid a broader bullish rebound across the cryptocurrency market. A confirmed breakout could develop after a short-term pullback.
The market continues to recover from the liquidation event of last week, with Bitcoin displaying structural strength - hinting at a possible return of bullish momentum. This supports a more optimistic outlook for the overall crypto sector.
Currently, XRPUSDT is testing resistance and entering a consolidation phase. The main breakout point sits near 2.661 However, during consolidation, a retest of support levels remains possible as the market may seek liquidity before a potential upside move.
Resistance levels: 2.661, 2.739
Support levels: 2.587, 2.547, 2.500
Since the beginning of the session, momentum has remained notably strong, though a short correction could occur before the upward trend resumes. During this corrective phase, XRPUSDT may retrace toward the 2.587 – 2.500 zone to gather liquidity before continuing higher.
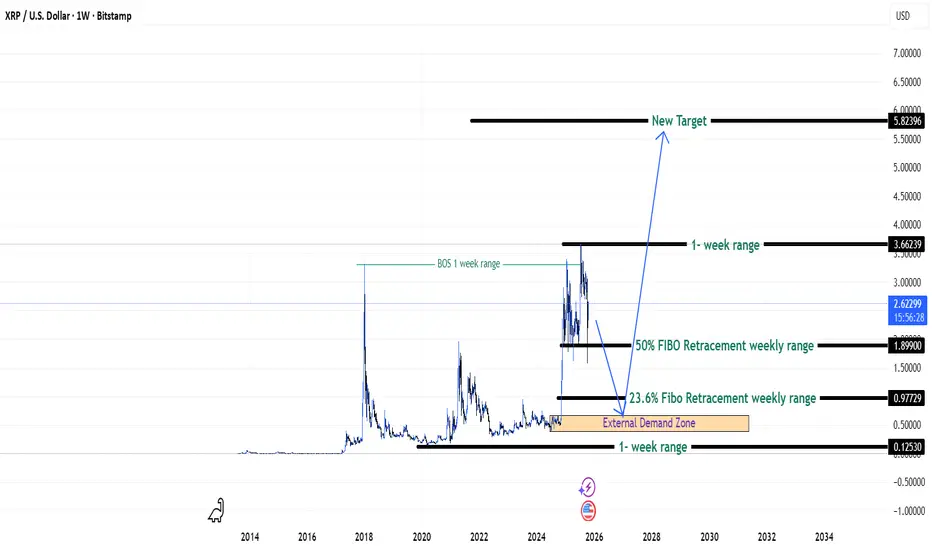
XRP Chasing New Highs - {26/10/2025}Educational Analysis says that XRPUSD or XRPUSDT (Crypto Pair) may give trend Trading opportunities from this range, according to my technical analysis.
Broker - Bitstamp
So, my analysis is based on a top-down approach from weekly to trend range to internal trend range.
So my analysis comprises of two structures: 1) Break of structure on weekly range and 2) Trading Range to fill the remaining fair value gap
Let's see what this Crypto Pair brings to the table for us in the future.
DISCLAIMER:-
This is not an entry signal. THIS IS FOR EDUCATIONAL PURPOSES ONLY.
I HAVE NO CONCERNS WITH YOUR PROFITS OR LOSS,
Happy Trading,
FX Pairs & Crypto Curreny Trade Analysis.
My Analysis is:-
Short term trend may be go to the external demand zone.
Long term trend breaks the new high after going from discount zone.
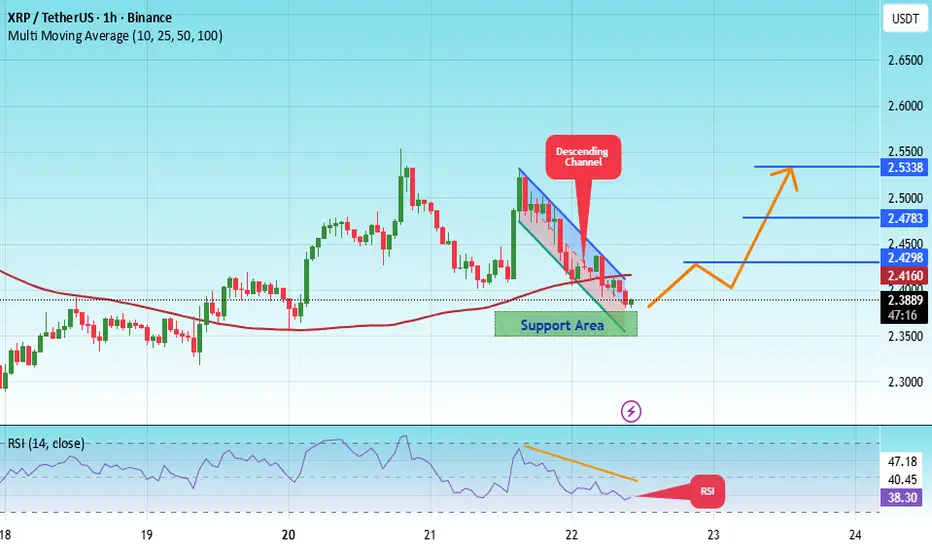
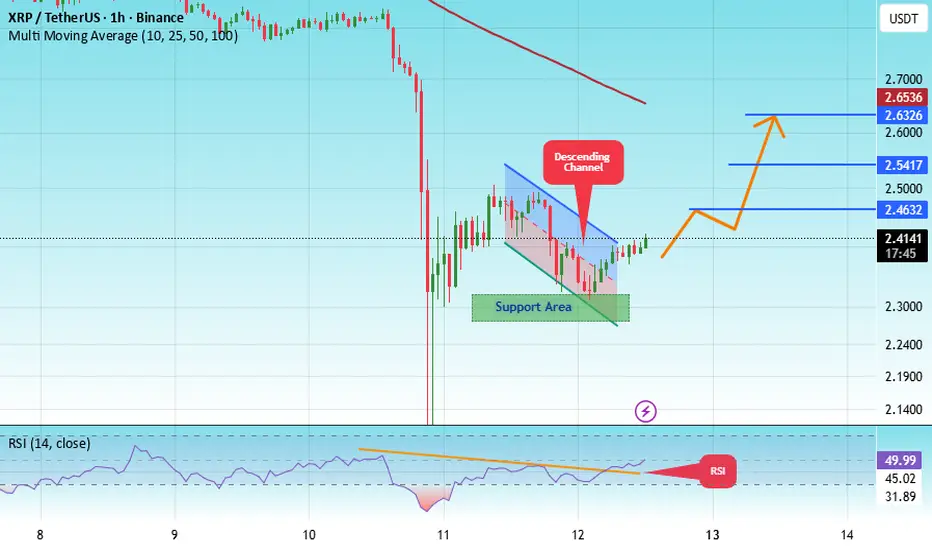
#XRP/USDT (1H) chart, here’s a full technical read:#XRP
The price is moving within a descending channel on the 1-hour frame, adhering well to it, and is heading for a strong breakout and retest.
We have a bearish trend on the RSI indicator that is about to be broken and retested, which supports the upward breakout.
There is a major support area in green at 2.36, representing a strong support point.
We are heading for consolidation above the 100 moving average.
Entry price: 2.38
First target: 2.41
Second target: 2.47
Third target: 2.53
Don't forget a simple matter: capital management.
When you reach the first target, save some money and then change your stop-loss order to an entry order.
For inquiries, please leave a comment.
Thank you.
#XRP/USDT long idea/classic pattern#XRP
The price is moving within a descending channel on the 1-hour frame, adhering well to it, and is heading for a strong breakout and retest.
We have a bearish trend on the RSI indicator that is about to be broken and retested, which supports the upward breakout.
There is a major support area in green at 2.30, representing a strong support point.
We are heading for consolidation above the 100 moving average.
Entry price: 2.41
First target: 2.46
Second target: 2.54
Third target: 2.63
Don't forget a simple matter: capital management.
When you reach the first target, save some money and then change your stop-loss order to an entry order.
For inquiries, please leave a comment.
Thank you.
#XRP/USDT looking extremely bullish#XRP
The price is moving within a descending channel on the 1-hour frame, adhering well to it, and is heading for a strong breakout and retest.
We have a bearish trend on the RSI indicator that is about to be broken and retested, which supports the upward breakout.
There is a major support area in green at 2.93, representing a strong support point.
We are heading for consolidation above the 100 moving average.
Entry price: 2.96
First target: 3.02
Second target: 3.06
Third target: 3.10
Don't forget a simple matter: capital management.
When you reach the first target, save some money and then change your stop-loss order to an entry order.
For inquiries, please leave a comment.
Thank you.

XRP 1H Analysis - Key Triggers Ahead☃️ Welcome to the cryptos winter , I hope you’ve started your day well.
⏰ We’re analyzing XRP on the 1-Hour timeframe .
👀 On the 1-hour timeframe, XRP recently completed a solid bullish rally, reaching resistance around $3.06, before retracing toward its local support zone near $2.94. The coin has tested its top level about three times, getting rejected each time under selling pressure. After the latest rejection and rebound from the $2.94 zone, a short-term trigger has formed around $2.98 — a breakout above this level could significantly increase the likelihood of a resistance breakout.
🧮 The RSI oscillator shows that after ranging below the 50 zone, it has now crossed above it and is heading upward. A 1-hour candle close above the trigger zone would confirm bullish momentum; otherwise, the move risks failing.
🕯 The recent candle structure on the 1-hour chart has been relatively range-bound, partly due to low market activity during holidays. However, with increasing volume and the larger size of recent bullish candles, there’s potential for stronger upward continuation.
🧠 For XRP positions, traders can consider low-risk entries once a candle closes above the marked trigger zone in this analysis. Rising volume and strong candle closures may fuel volatility and expand long opportunities.
❤️ Disclaimer : This analysis is purely based on my personal opinion and I only trade if the stated triggers are activated .

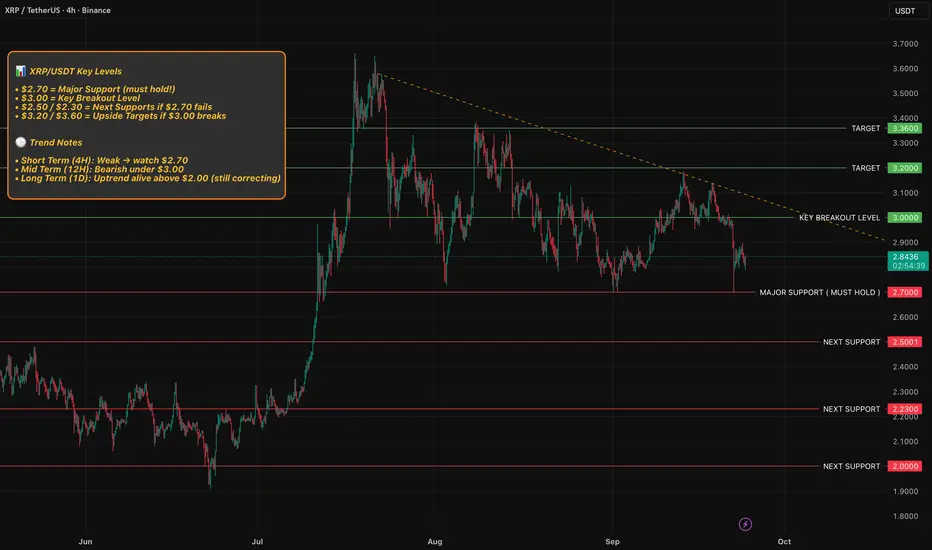
XRP is at a MAJOR decision point !
📊 XRP/USDT Key Levels
• $2.70 = Major Support (must hold!)
• $3.00 = Key Breakout Level
• $2.50 / $2.30 = Next Supports if $2.70 fails
• $3.20 / $3.60 = Upside Targets if $3.00 breaks
🕒 Trend Notes
• Short Term (4H): Weak → watch $2.70
• Mid Term (12H): Bearish under $3.00
• Long Term (1D): Uptrend alive above $2.00 (still correcting)
Thank you for reading my idea, let me know your thoughts and please support by leaving a simple comment as this helps me stay motivated and keep going.
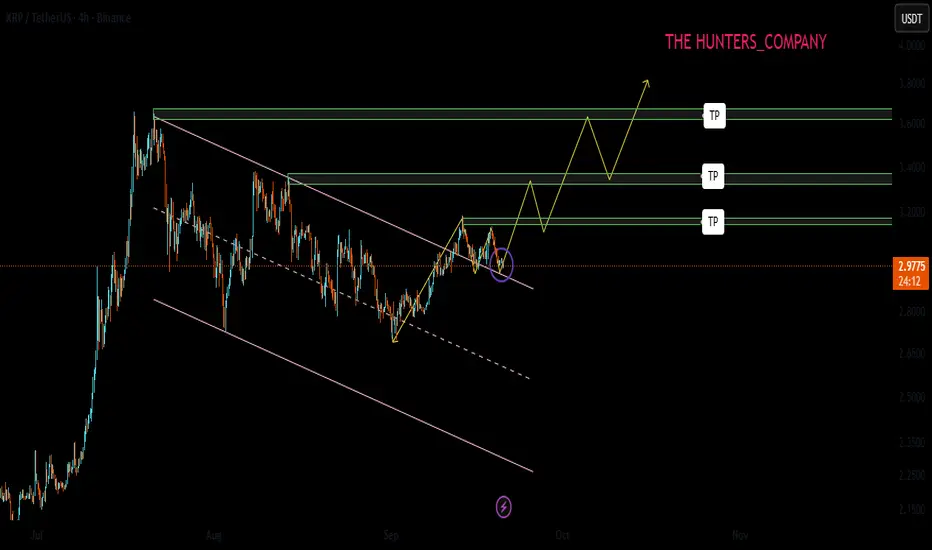
XRP; The double top pattern is fake!!!Hello friends
Regarding the price channel we had, after a long time this channel has been broken and now a double top pattern has formed which looks fake and wants to trap sellers.
If the price continues to move upwards, it can move to the specified areas.
If the formed pattern really wants to act and we have a price drop, the bottom of the channel and its midline are good supports.
*Trade safely with us*
XRPUSDT: A Long Opportunity You Can’t MissXRPUSDT is looking pretty interesting right now. The price has broken through the nearest resistance level and has come back to retest it. Classic breakout and retest setup.
The price got rejected from that level, turning it into a new support zone. This is a solid long signal. My target is 3.3828.
What do you think?

XRP Ready for a Bullish Rally?XRP is breaking out of a descending wedge structure on the daily chart after weeks of consolidation. Price is reclaiming moving averages (50 EMA & 100 EMA), showing renewed bullish momentum.
✏️ Entry Zone: ~$3.05
✏️ Target (TP): $5.00 (major resistance from previous high)
✏️ Stop-Loss (SL): ~$2.70(below support / invalidation level)
✏️ Risk/Reward Ratio: 1:6
Key Points
- Daily structure shows a series of higher lows holding strong.
- Breakout accompanied by volume confirmation suggests buyers stepping in.
- If price sustains above the breakout trendline, momentum could extend toward $5+.
- Losing $2.70 support would invalidate the bullish setup.
Cheers
Hexa

From Sideways to Skyward: XRP Setting Up Another BoomXRP has been following a simple pattern, accumulate, then boom. We saw this play out earlier where months of sideways action led to a sharp rally.
Right now, the weekly chart is showing a similar setup. Price is consolidating again inside a tight range, holding steady in the current zone. This looks like healthy accumulation before the next move.
If history repeats, a breakout from this consolidation could trigger another explosive leg upward, potentially sending XRP much higher. As long as it stays above the accumulation box, the bias remains bullish.
DYOR, NFA
Next updates coming soon!

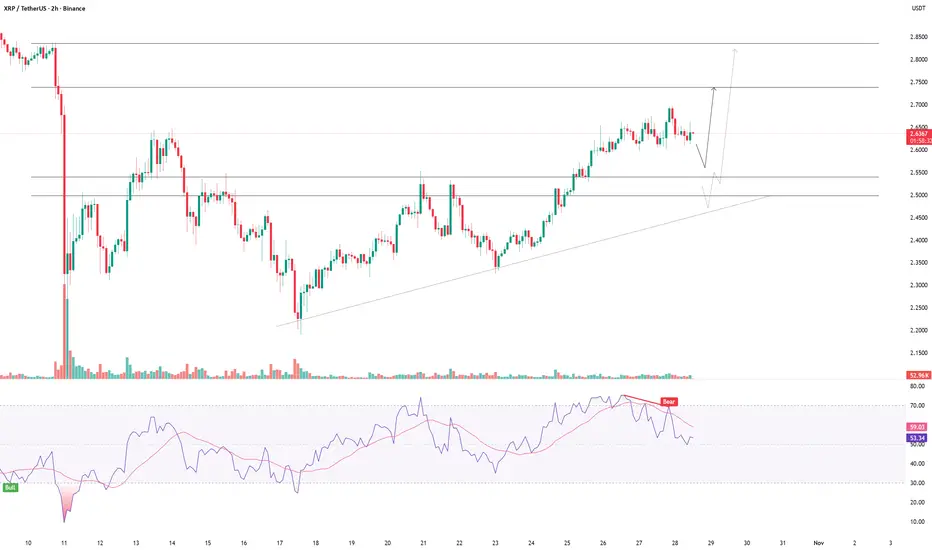
XRP at a Crossroads: Two Scenarios For The Next Big MoveBefore looking ahead, lets review the current situation: Since December 2024 XRP has been consolidating in a sideways range between $2.00 and $3.50, similar to the pattern seen before last year rally.
After setting a new ATH, XRP has now entered a corrective phase with two possible Scenarios:
1: Break the support zone and drop toward $1.90-$2.10, followed by the start of a new bullish trend.
2: Hold the support zone and move upward toward the dynamic resistance. in this case, XRP could first reach $3.70 and if broke the dynamic resistance, another strong bullish wave similar to the previous one will happen
This analysis is personal opinion, Not financial advice.

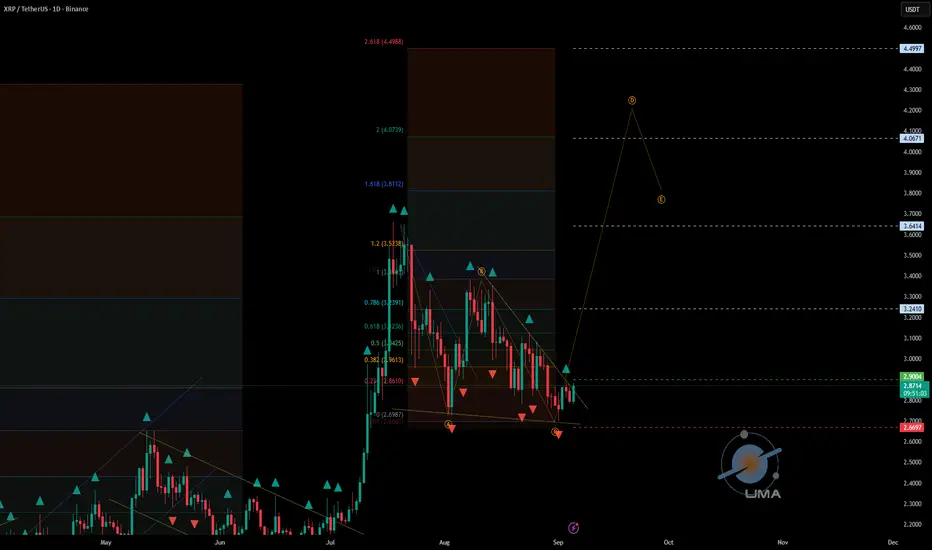
#XRPUSDT - UniverseMetta - Signal#XRPUSDT - UniverseMetta - Signal
D1 - Formation of ABC structure in continuation of the trend.
H4 - Formation of the 3rd wave + breakout of the trend line. Stop behind the minimum of the 1st wave.
Entry: 2.9004
TP: 3.2410 - 3.6414 - 4.0671 - 4.4997
Stop: 2.6697
AltcoinPioneers | XRP Daily Analysis Day1BINANCE:XRPUSDT
AltcoinPioneers | XRP Daily Analysis Day1
👋 Welcome to Altcoin Pioneers Group TRADING ™!
Let’s analyze XRP. Let’s explore the reason behind it and what Bitcoin’s next move might be.
It features a falling wedge pattern 🔻, marked with red lines ❌, indicating a potential reversal ⬆️.
The price rose initially 📈, then declined 📉 within the wedge, forming lower highs and lower lows.
A target price 🎯 is indicated around 3,0881 USDT 💰, suggesting a possible upward breakout 🚀.
The current price is near 2,829 USDT 📍.

XRPUSDT: Trade 15 minHello, I opened a trade on Ripple, the points where the price is likely to reverse are marked, so in the lower timeframe there is a short-term trend towards gain. Be profitable.

#XRP How Long To Reach 3.31 ?#XRP
The price is moving within a descending channel on the 1-hour frame, adhering well to it, and is heading for a strong breakout and retest.
We have a bearish trend on the RSI indicator that is about to be broken and retested, supporting the upside.
There is a major support area (in green) at 2.80, which represents a strong basis for the upside.
For inquiries, please leave a comment.
We are in a consolidation trend above the 100 Moving Average.
Entry price: 2.90
First target: 3.30
Second target: 3.14
Third target: 3.31
Don't forget a simple matter: capital management.
When you reach the first target, save some money and then change your stop-loss order to an entry order.
For inquiries, please leave a comment.
Thank you.

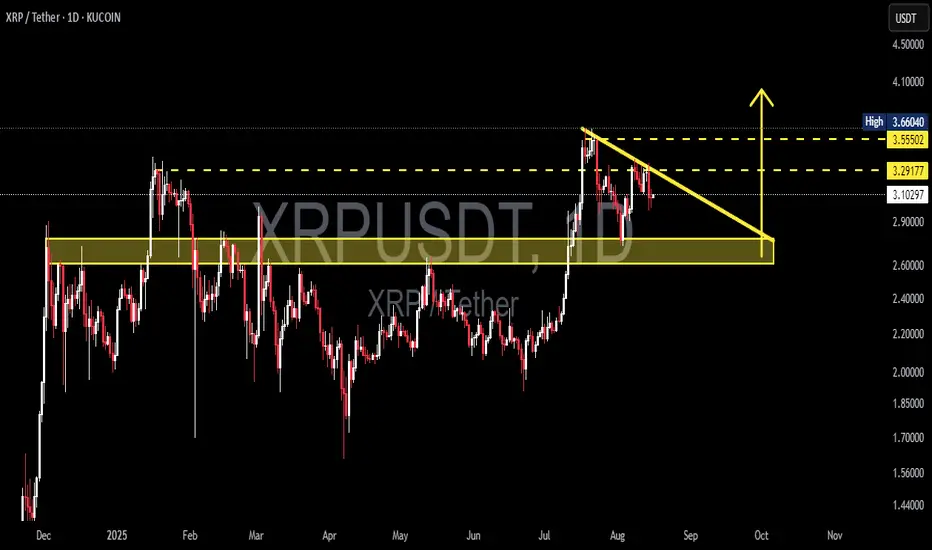
XRPUSDT — Descending Triangle Key Zone: Breakout or Breakdown?📊 Overview
XRPUSDT is currently trading inside a descending triangle formation after its strong rally in July. Price action shows consistent lower highs pressing downward while the support zone at 2.70 – 2.95 (major demand area) is still holding.
This setup is now at a critical decision point: Will the bulls defend the demand zone and push XRP back toward the major resistance at 3.55–3.66, or will bears take control and trigger a deeper correction toward 2.30?
---
🔥 Pattern Explanation
Descending Triangle: Downtrend line connecting lower highs with a flat horizontal base at demand support.
Supply & Demand: The 2.70–2.95 area was a major resistance in the past, now flipped into demand.
Psychological level: The 3.00 mark acts as a psychological pivot zone where reactions often accelerate.
Timing: The triangle’s apex points toward late September – October, meaning volatility is likely to explode before then.
---
✅ Bullish Scenario (Breakout)
1. Trigger: Daily close above the descending trendline and reclaiming 3.29.
2. Strong confirmation: Break and hold above 3.55, opening the path toward 3.66.
3. Measured move target: Triangle height (~0.60–0.75) projects upside to 3.90 – 4.00.
4. Extended target: If volume expands during breakout, rally could extend to 4.10–4.20.
---
⚠️ Bearish Scenario (Breakdown)
1. Trigger: Daily close below 2.90, breaking the demand zone.
2. Immediate targets: 2.60 and then 2.40 as historical supports.
3. Measured move target: Full breakdown projects downside toward 2.30 – 2.15.
4. Invalidation: Price reclaiming 3.10–3.29 after a breakdown.
---
📌 Key Levels to Watch
Supports: 2.95 – 2.70, 2.60, 2.40.
Resistances: 3.29, 3.55, 3.66, 3.90, 4.10.
---
📈 Conclusion
XRPUSDT is consolidating at a make-or-break level inside a descending triangle. As long as 2.70–2.95 holds, bulls have a chance to push price back toward 3.55–3.66 and potentially higher. But if this demand zone gives way, a sharp correction toward 2.30 could follow.
⚡ This descending triangle could act as the catalyst for XRP’s next big move in the coming quarter. Wait for a daily close confirmation to reduce the risk of fakeouts.
#XRP #XRPUSDT #CryptoAnalysis #PriceAction #DescendingTriangle #BreakoutTrading #CryptoTraders #AltcoinAnalysis #SupportResistance
XRPUSDT - UniverseMetta - Analysis#XRPUSDT - UniverseMetta - Analysis
Potential continuation of the bullish trend
🗓 W1 — Weekly Timeframe
🔹 XRP is currently within a potential 5th wave of the broader uptrend
🔹 A down fractal has formed — a key signal indicating a possible end of correction
🔹 If the bullish structure continues to develop:
🎯 Long-term target (W1): $4.36
📉 D1 — Daily Timeframe
🔹 The correction appears to have completed as an ABC structure
🔹 Price broke above the trendline and is now retesting it
🔹 This retest could serve as the launch point for a new impulse upward
🎯 Potential extended target: $5.13
⌛ H4 — 4H Timeframe
🔹 Price is moving within a descending corrective channel
🔹 For confirmation of bullish continuation, we need a breakout above the channel
🔹 Ideal entry scenario: formation of a 3rd wave to the upside
🎯 Local targets:
▫️ $3.43
▫️ $3.55
⚠️ If price falls back inside the channel — the idea is invalidated.
Stop-loss should be placed below recent key lows.
🎯 Trade Setup:
#XRPUSDT #BUY
Entry: 3.3105
Take Profits (TP):
▫️ 3.4383
▫️ 3.5556
▫️ 3.8311
▫️ 4.2406
Stop Loss: 3.0897
‼️ Total risk should not exceed 1–3% of your portfolio
This signal/idea is not investment advice
