Next Volatility Period: Around December 23rd
Hello? Hello, traders.
If you "Follow" us, you'll always get the latest information quickly.
Have a great day.
-------------------------------------
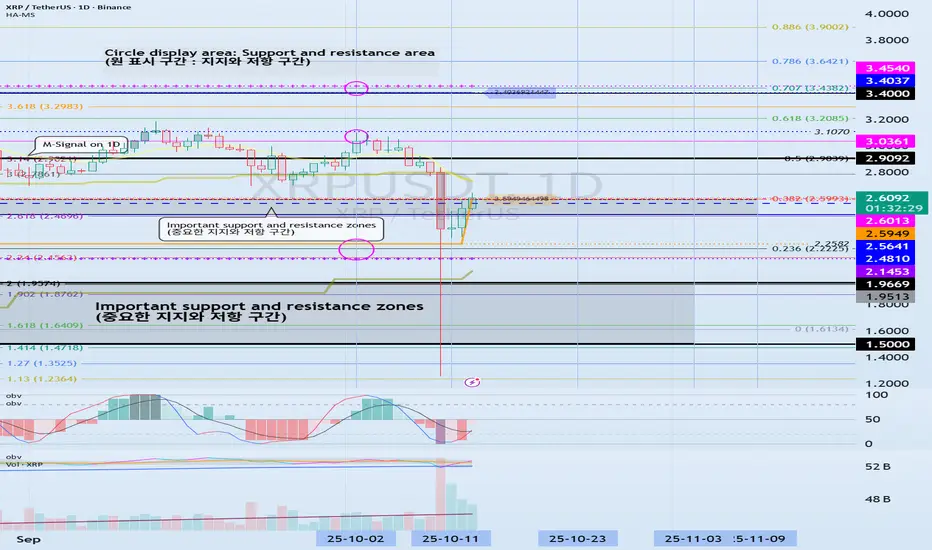
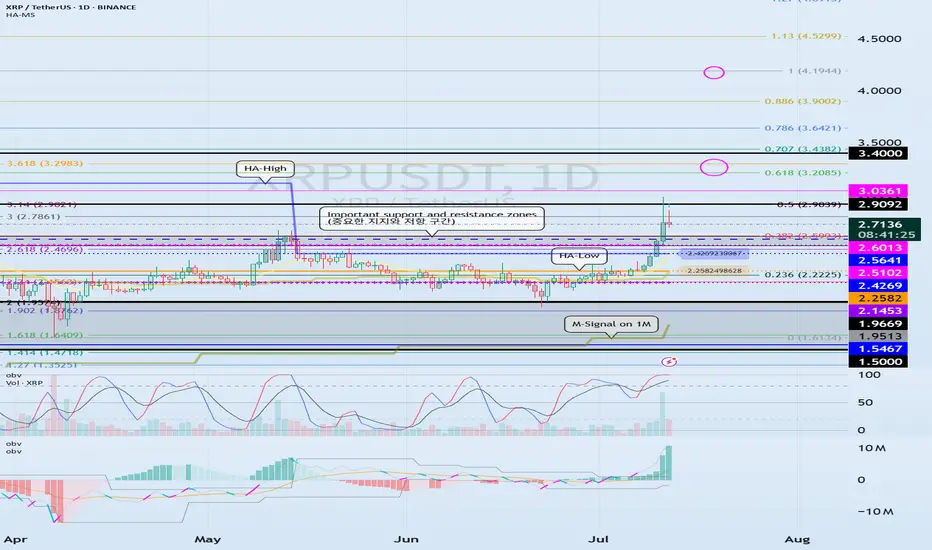
(XRPUSDT 1D Chart)
I believe the expected uptrend will continue when the price rises above 2.4810-2.6013.
Therefore, the final buy zone is the 2.4810-2.6013 zone.
If the price falls below the 1.5-19669 zone, a long-term downtrend should be considered.
Therefore, if support is found around the 1.5-19669 zone, it would be a good time to buy from a long-term perspective.
As it's difficult to determine the support level on a 1D chart alone, the StochRSI 80 and 20 indicators on the 1M chart are marked.
Therefore, the 1.8209-1.9575 range should be considered the support level for a continued uptrend.
If the price rises above the OBV High indicator and holds, further upside is likely.
However, it must break above the M-Signal indicator on the 1W chart.
-
Thank you for reading.
We wish you successful trading.
--------------------------------------------------
XRPUSDTPERP

$XRP/USDT ANALYSISOn the 3-day chart, **XRP/USDT** is trading inside a broad descending triangle structure, with a clear pattern of lower highs meeting a flat demand base around the **$2.00–$2.10** zone. Price has repeatedly tested this green support area, showing strong buyer defense but also declining momentum as each rebound becomes weaker. The **trendline from the previous top near $3.20** continues to cap all recovery attempts, acting as dynamic resistance.
Currently, the candle is hovering near **$2.17**, just above the main demand region, while the EMA-9 is trending downward, signaling short-term bearish pressure. However, as long as the structure holds above **$2.00**, bulls still have a chance to stage a rebound toward **$2.28–$2.40**, which is the next resistance area aligned with the descending trendline and cloud rejection zone. A clean daily close below **$2.00** would invalidate the support and likely open room toward **$1.80–$1.70**, but a confirmed breakout above the trendline could trigger a reversal pattern toward **$2.80–$3.00**.
In short, XRP remains at a critical decision point—holding the demand zone shows accumulation, while rejection from the descending resistance continues to suppress upside momentum.

XRP Breakdown Risk: Triangle + Resistance = DropXRP( BINANCE:XRPUSDT ) is moving within a resistance zone($2.32-$2.19) and has shown notable reactions to the resistance line and the Potential Reversal Zone(PRZ) .
From a technical analysis perspective, it seems that XRP has formed a Symmetrical Triangle Pattern. If the lower line of this pattern is broken, it would align with our analysis.
Additionally, from an Elliott Wave theory standpoint, we expect the next corrective wave for XRP, and a break of that lower triangle line would confirm this expectation.
I expect that in the upcoming hours, XRP will begin a downward trend and test the support zone($2.16-$2.11). If it breaks through that support, we can expect further declines toward the next support zone($2.04-$2.00) and Cumulative Long Liquidation Leverage($2.04-$2.02).
First Target: $2.133
Second Target: $2.069
Third Target: $2.043
Stop Loss(SL): $2.330
Cumulative Short Liquidation Leverage: $2.30-$2.25
Cumulative Long Liquidation Leverage: $2.16-$2.13
💡 Please respect each other's opinions and express agreement or disagreement politely.
📌 XRP Analyze (XRPUSDT), 1-hour time frame.
🛑 Always set a Stop Loss(SL) for every position you open.
✅ This is just my idea; I’d love to see your thoughts too!
🔥 If you find it helpful, please BOOST this post and share it with your friends.

XRP/USDT — Reversal Incoming or Deeper Breakdown?XRP is now standing at a make-or-break point. After weeks of movement inside a well-defined descending channel, price is once again testing the critical support zone at 2.32–2.17 — the level that has repeatedly acted as the last line of defense for the bulls.
This zone has held multiple times, yet each bounce has been capped by the upper boundary of the channel — forming a classic corrective structure where bearish momentum gradually weakens, preparing for a potential breakout phase.
---
📊 Pattern & Technical Structure
The chart reveals a descending channel pattern, typically signaling a corrective or consolidation phase within a broader market cycle.
Lower boundary of the channel → potential accumulation area and source of rebound.
Midline → dynamic resistance that has repeatedly rejected upward attempts.
Support box 2.32–2.17 → the decision zone, where bulls and bears will soon reveal the next major trend.
Failure to hold this level could trigger another leg down, while a strong defense here could mark the beginning of a larger trend reversal.
---
🚀 Bullish Scenario
A bullish breakout setup will be confirmed if:
1. Price closes above the descending channel with strong daily momentum.
2. The breakout is followed by a successful retest of 2.75 as a new support.
3. Upside targets then lie at 3.09 – 3.32 – 3.56 – 3.66, representing potential wave extensions.
If validated, this move could trigger a powerful recovery rally and possibly signal a major bullish reversal on the higher timeframes.
---
🔻 Bearish Scenario
On the flip side, if the 2.17 support fails to hold and a daily close occurs below this zone, then:
Price could continue sliding toward the lower boundary of the channel (1.95–1.80),
Extending the correction phase,
And potentially forming a lower-low structure in continuation of the broader downtrend.
This would confirm a sustained bearish control in the medium term.
---
📍 Conclusion
XRP is at the edge of compression, where the next decisive move will define its next big trend.
This descending channel may soon reveal whether it’s a bear trap before a breakout, or the start of another downward leg.
The reaction at the 2.32–2.17 zone will decide everything — this is the battlefield between reversal and breakdown.
Watch for daily closes, volume confirmation, and price behavior around the upper boundary of the channel.
Smart traders know — the calm before the breakout is where the biggest opportunities are born.
---
#XRP #XRPUSDT #Ripple #CryptoAnalysis #TechnicalAnalysis #DescendingChannel #PriceAction #SupportResistance #CryptoBreakout #SwingTrade #ChartPattern

Next volatility period: Around November 26
Hello, traders!
Follow me to get the latest information quickly.
Have a great day!
-------------------------------------
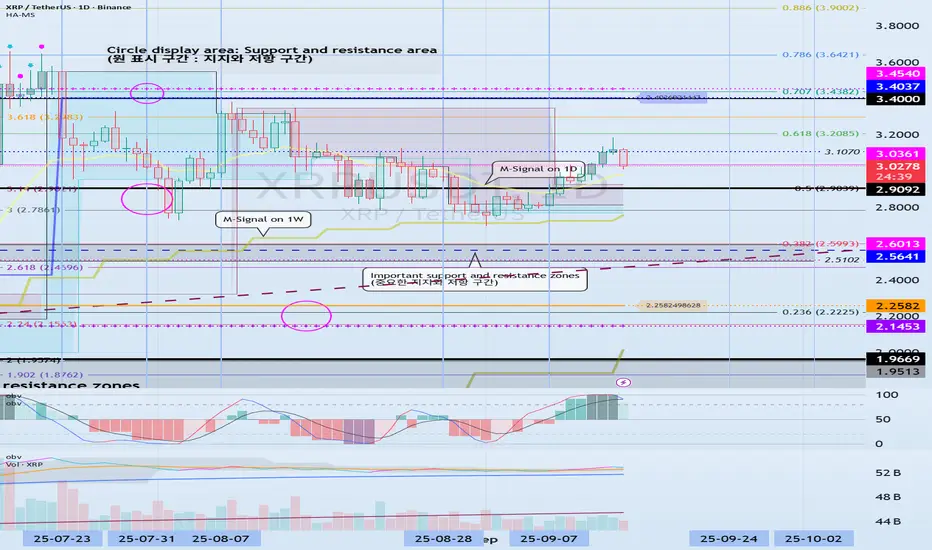
(XRPUSDT 1D chart)
Currently, the M-Signal on the 1W chart > Price > M-Signal on the 1D chart > M-Signal on the 1M chart.
Additionally, it is attempting to break above the StochRSI 80 indicator.
Therefore, if it finds support near the StochRSI 80 indicator and rises, it is highly likely to enter an uptrend.
The resistance zone is around 3.4037-3.4540, which is the HA-High ~ DOM (60) range.
The above is an interpretation based solely on the 1D chart.
-
The chart above displays support and resistance points drawn on the 1M, 1W, and 1D charts.
This indicates that support and resistance have formed in the 2.9092-3.0361 range.
Therefore, we have identified a zone where we can execute a two-stage sell-off.
This confirmation will be crucial for maintaining a stable psychological state amidst price volatility.
If the price falls to the 1.5-1.9669 range, which is the most important level for maintaining an uptrend, you should watch for an explosive increase in trading volume.
If it shows support, it indicates a buying opportunity.
-
Thank you for reading to the end.
I wish you successful trading.
--------------------------------------------------

Next volatility period: Around October 23rd (October 22nd-24th)
Hello, traders!
By "Following," you can always get the latest information quickly.
Have a nice day today.
-------------------------------------
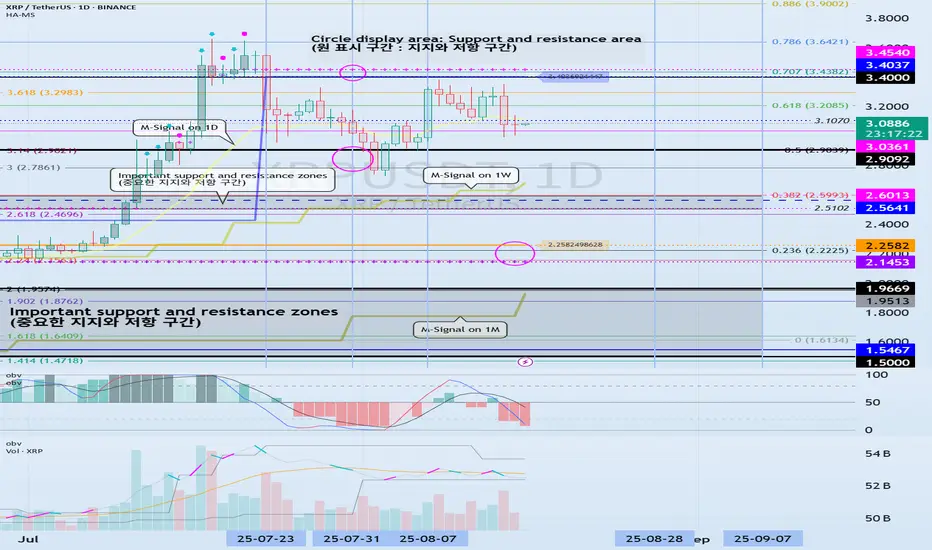
(XRPUSDT 1D Chart)
After this period of volatility, the HA-Low indicator on the 1D chart is forming at the 2.5949 level.
Therefore, if the HA-Low indicator forms at the 2.5949 level, it will be important to determine whether support is found near that level.
Furthermore, the HA-High indicator on the 1M chart is forming at the 2.4810 level.
Therefore, the key question is whether the price can find support and rise near the important support and resistance levels of the left Fibonacci ratio (2.618 (2.4696)) and the right Fibonacci ratio (0.382 (2.5993)).
However, to continue the step-up trend, the price must rise above 3.4037-3.4540 and hold, so you should also consider a countermeasure.
-
The basic trading strategy is to buy in the DOM(-60) ~ HA-Low range and sell in the HA-High ~ DOM(60) range.
However, if the price rises in the HA-High ~ DOM(60) range, a step-up trend is likely, while if the price falls in the DOM(-60) ~ HA-Low range, a step-down trend is likely.
Therefore, the basic trading strategy should be a segmented trading strategy.
Currently, the HA-Low indicator is showing signs of forming, so if support is confirmed near the HA-Low indicator, it would be a good time to buy.
From a medium- to long-term perspective, if the price holds above the 1.5-1.9669 range, the upward trend is likely to continue.
-
Thank you for reading to the end. I wish you successful trading.
--------------------------------------------------
The key is whether it can rise above 3.0361
Hello, fellow traders.
Follow us to get the latest information quickly.
Have a great day.
-------------------------------------
(XRPUSDT 1D chart)
The key is whether it can rise above 3.0361 and sustain the price after the next period of volatility, around October 2nd.
This period of volatility is expected to continue until September 25th, and we should examine whether support can be found around 2.9092 and whether it can rise.
-
If the price falls below the M-Signal indicator on the 1W chart,
1st: 2.5102-2.6013
2nd: 2.1453-2.2582
We should check for support near the 1st and 2nd levels above.
-
If the price remains above the M-Signal indicator on the 1D chart, further upside is highly likely, so it's important to determine whether support can be found near 3.0361.
The best time to buy was when support was found at key support and resistance levels, or around the 2.1453-2.2582 range.
Currently, a new buy is possible when support is found near 3.0361.
However, since this does not fit the basic trading strategy, a quick and rapid response is required.
-
The basic trading strategy is to buy in the DOM(-60) ~ HA-Low range and sell in the HA-High ~ DOM(60) range.
However, if the HA-High ~ DOM(60) range rises, a step-up trend is likely, while if the DOM(-60) ~ HA-Low range falls, a step-down trend is likely.
Therefore, the basic trading strategy should be a segmented trading approach.
-
The HA-High ~ DOM(60) range on the 1D chart is currently 3.4037-3.4540.
Therefore, a rise to around 3.4037 is possible.
However, since the DOM(60) point on the 1M chart is formed at 3.0361, if the price rises above 3.0361 and maintains, a long-term step-up trend is likely.
Therefore, the current buying opportunity should be when support is confirmed around 3.0361.
-
(1W chart)
To rise above 3.0361 and maintain support, the upward trend should continue.
- The StochRSI indicator should be trending upward. Ideally, it should not enter the overbought zone.
- The On-By-Value (OBV) indicator should be trending upward. Ideally, it should remain above the High Line.
- The TC (Trend Check) indicator should be trending upward. Ideally, it should remain above the zero level.
If the above conditions are met, the upward trend is expected to continue.
-
Thank you for reading.
We wish you successful trading.
--------------------------------------------------

Check for support around 3.0361
Hello, fellow traders!
If you "Follow" me, you'll always get the latest information quickly. Have a great day today.
-------------------------------------
(XRPUSDT 1D chart)
The next volatility period is around September 24th.
However, we should closely monitor the movements around September 18th, which is also the volatile period for BTC.
The key is whether it can find support near 3.0361 and rise above 3.4037.
If not, we should check for support near 2.9092.
The 3.0361 level is the DOM (60) indicator point on the 1M chart. If it finds support near this level and rises, it could potentially lead to a long-term, step-like uptrend.
However, since the HA-High ~ DOM (60) range on the 1D chart is currently formed in the 3.4037-3.4540 range, a breakout above this range is expected to initiate a stepwise uptrend.
-
Thank you for reading to the end.
I wish you successful trading.
--------------------------------------------------
- Here's an explanation of the big picture.
(3-year bull market, 1-year bear market pattern)
I will provide more details when the bear market begins.
------------------------------------------------------
XRP Ready for a Bullish Rally?XRP is breaking out of a descending wedge structure on the daily chart after weeks of consolidation. Price is reclaiming moving averages (50 EMA & 100 EMA), showing renewed bullish momentum.
✏️ Entry Zone: ~$3.05
✏️ Target (TP): $5.00 (major resistance from previous high)
✏️ Stop-Loss (SL): ~$2.70(below support / invalidation level)
✏️ Risk/Reward Ratio: 1:6
Key Points
- Daily structure shows a series of higher lows holding strong.
- Breakout accompanied by volume confirmation suggests buyers stepping in.
- If price sustains above the breakout trendline, momentum could extend toward $5+.
- Losing $2.70 support would invalidate the bullish setup.
Cheers
Hexa

From Sideways to Skyward: XRP Setting Up Another BoomXRP has been following a simple pattern, accumulate, then boom. We saw this play out earlier where months of sideways action led to a sharp rally.
Right now, the weekly chart is showing a similar setup. Price is consolidating again inside a tight range, holding steady in the current zone. This looks like healthy accumulation before the next move.
If history repeats, a breakout from this consolidation could trigger another explosive leg upward, potentially sending XRP much higher. As long as it stays above the accumulation box, the bias remains bullish.
DYOR, NFA
Next updates coming soon!

Check if the price can hold above 2.9092
Hello, traders.
If you "Follow" us, you'll always get the latest information quickly.
Have a great day.
-------------------------------------
(XRPUSDT 1D Chart)
If the price falls below the 1.5-1.9669 range, a major downtrend is likely to begin.
To maintain the uptrend, the price must hold above the 2.5102-2.6013 range.
If the price falls below the M-Signal on the 1D chart, it is highly likely to meet the M-Signal indicator on the 1W chart.
In that sense, we should check for support around the previous all-time high (ATH) area of 2.9092.
The next period of volatility is around August 28th.
However, since BTC's volatility period is around August 24th, you should closely monitor its movements from around that time.
-
(1M Chart)
While it's virtually impossible to predict the price as it's currently hitting a new all-time high (ATH), the area marked by a circle could potentially become a resistance zone.
The key is whether the price can maintain its upward momentum above the Fibonacci range of 0.618 (3.2085) on the right and 3.618 (3.2983) on the left.
The Fibonacci range on the left was drawn during the first wave.
-
Thank you for reading.
I wish you successful trading.
--------------------------------------------------
- This is an explanation of the big picture.
(3-year bull market, 1-year bear market pattern)
I will explain in more detail when the bear market begins.
------------------------------------------------------
XRPUSDT TRADE SETUP.XRPUSDT 1H — Price broke structure, creating OB + FVG confluence as a POI below current level. Watching for retracement into zone near SSL for a potential long setup.

Bullish on XRPCurrently all eyes are on ETH, but XRP is doing the same thing. Its ultra strong (at least as strong as ETH), bullish on all timeframes, trading above major EMAs. Showed off a 10% growth since the EMA crossover. Now let it cool down a little bit and wait for a entry around 3.20$. From there we may catch the next leg up 3.90$.
For more trade ideas check and insights check our profile.
Disclamer: only entertaining purpose, no financial advice - trading is risky.

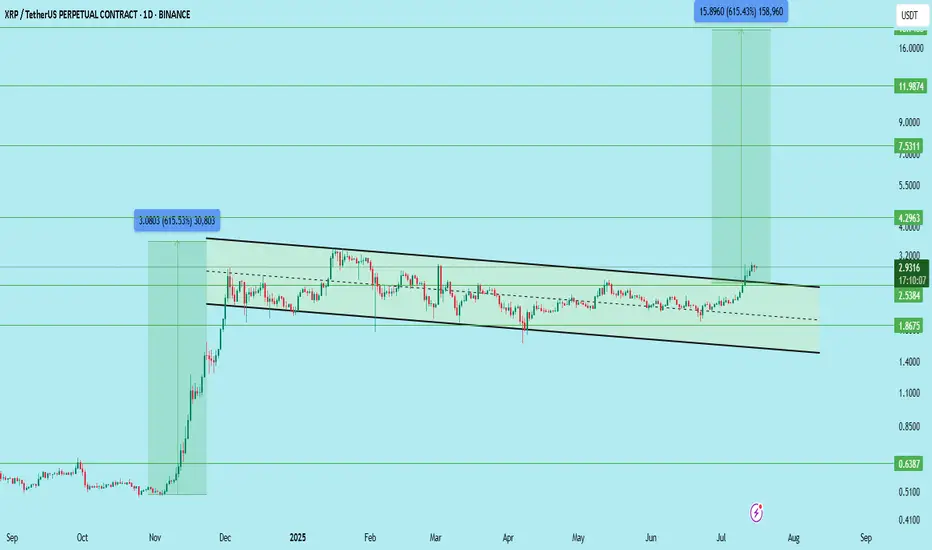
$XRPUSDT LONG TERM SETUP for SPOT !!CRYPTOCAP:XRP has officially broken out of its long-standing descending channel on the daily timeframe.
This is a major structure breakout and opens the door for a big move, but patience is key. Wait for a clean retest before entering the trade.
Trade Setup:
Entry (Ideal Retest Zone): $2.53 – $2.75
Stop Loss: Below $2.38
Resistance/Support Zones:
Immediate Support: $2.53
Resistance Levels: $4.29 / $7.53 / $11.98 / $18.00
Targets (Long-Term):
TP1: $4.29
TP2: $7.53
TP3: $11.98
TP4: $18.00
Potential Profit: Over 500%+ if it plays out fully
This is a long-term breakout structure — don’t rush. Wait for confirmation on the pullback.
DYOR | Not Financial Advice
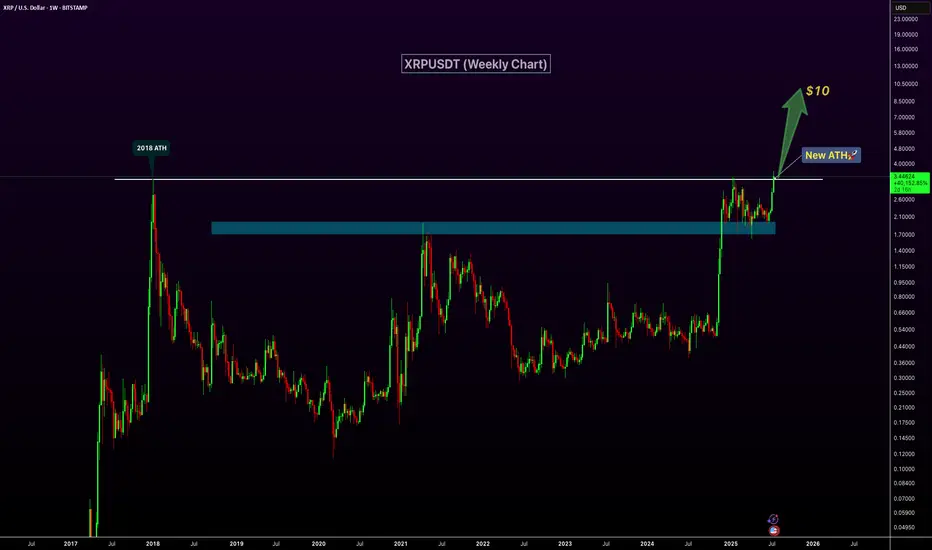
XRP Breaks 2018 High – New ATH Confirmed!XRP has officially broken above its 2018 peak, signaling a major bullish breakout and printing a new all-time high on the weekly chart. The previous resistance zone around $2.6–$3 has now flipped into strong support, confirming the strength of this move. With increasing volume and momentum behind the rally, XRP appears well-positioned for continued upside. The next key psychological target lies at $10, and current price action suggests a clear path toward that level. If bullish sentiment continues, this breakout could mark the beginning of a significant new uptrend.
Check support above 2.5102-2.6013
Hello, traders.
If you "Follow", you can always get new information quickly.
Have a nice day today.
-------------------------------------
(XRPUSDT 1D chart)
It has broken through the important support and resistance zone.
Accordingly, the key is whether the price can be maintained above 2.5102-2.6013 and rise.
If the price is maintained above 2.5102-2.6013, it is possible that a stepwise rise will occur.
At this time,
1st: Right Fibonacci ratio 0.618(3.2085) ~ Left Fibonacci ratio 3.618(3.2983)
2nd: Right Fibonacci ratio 1(4.1944)
You need to check for support near the 1st and 2nd above.
The strong support area is 1.5-1.9669.
----------------------
The left Fibonacci ratio was drawn in the initial rising wave, and the right Fibonacci ratio was drawn in the recent rising wave.
Therefore, if the price rises above 3.618(3.2983) of the Fibonacci ratio drawn in the initial rising wave and maintains it, there is a high possibility of creating a new wave.
Since the Fibonacci ratio is a tool for analyzing the chart, it is not good to use this point as a support and resistance point.
Therefore, we need to check whether the DOM(60) indicator or the HA-High indicator is newly created and create a response strategy depending on whether there is support.
Currently, the DOM(60) indicator is formed at the 2.5102 point, and the HA-High indicator is formed at the 2.4269 point.
The basic trading strategy is to buy near the HA-Low indicator and sell near the HA-High indicator.
However, if it receives support in the HA-High ~ DOM(60) section and rises, it is likely to show a stepwise upward trend, and if it receives resistance in the DOM(-60) ~ HA-Low section and falls, it is likely to show a stepwise downward trend.
Therefore, trading begins by checking whether there is support in the DOM(-60) ~ HA-Low section and the HA-High ~ DOM(60) section.
-
Thank you for reading to the end.
I hope you have a successful transaction.
--------------------------------------------------
- Here is a description of the big picture.
(3-year bull market, 1-year bear market pattern)
I will explain more details when the bear market starts.
------------------------------------------------------
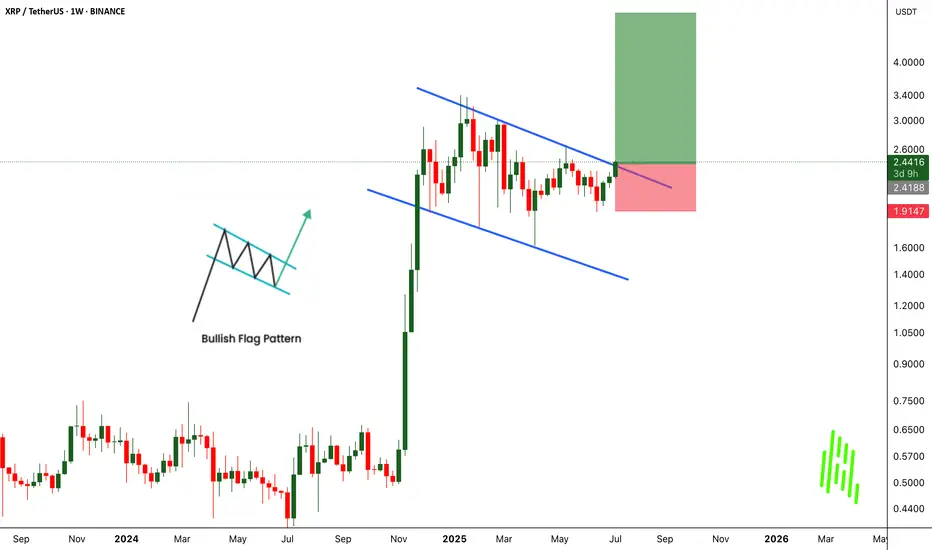
XRPUSDT Breaks Out of Bullish Flag - Big Moves Ahead!BINANCE:XRPUSDT has broken out of a classic bullish flag pattern on the weekly chart, signaling a strong continuation to the upside. This textbook setup is known for its high success rate, and the breakout suggests the potential for significant gains if momentum continues.
The CRYPTOCAP:XRP community remains strong, with long-term holders showing confidence and resilience. With the current market structure and support from loyal investors, there’s a real possibility for the price to double from this breakout zone.
The strategy is simple. Buy and hold for the long term. But as always, traders must manage risk carefully and use a proper stop loss. Let the flag fly high. CRYPTOCAP:XRP could be ready for a major pump from this level.
BINANCE:XRPUSDT Currently trading at $2.43
Buy level : Above $2.4
Stop loss : Below $1.9
Target : $5
Max leverage 3x
Always keep stop loss
Follow Our Tradingview Account for More Technical Analysis Updates, | Like, Share and Comment Your thoughts
XRPUSDT Forming Bullish BreakoutXRPUSDT is showing an interesting setup with a bullish breakout potential that could fuel gains of 60% to 70% or more in the coming weeks and months. The recent price action suggests that XRP is breaking out of a long-standing consolidation pattern, with price pushing above a descending trendline and holding well above key support levels. This breakout is attracting both retail traders and big investors who see Ripple’s strong fundamentals and unique use case in the cross-border payment sector as major catalysts for its long-term growth.
The trading volume has remained healthy, signaling strong market participation and increasing confidence that XRP’s next move could be substantial. If momentum continues, traders can expect a potential rally towards major resistance zones, with increased interest from whales likely to accelerate the bullish scenario. Market sentiment around XRP has also improved thanks to positive developments in its legal battles and expanding partnerships, which add further conviction for investors.
XRP’s performance has historically shown that when it moves, it often does so aggressively, rewarding patient holders and active traders alike. This pattern aligns well with broader altcoin market cycles, where XRP tends to outperform during bullish phases. As always, it’s essential to monitor price action around key levels, adjust stop-losses wisely, and stay updated with market news to make the most of this potential run.
✅ Show your support by hitting the like button and
✅ Leaving a comment below! (What is You opinion about this Coin)
Your feedback and engagement keep me inspired to share more insightful market analysis with you!

XRP 4H TIMEFRAME ANALYSISXRPUSDT strcuture shifted into bullish after CHoCH, Thats why I have marked OB+FVG as POI for long.

XRP/USDT Poised for Breakout from Symmetrical Triangle!Pattern Identified: Symmetrical Triangle
The symmetrical triangle is a consolidation pattern formed by a series of lower highs and higher lows, converging into a triangle shape. It reflects market indecision and often precedes a significant breakout, either upward or downward, depending on momentum and volume.
🔍 Pattern Description:
Upper Resistance Line (Descending): Connecting the lower highs since February 2025.
Lower Support Line (Ascending): Connecting the higher lows since December 2024.
Consolidation Zone: Price has been moving sideways within the triangle, indicating accumulation.
Critical Breakout Level: Around $2.23 — the price is currently testing this resistance.
📈 Bullish Scenario:
If the price successfully breaks above the upper triangle resistance with strong volume:
Target 1: $2.5855 (previous minor resistance)
Target 2: $2.9534 (key historical resistance)
Target 3: $3.2781
Maximum Target: $3.40 (local previous high and psychological level)
Breakout Confirmation: A daily candle close above $2.30 with significant volume could signal a long entry.
📉 Bearish Scenario:
If the price fails to break out and instead breaks down below the lower trendline:
Support 1: $2.00 (psychological & horizontal support)
Support 2: $1.85
Major Support: $1.55 (strong historical demand zone)
Breakdown Confirmation: A daily close below the lower triangle boundary with high volume would signal further downside.
📌 Summary:
XRP is nearing the apex of a symmetrical triangle — a major move is imminent.
A confirmed breakout could trigger a rally towards $3.40.
A breakdown may lead to a drop toward $1.55.
Recommendation: Wait for confirmation before entering long or short positions.
#XRP #XRPUSDT #CryptoBreakout #SymmetricalTriangle #XRPAnalysis #Altcoins #TradingView #TechnicalAnalysis #BullishCrypto #CryptoSignal

XRPUSDT Forming 2017-Style Flag — Major Breakout Loading! BINANCE:XRPUSDT is currently forming a classic bullish flag pattern, a setup that looks strikingly similar to what we saw back in 2017 before CRYPTOCAP:XRP went on a massive run. The price has been consolidating within a tight range, and this could be the calm before a powerful breakout.
Back in 2017, a similar flag formation led to a parabolic uptrend once the resistance was broken. While history doesn’t repeat exactly, this pattern suggests the potential for a significant upside move if the breakout confirms. Traders and investors should keep a close eye on this structure — a breakout from this flag could reignite bullish momentum and open the door for a sharp rally.
This is a buy and hold scenario for those who believe in XRP’s potential, but remember — risk management is key. Always use a stop loss below the flag support to protect your capital. Momentum could build quickly, so stay alert and watch for volume confirmation on the breakout.

#XRP/USDT#XRP
The price is moving within a descending channel on the 1-hour frame, adhering well to it, and is heading for a strong breakout and retest.
We are seeing a bounce from the lower boundary of the descending channel, which is support at 2.29.
We are seeing a downtrend on the RSI indicator that is about to break and retest, supporting the upward trend.
We are looking for stability above the 100 Moving Average.
Entry price: 2.30
First target: 2.33
Second target: 2.37
Third target: 2.42

#XRP/USDT#XRP
The price is moving in a descending channel on the 1-hour frame and is expected to continue upward.
We have a trend to stabilize above the 100 moving average once again.
We have a downtrend on the RSI indicator, which supports the upward move with a breakout.
We have a support area at the lower boundary of the channel at 2.25.
Entry price: 2.34
First target: 2.42
Second target: 2.47
Third target: 2.56
