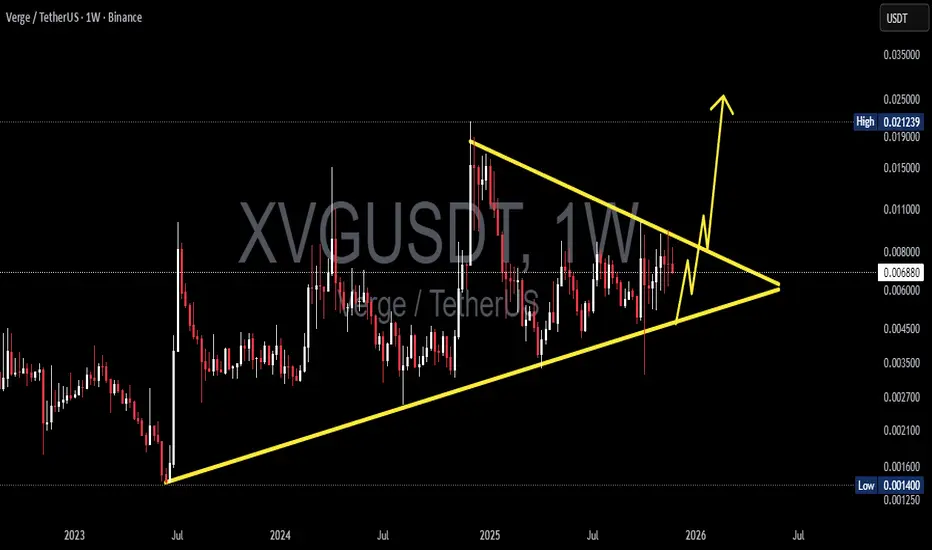
XVG/USDT — Symmetrical Triangle Nearing Breakout?XVG is approaching one of its most critical technical moments in the last two years. Price has been compressing inside a large Symmetrical Triangle since mid-2023, defined by:
1. Higher Lows showing steady accumulation from smart money, and
2. Lower Highs showing persistent supply pressure.
Both trendlines are now converging tightly into the Apex, creating a classic volatility squeeze — a condition where markets typically unleash a powerful breakout or breakdown once the compression phase is complete.
For XVG specifically, this setup is rare and historically tends to result in explosive volatility.
In short:
The next move could define XVG’s direction for months ahead.
---
Pattern Explanation
The Symmetrical Triangle on the Weekly chart signals a buildup of energy.
Shrinking volume + tightening candle range = compression before expansion.
This type of pattern often ends with a sharp directional move, not a gradual drift.
XVG rarely forms long-term triangles, making this squeeze even more significant.
This is a classic “calm before the storm” structure.
---
Bullish Scenario (If Breakout Occurs)
A bullish continuation will be confirmed if XVG closes a weekly candle above the upper trendline.
1. Bullish Trigger
Weekly close above 0.0075–0.0080
noticeable volume increase.
2. Follow-Through
A retest of the broken trendline turning into support strengthens the breakout.
3. Bullish Targets
Target 1: 0.011 – 0.015 → historical resistance
Target 2: 0.020 → psychological supply zone
Target 3 (Measured Move): 0.026 – 0.028
If fully realized, the upside potential ranges from +150% to +300%.
---
Bearish Scenario (If Breakdown Happens)
Weekly close below 0.0040–0.0045 triggers the bearish case.
1. Bearish Trigger
Breakdown + selling volume spike.
2. Bearish Targets
Target 1: 0.0030 → minor support
Target 2: 0.0014 → historical bottom
A breakdown would send XVG back into deep-discount territory, though so far the structure shows stronger bullish pressure via consistent higher lows.
---
Overall Summary
XVG is entering the final stage of a 2-year compression pattern. With almost no room left inside the triangle, the market is preparing for a decisive breakout or breakdown.
Historically, when XVG reaches this kind of pattern maturity, the move that follows tends to be fast, aggressive, and highly directional.
The next 1–2 weekly candles could shape the trend all the way into 2026.
#XVGUSDT #XVG #Verge #CryptoBreakout #TrianglePattern #VolatilitySqueeze #PriceAction #WeeklyChart #AltcoinAnalysis #CryptoTechnicalAnalysis
XVGUSDC
Is VERGE (XVG) on the 'verge' of a breakout?VERGE (XVG) is one of only nine ISO 20022 compliant cryptocurrencies and is by far the least well-known of the bunch. VERGE is also currently trading within a nice wedge pattern and seems to be forming what could become an inverted head and shoulders pattern on the 4-hour chart.
This could be a very good sign for VERGE currency!
Good luck, and always use a stop loss!

XVG / XVGUSDTGood Luck >>
• Warning •
Any deal I share does not mean that I am forcing you to enter into it, you enter in with your full risk, because I'll not gain any profits with you in the end.
The risk management of the position must comply with the stop loss.
(I am not sharing financial or investment advice, you should do your own research for your money.)

Verge fractal pattern in play.Life in itself is one fractal attached to a much larger fractal. Verge may be setting up for a possible repeat here. I spotted this pattern a month or so ago, but it appears that if this pattern does repeat the time of its ascension is getting close.

Still on the Verge...XVG - Verge Currency is setting up nicely for what could be a very big bounce. Watch Sept 22nd through the 23rd.
