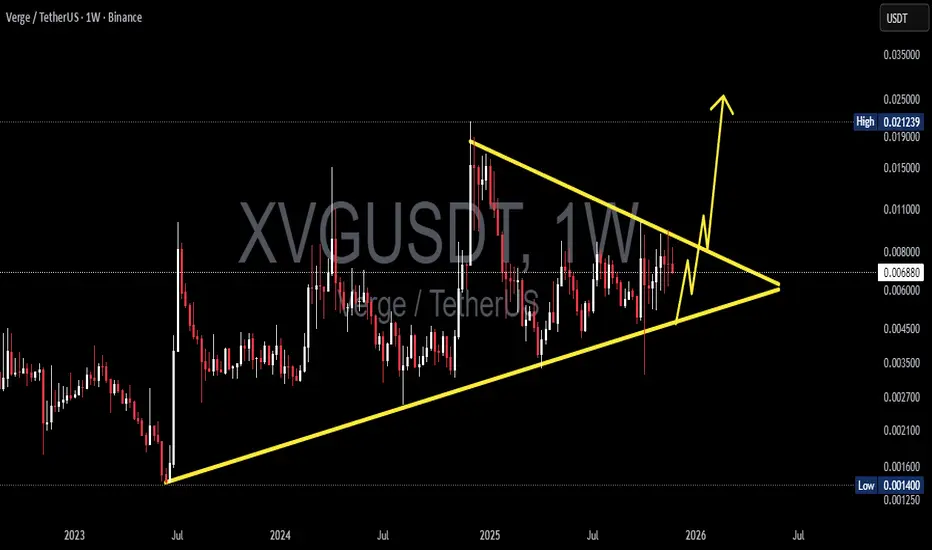
XVG/USDT — Symmetrical Triangle Nearing Breakout?XVG is approaching one of its most critical technical moments in the last two years. Price has been compressing inside a large Symmetrical Triangle since mid-2023, defined by:
1. Higher Lows showing steady accumulation from smart money, and
2. Lower Highs showing persistent supply pressure.
Both trendlines are now converging tightly into the Apex, creating a classic volatility squeeze — a condition where markets typically unleash a powerful breakout or breakdown once the compression phase is complete.
For XVG specifically, this setup is rare and historically tends to result in explosive volatility.
In short:
The next move could define XVG’s direction for months ahead.
---
Pattern Explanation
The Symmetrical Triangle on the Weekly chart signals a buildup of energy.
Shrinking volume + tightening candle range = compression before expansion.
This type of pattern often ends with a sharp directional move, not a gradual drift.
XVG rarely forms long-term triangles, making this squeeze even more significant.
This is a classic “calm before the storm” structure.
---
Bullish Scenario (If Breakout Occurs)
A bullish continuation will be confirmed if XVG closes a weekly candle above the upper trendline.
1. Bullish Trigger
Weekly close above 0.0075–0.0080
noticeable volume increase.
2. Follow-Through
A retest of the broken trendline turning into support strengthens the breakout.
3. Bullish Targets
Target 1: 0.011 – 0.015 → historical resistance
Target 2: 0.020 → psychological supply zone
Target 3 (Measured Move): 0.026 – 0.028
If fully realized, the upside potential ranges from +150% to +300%.
---
Bearish Scenario (If Breakdown Happens)
Weekly close below 0.0040–0.0045 triggers the bearish case.
1. Bearish Trigger
Breakdown + selling volume spike.
2. Bearish Targets
Target 1: 0.0030 → minor support
Target 2: 0.0014 → historical bottom
A breakdown would send XVG back into deep-discount territory, though so far the structure shows stronger bullish pressure via consistent higher lows.
---
Overall Summary
XVG is entering the final stage of a 2-year compression pattern. With almost no room left inside the triangle, the market is preparing for a decisive breakout or breakdown.
Historically, when XVG reaches this kind of pattern maturity, the move that follows tends to be fast, aggressive, and highly directional.
The next 1–2 weekly candles could shape the trend all the way into 2026.
#XVGUSDT #XVG #Verge #CryptoBreakout #TrianglePattern #VolatilitySqueeze #PriceAction #WeeklyChart #AltcoinAnalysis #CryptoTechnicalAnalysis
Xvgusdtsignal
XVG/USDT — Symmetrical Triangle at Apex: Breakout?Pattern & Overview
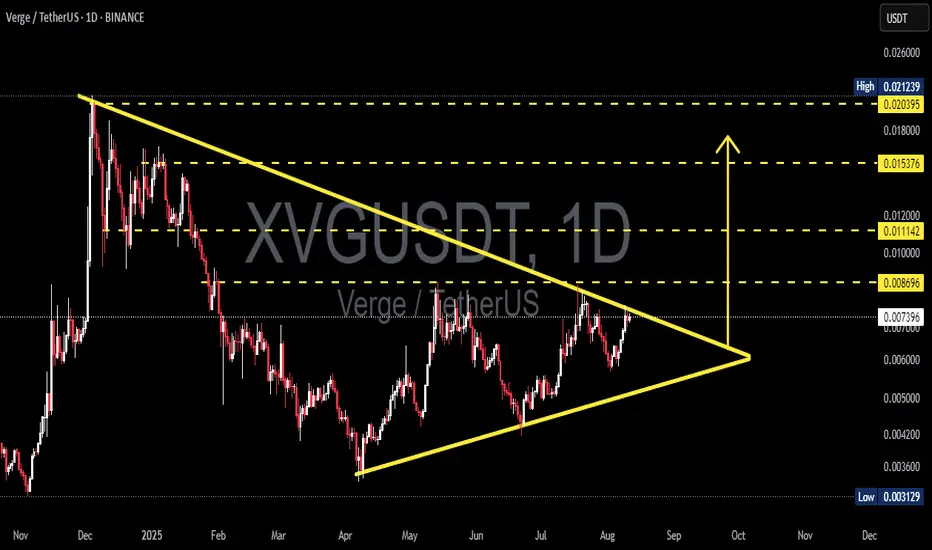
The XVG/USDT daily chart is forming a symmetrical triangle — descending resistance from the Dec 2024 high and ascending support from the April 2025 low. Price is now around 0.00743 USDT, nearing the apex, indicating reduced volatility and an increased chance of a sharp breakout soon.
Pattern characteristics:
Higher lows (rising support line) suggest accumulation.
Lower highs (descending resistance) indicate continued supply overhead.
Volume usually contracts within the pattern; a valid breakout is often confirmed by a volume spike.
---
Key Levels (marked on chart)
Resistances / potential upside targets: 0.008696 (immediate), 0.011142, 0.015376, 0.020395, up to ~0.02124 (high).
Critical supports / breakdown levels: ascending trendline (~0.005–0.0055 zone) and historical low at 0.00313.
---
Bullish Scenario (confirmation & targets)
Confirmation: daily close above the descending resistance + increased buy volume. Ideally, wait for a daily close above 0.0080–0.0087 (breakout zone) before adding positions.
Measured targets (from current ~0.007428):
Target 1: 0.008696 → +≈17.1%
Target 2: 0.011142 → +≈50.0%
Target 3: 0.015376 → +≈107.0%
Example trade plan:
Conservative entry: after daily close > 0.0087.
Conservative stop: below breakout retest / under 0.0066 → stop ≈ -11.15%; R:R to Target 1 ≈ 1.5:1, to Target 2 ≈ 4.5:1.
Aggressive entry: buy now (~0.00743), stop below ascending trendline (~0.0055) → stop ≈ -25.96%; R:R to Target 1 ≈ 0.66:1 (higher risk).
---
Bearish Scenario (confirmation & targets)
Confirmation: daily close below the ascending trendline (~0.005–0.0055 zone) with increased sell volume. If confirmed, price could drop toward:
First support: 0.0050 → ≈-32.7% from current price.
Strong support: 0.0042 → ≈-43.5%.
Worst-case retest of historical low: 0.00313 → ≈-57.9%.
Short/Cut-loss strategy: wait for a confirmed close below support, then enter on a pullback/retest with stop above the retest level.
---
Risk Management
Symmetrical triangles can have false breakouts — always wait for confirmation (daily close + volume).
Limit risk per trade (e.g., 1–2% of capital). Adjust position size based on stop distance.
Take profits in stages: e.g., 30–50% at first resistance, another 30% at second resistance, trail the rest.
Keep an eye on news, listings, or on-chain events — crypto reacts strongly to short-term fundamentals.
> XVG is forming a contracting symmetrical triangle on the daily chart. Higher lows vs. lower highs — price is approaching the apex.
Bullish: daily close above 0.0080–0.0087 with volume → targets 0.0087 / 0.0111 / 0.0154 (+17% / +50% / +107% approx).
Bearish: daily close below rising support (~0.005–0.0055) → possible drop to 0.005 / 0.0042 / 0.00313 (-26% to -58% approx).
Wait for confirmation, manage your risk, and scale out profits. 📉📈
#XVG #Verge #XVGUSDT #Crypto #TechnicalAnalysis #Triangle #Breakout #Altcoins #RiskManagement
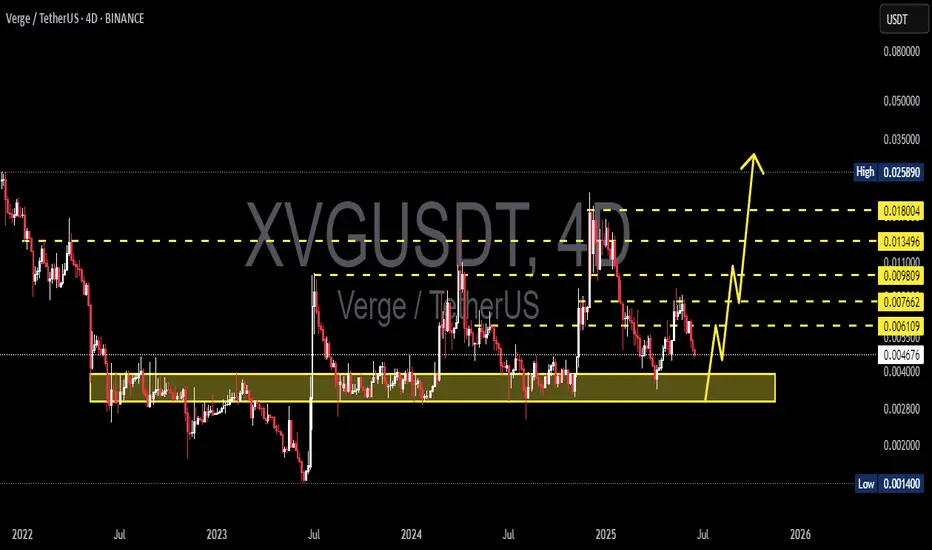
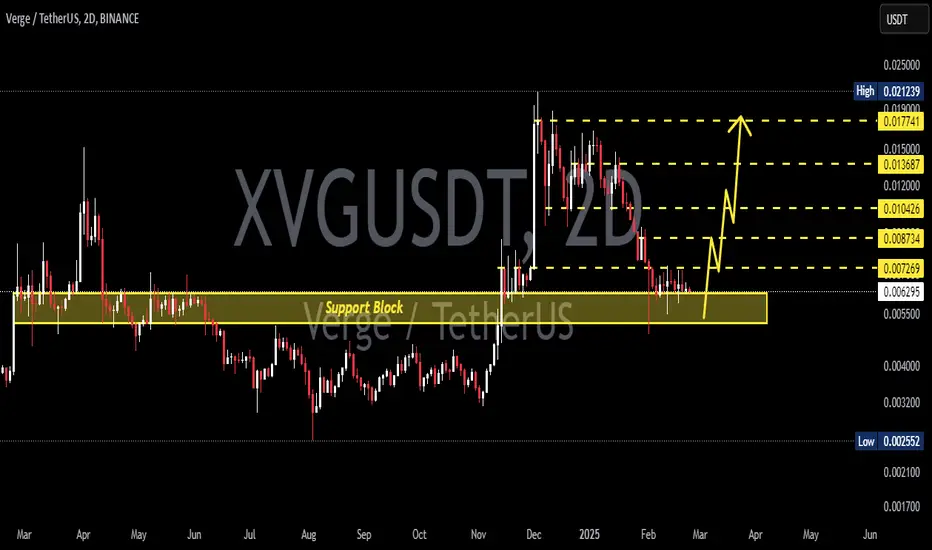
XVGUSDT 4D AnalysisXVG ~ 4D Analysis
#XVG Buy back on retest of this support block with short term target of at least 20%+ from this support.
XVG/USDT breakout alert
XVG/USDT breakout alert
XVG has successfully broken out of the symmetrical triangle pattern, indicating a potential bullish continuation. Symmetrical triangles often signal consolidation before a breakout, and in this case, the breakout is to the upside, which is typically a bullish sign.
As long as XVG holds above the breakout level and gains volume support, further upward movement can be expected. However, if the price falls back into the triangle range, it may turn out to be a fakeout, so caution is advised.
Key levels to watch:
* Breakout confirmation zone
* Previous resistance now acting as support
* Volume surge to confirm strength
Stay alert and watch the price action closely.

XVGUSDT 2DXVG ~ 2D Analysis
#XVG Buy gradually from here with a short -term target of at least 15%+. This is the previous accumulation area.
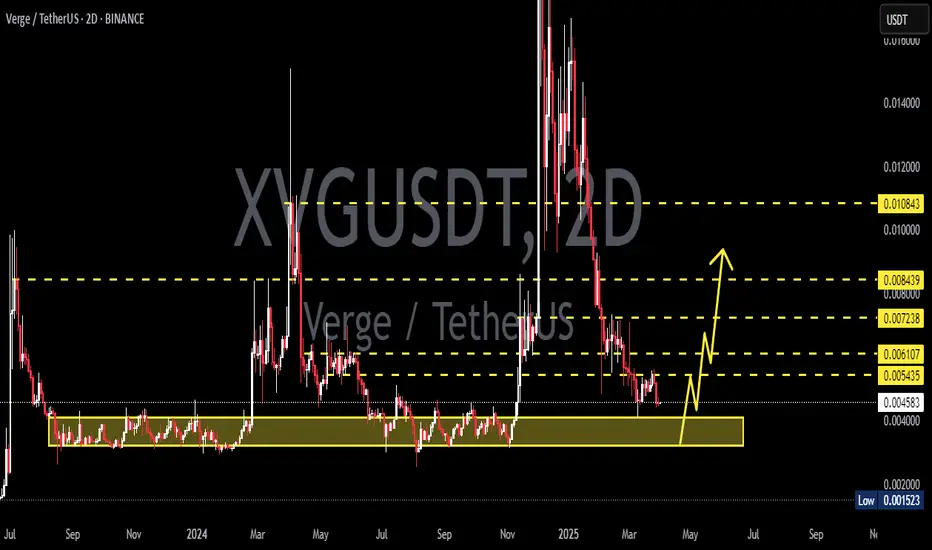
XVGUSDT 2DXVG ~ 2D Analysis
#XVG Support blocks that you might be able to consider to start buying back from here. with a minimum target of 15%+
XVGUSDT 1WXVG ~ 1W
#XVG So far it continues to maintain its bullish structure. Buy when retesting this Golden Ratio,. Minimum target 20%+

XVG / USDT : Preparing for a breakout Above trendline resistanceXVG/USDT: Preparing for a Breakout Above Trendline Resistance
XVG/USDT is gearing up for a potential breakout 📈 as it approaches a key trendline resistance zone 📊. The price has been consolidating tightly, creating a promising setup for an explosive move 💥. If the breakout materializes, we could witness a strong bullish trend emerge 🚀. Keep this pair on your radar 👀 and wait for confirmation before taking action.
Key Insights:
1. Trendline Resistance: XVG/USDT is nearing a long-standing trendline that has acted as a significant barrier. A break above this level could signal the start of a robust upward trend.
2. Volume Surge: Monitor trading volume closely; a notable increase during the breakout will confirm buyer strength 🔥.
3. Bullish Indicators: Momentum indicators like RSI and MACD are showing positive trends ⚡, supporting the case for a bullish breakout.
Steps to Confirm the Breakout:
Wait for a clear 4H or daily candle closing above the trendline 📍.
Look for a spike in trading volume during the breakout to validate strong buying pressure 📊.
A retest of the broken resistance as a new support zone will enhance the credibility of the move ✅.
Stay cautious of fake breakouts marked by sudden reversals or wicks above the trendline ⚠️.
Risk Management Strategies:
Use stop-loss orders to protect your capital effectively 🔒.
Ensure your position sizing aligns with your broader trading strategy 🎯.
This analysis is for educational purposes only and is not financial advice. Always conduct your own research (DYOR) 🔍 before making investment decisions.
