XVS/USDT – Major Demand Zone Test: Accumulation or Breakdown?On the Weekly timeframe, XVS remains in a macro bearish trend after a massive decline from its ATH around 147 USDT. The price structure continues to print lower highs and lower lows, confirming long-term bearish pressure.
Currently, price is reacting again at a very strong historical demand zone, which has acted as a key support multiple times since 2022.
The 3.8 – 2.8 USDT zone (yellow block) represents a multi-year major support area. Price behavior around this zone will be crucial in determining whether XVS forms a medium-term reversal base or continues its bearish continuation / capitulation phase.
---
Key Levels on the Chart
Major Demand / Strong Support:
3.8 – 2.8 USDT (yellow zone)
→ Historical institutional demand & accumulation area
Step-by-Step Resistance Levels (Supply Zones):
5.7 – 7.0 USDT (minor supply / range resistance)
12.0 USDT
17.3 USDT
38.5 USDT (major resistance / large distribution zone)
---
Pattern & Price Structure Explanation
Falling Structure (Macro Downtrend):
Price has been moving in a lower high – lower low structure since 2021.
Base Building / Potential Accumulation:
Inside the 3.8 – 2.8 USDT zone, volatility is contracting and selling pressure appears to be weakening — indicating a possible accumulation phase.
Range Compression:
Sideways price action after a prolonged downtrend often signals a transition phase before a major expansion.
At this stage, no strong bullish confirmation yet, but the current price location is highly strategic.
---
Bullish Scenario (Reversal / Relief Rally)
The bullish scenario becomes valid if:
Price holds above 3.8 USDT
Strong weekly rejection candles or bullish weekly closes appear
Price breaks and closes above 5.7 – 7.0 USDT
Bullish Targets:
1. 5.7 – 7.0 USDT (initial resistance / reversal confirmation)
2. 12.0 USDT
3. 17.3 USDT
4. 38.5 USDT (medium-term target / major supply zone)
➡️ As long as price remains above the yellow zone, risk-to-reward for medium-term longs remains attractive, but entries should be scaled and confirmation-based.
---
Bearish Scenario (Breakdown / Continuation)
The bearish scenario is confirmed if:
Price closes weekly below 2.8 USDT
The major demand zone fails to hold
Bearish Implications:
Continuation of the macro downtrend
Potential capitulation move
Very limited historical support below this zone
➡️ A breakdown below the yellow zone would signal invalidated multi-year demand and significantly increase downside risk.
---
Conclusion
XVS is currently trading at a critical structural decision zone.
The 3.8 – 2.8 USDT area is the last stronghold for buyers. Price reaction here will determine whether XVS can form a medium-term base for reversal or enter a deeper bear market phase.
Confirmation is key — not FOMO.
#XVS #XVSUSDT #CryptoAnalysis #TechnicalAnalysis #WeeklyChart #DemandZone #SupportResistance #Altcoin #BearMarket #PotentialReversal
XVSUSD

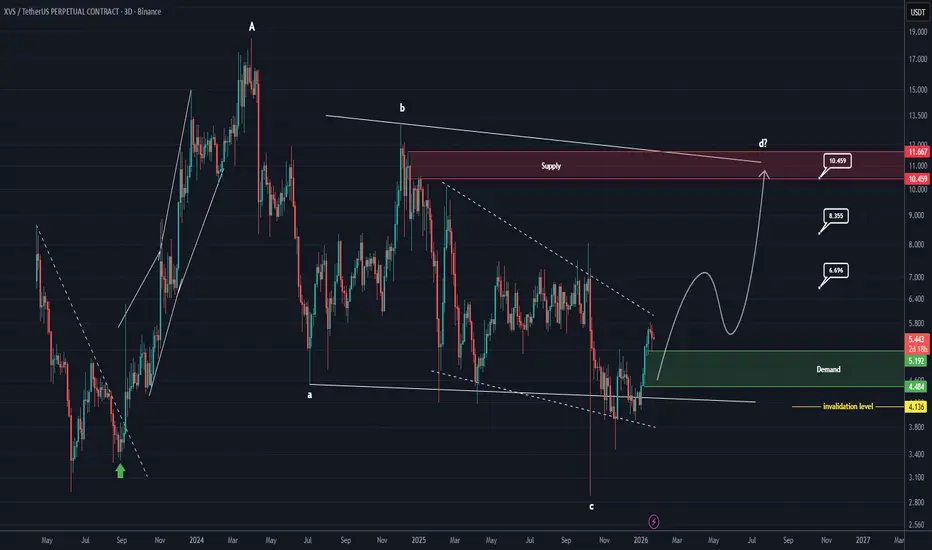
XVS Looks Bullish (3D)Before anything else, pay close attention to the timeframe.
This analysis is based on the 3D (3-Day) timeframe, which means it is time consuming by nature and absolutely not suitable for impatient trading. If you’re looking for fast moves or instant gratification, this setup is not for you. This is a position style analysis, where patience becomes an edge.
⚠️ Important Notice
This analysis is only suitable for spot positions, and strict risk and capital management is mandatory. Leveraged trading on this setup significantly increases risk and is not recommended.
Also keep in mind that XVS is a highly volatile and risky asset. Price movements can be sharp, emotional, and deceptive. This coin is known for shaking out weak hands before making its real move a classic playground for market psychology.
📐 Technical Structure & Market Psychology
From a structural perspective, XVS appears to be forming a triangle pattern, and we are currently approaching the end of Wave C.
This is a critical zone where fear is usually dominant. Late sellers often capitulate here, believing the market will continue lower, while smart money quietly prepares for accumulation.
This is where psychological games intensify:
Retail traders lose patience
Stops are hunted
Confidence disappears
Sentiment turns extremely bearish
Ironically, these conditions often create the best opportunities.
🟢 Green Zone – Where Psychology Shifts
The green highlighted area represents a high probability demand zone.
This is where strong buyers can step in, absorb sell pressure, and potentially launch price upward aggressively.
Markets don’t move up when everyone is confident
they move up when fear is high and selling pressure is exhausted.
That’s why DCA (Dollar Cost Averaging) inside the green zone is the preferred strategy. Instead of trying to catch the exact bottom (which is mostly ego driven), we let the market play its psychological games while we enter systematically and calmly.
📌 First target:
Partial profit should be secured at the first target. This is crucial not just financially, but psychologically. Locking in profit reduces emotional pressure and prevents impulsive decisions.
❌ Invalidation Rule (Non Negotiable)
If a weekly candle closes below the invalidation level,
this entire analysis becomes completely invalid.
No hope.
No bias.
No emotional attachment.
Professional traders don’t argue with the market
they respect invalidation and move on.
🧠 Final Thought
This setup is not about prediction
it’s about preparation.
Those who survive the psychological traps, manage risk properly, and remain patient are the ones who benefit when the crowd realizes they were wrong.
Trade smart.
Manage risk.
And never underestimate the psychological warfare of the market.
If you have a coin or altcoin you want analyzed, first hit the like button and then comment its name so I can review it for you.
This is not a trade setup, as it has no precise stop loss, stop, or target. I do not publish my trade setups here.
XVS/USDT at Major Downtrend Resistance – Breakout or Rejection?VENUS (XVS) on the 3D timeframe is still trading within a medium-to-long-term bearish structure, characterized by a clear sequence of lower highs and lower lows. However, a strong reaction from the 3.52 USDT low suggests early bullish interest, pushing price back toward the 5.7 USDT area. Price is now approaching a critical decision zone near the descending trendline.
---
Pattern & Technical Structure
Descending Trendline (Major Resistance)
The yellow diagonal line represents the primary downtrend resistance originating from the 12.8 USDT peak. This trendline has repeatedly capped bullish attempts.
Bearish Market Structure
Price remains below:
The major descending trendline
Historical supply zones between 7.0 – 8.9 USDT
Potential Trend Exhaustion
The strong bounce from the 3.52 USDT level indicates weakening selling pressure, though a confirmed trend reversal has not yet formed.
---
Key Levels & Important Zones
Resistance Levels (Supply Zones):
7.00 USDT (first key resistance)
8.05 – 8.50 USDT
8.90 USDT
10.30 – 10.90 USDT
11.80 USDT
12.80 USDT (major high)
Support Levels:
5.10 – 5.70 USDT (minor support & consolidation area)
4.50 USDT
3.52 USDT (major bottom / critical support)
---
Bullish Scenario
Price breaks and closes strongly above the descending trendline.
Successful break & retest of the 7.00 USDT level as new support.
Upside targets:
8.05 – 8.50 USDT
8.90 USDT
10.30 – 10.90 USDT
Strong confirmation occurs when market structure shifts into higher highs and higher lows on the 3D timeframe.
➡️ This bullish case represents a trend reversal scenario, valid only with clear breakout confirmation and volume support.
---
Bearish Scenario
Price fails to break the trendline and forms rejection or bearish price action.
Breakdown below 5.10 USDT.
Downside targets:
4.50 USDT
Retest of the 3.52 USDT low
A breakdown below 3.52 USDT would signal bearish continuation.
---
Conclusion
VENUS remains under dominant bearish control, but price is currently at a key decision area. A confirmed breakout above the descending trendline may trigger a medium-term trend reversal, while rejection would reinforce the ongoing bearish trend. Waiting for clear price action confirmation is highly recommended.
#XVS #VENUS #XVSUSDT #CryptoAnalysis #Altcoin #Downtrend #Trendline #SupportResistance #PriceAction #BearishMarket #PotentialReversal
#XVS/USDT – Accumulation Nearing Its End, Major Breakout?
#XVS
The price is moving within a descending channel on the hourly timeframe. It has reached the lower boundary and is heading towards a breakout, with a retest of the upper boundary expected.
The Relative Strength Index (RSI) is showing a downward trend, approaching the lower boundary, and an upward bounce is anticipated.
There is a key support zone in green at 0.0766. The price has bounced from this level several times and is expected to bounce again.
The indicator is showing a trend towards consolidation above the 100-period moving average, which we are approaching, supporting the upward move.
Entry Price: 0.0794
First Target: 0.0832
Second Target: 0.0876
Third Target: 0.0941
Stop Loss: Below the green support zone.
Don't forget one simple thing: Money Management.
For inquiries, please leave a comment.
Thank you.

#XVS/USDT – Accumulation Nearing Its End, Major Breakout?#XVS
The price is moving in a descending channel on the 1-hour timeframe. It has reached the lower boundary and is heading towards breaking above it, with a retest of the upper boundary expected.
We have a downtrend on the RSI indicator, which has reached near the lower boundary, and an upward rebound is expected.
There is a key support zone in green at 4.10. The price has bounced from this zone multiple times and is expected to bounce again.
We have a trend towards stability above the 100-period moving average, as we are moving close to it, which supports the upward movement.
Entry price: 4.20
First target: 4.27
Second target: 4.35
Third target: 4.43
Don't forget a simple principle: money management.
Place your stop-loss below the support zone in green.
For any questions, please leave a comment.
Thank you.

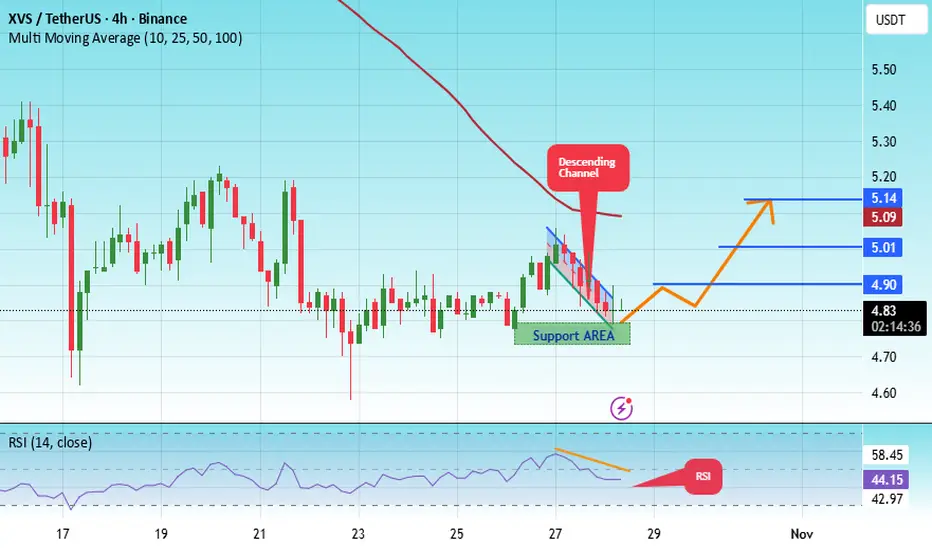
#XVS/USDT – Accumulation Nearing Its End, Major Breakout?#XVS
The price is moving in an ascending channel on the 1-hour frame, adhering well to it, and is heading for a strong breakout and retest.
We have a bearish trend on the RSI indicator that is about to be broken and retested, which supports the upward breakout.
There is a major support area in green at 4.77, representing a strong support point.
We are heading for consolidation above the 100 moving average.
Entry price: 4.80.
First target: 4.90.
Second target: 5.01.
Third target: 5.14.
Don't forget a simple matter: capital management.
When you reach the first target, save some money and then change your stop-loss order to an entry order.
For inquiries, please leave a comment.
Thank you.
XVS/USDT — Major Accumulation Zone or the Final Breakdown?XVS is once again standing at a critical historical zone between $4.00 and $3.00, a level that has defined market direction for more than three years.
Every touch on this area has led to either a major bullish reversal or a sharp continuation to the downside.
Recently, price printed a deep wick below the zone and quickly recovered — a classic sign of a liquidity grab, where smart money sweeps retail stop-losses before deciding the real direction.
From a technical perspective, XVS has been trading in a massive sideways range since 2022, with strong demand around 3–4 and multi-layer resistance levels above.
Every time this base has held, a strong rally followed — making this area one of the most decisive zones in XVS’s chart history.
---
Bullish Scenario
A weekly close above $4.50 would confirm that buyers are defending the zone, indicating potential accumulation by strong hands.
A follow-up breakout above $7.00 would shift the mid-term structure to bullish, confirming the start of a new upward phase.
Upside targets stand at $7.00 → $12.00 → $14.50 → $17.35, with a macro extension toward $38.50, the previous major supply zone.
Bullish narrative:
The 3–4 area may represent a final liquidity sweep before a new accumulation phase begins. If volume confirms, XVS could trigger a short-covering rally leading to sharp price recovery.
---
Bearish Scenario
A weekly close below $3.00 would invalidate the support zone and confirm a macro breakdown.
In that case, price could slide toward $1.70 – $1.16, the historical demand base from previous cycles.
Losing this zone could spark a capitulation phase, as major stop clusters are likely resting below it.
Bearish narrative:
Failure to defend the 3–4 range would mark the start of a deeper markdown phase — a potential final leg before a long-term bottom forms.
---
Pattern Overview
XVS is forming a macro horizontal accumulation structure since 2022.
The latest wick below the support zone indicates a possible shakeout event — an early hint of reversal if confirmed by higher closes.
Still, without confirmation above resistance levels, this remains a high-stakes battleground between bulls and bears.
---
The 3–4 zone isn’t just a number — it’s the defining line between recovery and collapse.
If the level holds, XVS could enter a powerful recovery phase toward mid-range resistance.
But if it breaks, the chart opens room for a capitulation wave toward historical lows.
The upcoming weekly closes will determine the next major chapter of this asset.
---
#XVS #XVSUSDT #Crypto #CryptoTrading #SupportZone #LiquiditySweep #SmartMoney #Accumulation #TechnicalAnalysis #Altcoins #RangeTrading #MarketStructure

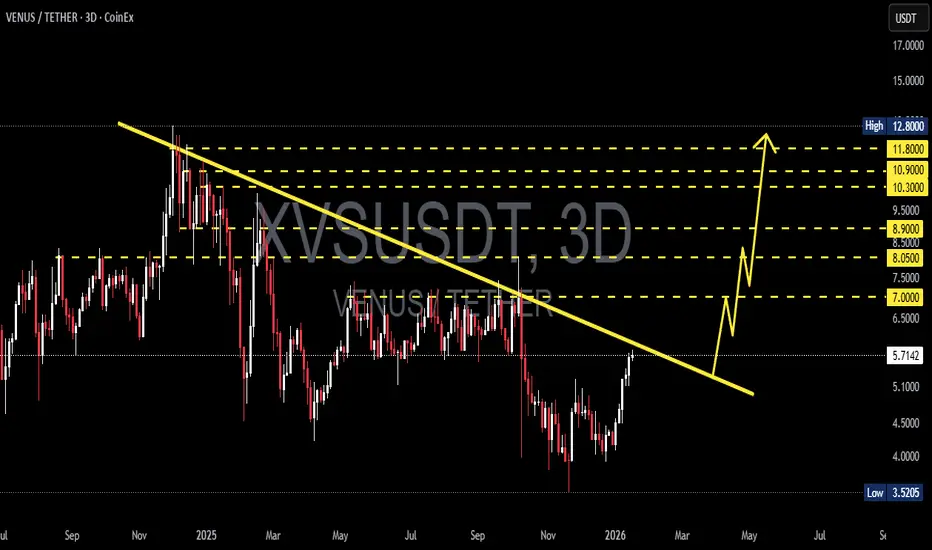
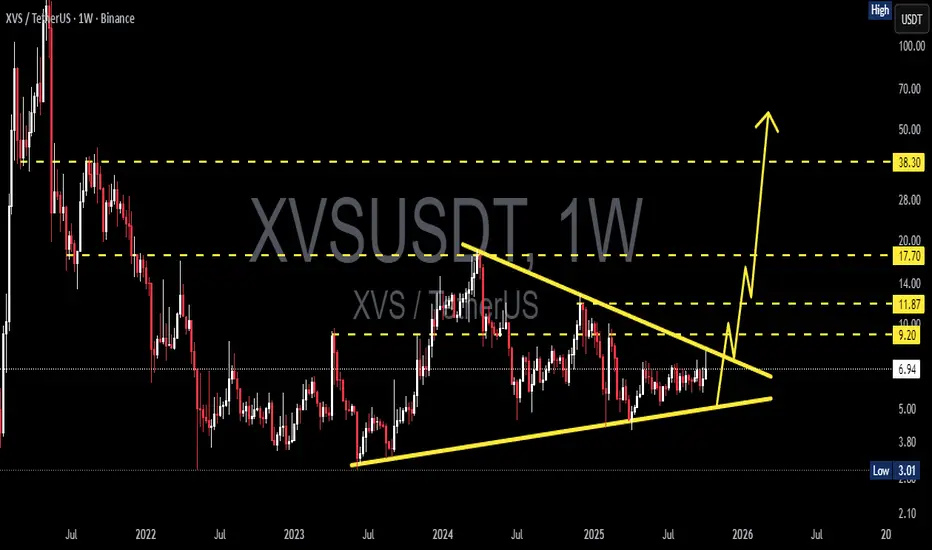
XVS/USDT – Accumulation Nearing Its End, Major Breakout?For over two years, XVS/USDT has been locked inside a massive multi-year accumulation phase, forming a clear Symmetrical Triangle pattern on the weekly timeframe.
Each move has been creating higher lows and lower highs, showing a tightening range and volatility compression — a classic setup before a major expansion phase begins.
Now, price action is once again testing the apex area of the triangle, suggesting that a decisive breakout is approaching.
This type of structure often precedes powerful reversals or trend continuations, depending on which direction the breakout confirms.
---
📈 Bullish Scenario
Breakout Confirmation: A weekly close above the descending trendline (around 7.0–9.2) with strong volume expansion.
Once confirmed, the medium-term targets are 11.87 → 17.70 → 21.60, with a possible extended rally toward 38.30 if broader market sentiment turns bullish.
The structure suggests that buyers have been quietly accumulating — and when this compression releases, momentum could accelerate quickly.
💡 Interesting Note: The longer a triangle forms, the stronger the breakout potential.
XVS has been building this base for over 100 weeks, indicating a significant amount of pent-up energy waiting to be released.
---
📉 Bearish Scenario
Failure to break above resistance followed by a weekly close below the rising trendline (~5.0) would shift momentum bearish.
Downside targets sit near 3.8 – 3.01, which represents the final historical demand zone.
A confirmed breakdown below 3.0 could invalidate the structure and potentially extend the downtrend further.
---
🔍 Pattern Analysis & Interpretation
Pattern Type: Symmetrical Triangle — a sign of prolonged accumulation and tightening market pressure.
Meaning: Such structures often mark a pivotal transition zone between accumulation and expansion.
Volume: Watch for a clear increase in trading volume during the breakout; without it, false breakouts are common.
---
🧭 Summary
XVS is entering a critical decision zone after years of sideways action.
A confirmed breakout above 9.2 could trigger the next major bullish cycle, while a breakdown below the lower boundary would confirm renewed weakness toward long-term support.
This is not just another consolidation — it’s a battle between accumulation and distribution, and its resolution could define XVS’s direction into 2026 and beyond.
---
#XVS #XVSUSDT #CryptoAnalysis #AltcoinBreakout #DeFi #TechnicalAnalysis #SymmetricalTriangle #CryptoChart #CryptoSetup #AccumulationPhase #CryptoMarket #BullishSetup
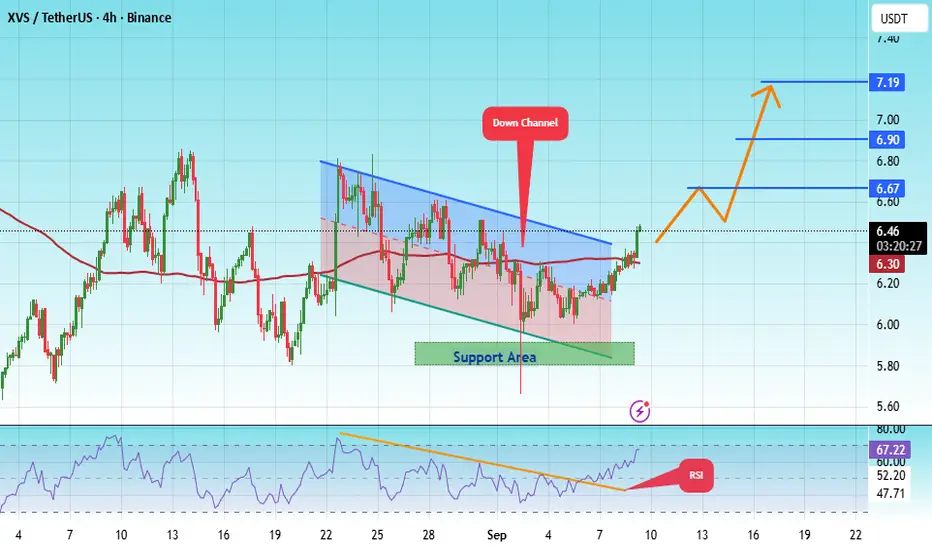
#XVS/USDT Go UP for 15% ?#XVS
The price is moving within a descending channel on the 4-hour frame, adhering well to it, and is heading for a strong breakout and retest.
We have a bearish trend on the RSI indicator that is about to be broken and retested, which supports the upward breakout.
There is a major support area in green at 5.86, representing a strong support point.
For inquiries, please leave a comment.
We are in a consolidation trend above the 100 Moving Average.
Entry price: 6.46
First target: 6.67
Second target: 6.90
Third target: 7.19
Don't forget a simple matter: capital management.
When you reach the first target, save some money and then change your stop-loss order to an entry order.
For inquiries, please leave a comment.
Thank you.
#XVS/USDT#XVS
The price is moving within a descending channel on the 1-hour frame, adhering well to it, and is heading for a strong breakout and retest.
We are seeing a bounce from the lower boundary of the descending channel, which is support at 5.75.
We are seeing a downtrend on the RSI indicator that is about to break and retest, supporting the upward trend.
We are looking for stability above the 100 Moving Average.
Entry price: 5.95
First target: 6.07
Second target: 6.25
Third target: 6.46

#XVS/USDT#XVS
The price is moving within a descending channel on the 1-hour frame, adhering well to it, and is heading for a strong breakout and retest.
We are experiencing a rebound from the lower boundary of the descending channel, which is support at 5.60.
We are experiencing a downtrend on the RSI indicator that is about to be broken and retested, supporting the upward trend.
We are looking for stability above the 100 Moving Average.
Entry price: 5.70
First target: 5.86
Second target: 6.03
Third target: 6.32

XVSUSDT – The Market is Talking… Are You Listening?Most traders lose because they react emotionally. Not us. We plan, we execute, we win. This is the difference between gambling and trading. If you're still guessing, you're already behind.
📌 Key Insights:
🔴 Red Box = Major Resistance Zone – This is where the market makers decide who wins and who loses. Do you want to be on the right side or the losing side?
📉 LTF Confirmations Are Everything – Without CDV alignment, volume profile support, and clear structural breaks, you are blind in the market. This is why 95% fail, and why we don’t.
🎯 Discipline Wins. Always. – No FOMO, no random entries. If resistance holds, we short with precision. If it breaks with volume and a clean retest, we go long.
💡 This is why you NEED to follow me. Most traders guess and hope—I show you the roadmap before it even happens. If you’re serious about winning, stop trading alone. Follow. Watch. Execute. Success leaves clues. I’m giving them to you.
✅I keep my charts clean and simple because I believe clarity leads to better decisions.
✅My approach is built on years of experience and a solid track record. I don’t claim to know it all but I’m confident in my ability to spot high-probability setups.
✅If you would like to learn how to use the heatmap, cumulative volume delta and volume footprint techniques that I use below to determine very accurate demand regions, you can send me a private message. I help anyone who wants it completely free of charge.
🔑I have a long list of my proven technique below:
🎯 ZENUSDT.P: Patience & Profitability | %230 Reaction from the Sniper Entry
🐶 DOGEUSDT.P: Next Move
🎨 RENDERUSDT.P: Opportunity of the Month
💎 ETHUSDT.P: Where to Retrace
🟢 BNBUSDT.P: Potential Surge
📊 BTC Dominance: Reaction Zone
🌊 WAVESUSDT.P: Demand Zone Potential
🟣 UNIUSDT.P: Long-Term Trade
🔵 XRPUSDT.P: Entry Zones
🔗 LINKUSDT.P: Follow The River
📈 BTCUSDT.P: Two Key Demand Zones
🟩 POLUSDT: Bullish Momentum
🌟 PENDLEUSDT.P: Where Opportunity Meets Precision
🔥 BTCUSDT.P: Liquidation of Highly Leveraged Longs
🌊 SOLUSDT.P: SOL's Dip - Your Opportunity
🐸 1000PEPEUSDT.P: Prime Bounce Zone Unlocked
🚀 ETHUSDT.P: Set to Explode - Don't Miss This Game Changer
🤖 IQUSDT: Smart Plan
⚡️ PONDUSDT: A Trade Not Taken Is Better Than a Losing One
💼 STMXUSDT: 2 Buying Areas
🐢 TURBOUSDT: Buy Zones and Buyer Presence
🌍 ICPUSDT.P: Massive Upside Potential | Check the Trade Update For Seeing Results
🟠 IDEXUSDT: Spot Buy Area | %26 Profit if You Trade with MSB
📌 USUALUSDT: Buyers Are Active + %70 Profit in Total
🌟 FORTHUSDT: Sniper Entry +%26 Reaction
🐳 QKCUSDT: Sniper Entry +%57 Reaction
📊 BTC.D: Retest of Key Area Highly Likely
📊 XNOUSDT %80 Reaction with a Simple Blue Box!
📊 BELUSDT Amazing %120 Reaction!
I stopped adding to the list because it's kinda tiring to add 5-10 charts in every move but you can check my profile and see that it goes on..

#XVS/USDT#XVS
The price is moving in a descending channel on the 1-hour frame and is expected to continue upwards
We have a trend to stabilize above the moving average 100 again
We have a descending trend on the RSI indicator that supports the rise by breaking it upwards
We have a support area at the lower limit of the channel at a price of 7.00
Entry price 7.31
First target 7.75
Second target 8.09
Third target 8.51

XVSUSDT | High PotentialThe blue boxes on the XVS chart represent strong demand zones, especially when analyzed on higher time frames (HTF).
While price may dip lower within these zones, they offer potential for quick reactions and short-term opportunities, making them ideal for scalping or intraday trades. For HTF traders, deeper entries can be targeted at lower levels for more substantial long positions.
Balancing between immediate reactions and a long-term perspective allows flexibility in capturing both short-term gains and larger moves within the broader trend.
Spot buys will be a safer choice here.
I keep my charts clean and simple because I believe clarity leads to better decisions.
My approach is built on years of experience and a solid track record. I don’t claim to know it all, but I’m confident in my ability to spot high-probability setups.
My Previous Analysis
🐶 DOGEUSDT.P: Next Move
🎨 RENDERUSDT.P: Opportunity of the Month
💎 ETHUSDT.P: Where to Retrace
🟢 BNBUSDT.P: Potential Surge
📊 BTC Dominance: Reaction Zone
🌊 WAVESUSDT.P: Demand Zone Potential
🟣 UNIUSDT.P: Long-Term Trade
🔵 XRPUSDT.P: Entry Zones
🔗 LINKUSDT.P: Follow The River
📈 BTCUSDT.P: Two Key Demand Zones
🟩 POLUSDT: Bullish Momentum
🌟 PENDLEUSDT: Where Opportunity Meets Precision
🔥 BTCUSDT.P: Liquidation of Highly Leveraged Longs
🌊 SOLUSDT.P: SOL's Dip - Your Opportunity
🐸 1000PEPEUSDT.P: Prime Bounce Zone Unlocked
🚀 ETHUSDT.P: Set to Explode - Don't Miss This Game Changer
🤖 IQUSDT: Smart Plan
⚡️ PONDUSDT: A Trade Not Taken Is Better Than a Losing One
💼 STMXUSDT: 2 Buying Areas

XVSUSDT: Eyeing a Breakout with Strong VolumeXVSUSDT is showing positive volume momentum and increasing buyer strength. The current price action is approaching a critical resistance level, and a breakout could pave the way for a significant move.
Key Levels to Watch:
Resistance Break: A confirmed break above the resistance may signal the start of a bullish trend.
Stop Level: My stop-loss is set at $11.1, ensuring risk management in case of a pullback.
Why XVS Stands Out:
The combination of rising volume and buyer power suggests strong accumulation, making XVS a promising candidate for a potential breakout.
Let’s see how this unfolds—patience and discipline remain key!
I keep my charts clean and simple because I believe clarity leads to better decisions.
My approach is built on years of experience and a solid track record. I don’t claim to know it all, but I’m confident in my ability to spot high-probability setups.
My Previous Analysis
🐶 DOGEUSDT.P: Next Move
🎨 RENDERUSDT.P: Opportunity of the Month
💎 ETHUSDT.P: Where to Retrace
🟢 BNBUSDT.P: Potential Surge
📊 BTC Dominance: Reaction Zone
🌊 WAVESUSDT.P: Demand Zone Potential
🟣 UNIUSDT.P: Long-Term Trade
🔵 XRPUSDT.P: Entry Zones
🔗 LINKUSDT.P: Follow The River
📈 BTCUSDT.P: Two Key Demand Zones
🟩 POLUSDT: Bullish Momentum
🌟 PENDLEUSDT: Where Opportunity Meets Precision
🔥 BTCUSDT.P: Liquidation of Highly Leveraged Longs
🌊 SOLUSDT.P: SOL's Dip - Your Opportunity
🐸 1000PEPEUSDT.P: Prime Bounce Zone Unlocked
🚀 ETHUSDT.P: Set to Explode - Don't Miss This Game Changer
🤖 IQUSDT: Smart Plan

#XVS/USDT#XVS
The price is moving in a downtrend on a 4-hour frame
After bouncing from a major support area in green at the $9 level
We have a tendency to stabilize above the Moving Average 100
We have a downtrend on the RSI that is about to break higher
Entry price is 9.30
First goal 10.43
Second goal 11.94
Third goal 13.38

Crack the code of XVS with XABCD!XVS Coin (Venus Coin) Chart Characteristics
Volatility:
XVS, like many other altcoins, exhibits high volatility, especially during periods of increased market activity or when Venus protocol-related updates are released.
Sharp price spikes and dips are common, making it an ideal candidate for pattern-based trading.
Trend Behavior:
XVS often moves in trends driven by broader market sentiment, such as Bitcoin price movements, or specific news related to DeFi and the Venus ecosystem.
It tends to form strong rallies during bullish cycles but can also experience steep corrections.
Volume Patterns:
Trading volumes can be irregular, often spiking during significant announcements or broader market rallies.
High volume during breakout points or pattern completions can confirm price movements.
Support and Resistance:
XVS charts often show well-defined support and resistance levels, which align with Fibonacci retracement or extension levels.
These levels play a crucial role in identifying potential XABCD patterns.
XABCD Pattern Characteristics
The XABCD pattern is a harmonic trading pattern used to identify potential reversal zones. It includes various specific patterns, such as Gartley, Bat, Butterfly, and Crab, each with unique Fibonacci ratios. Here’s a breakdown:
Structure:
The XABCD pattern consists of five points (X, A, B, C, D) that form four legs (XA, AB, BC, CD). These legs follow Fibonacci ratios to define the pattern.
Each variation (e.g., Gartley or Butterfly) has distinct Fibonacci retracements and extensions.
Key Elements:
XA: The initial move in price, which sets the foundation for the pattern.
AB: A retracement of the XA leg, typically around 38.2% to 61.8% of XA.
BC: A secondary retracement, often 38.2% to 88.6% of AB.
CD: The final leg, extending beyond BC, with specific Fibonacci targets depending on the pattern.
Types of Patterns:
Gartley: Features a deep retracement (61.8%) of the XA leg and a completion point at D near 78.6%.
Bat: Similar to the Gartley but with a shallower AB retracement and D completing at 88.6%.
Butterfly: Extends beyond XA, with the D point reaching a 127.2% or 161.8% extension.
Crab: Features an extreme extension of the XA leg, with the D point reaching a 161.8% or beyond.
Confirmation:
A valid XABCD pattern should align with Fibonacci levels. Traders often wait for price action or other indicators (like RSI divergence) to confirm the reversal.
Applying XABCD Patterns to XVS Coin
When trading XVS using XABCD patterns:
Look for clear impulsive and corrective waves that align with the pattern's structure.
Use Fibonacci tools to verify retracements and extensions.
Confirm potential reversal zones (PRZ) near the D point with additional signals like volume spikes or momentum divergence.
Monitor support/resistance zones for added confluence with pattern completion.
This approach allows you to predict potential reversals or continuations in XVS price, offering well-defined risk-reward opportunities.
I keep my charts clean and simple because I believe clarity leads to better decisions. Trading doesn’t have to be overly complicated, and I enjoy sharing setups that have worked well for me.
My approach is built on years of experience and a solid track record. I don’t claim to know it all, but I’m confident in my ability to spot high-probability setups. It’s all about learning and growing together as traders, and I’m here to share what I see.
The markets can confirm what the charts whisper if we’re paying attention. I hope these levels help you as much as they’ve helped me in the past. Let’s see how this plays out!
My Previous Hits
🐶 DOGEUSDT.P: Next Move
🎨 RENDERUSDT.P: Opportunity of the Month
💎 ETHUSDT.P: Where to Retrace
🟢 BNBUSDT.P: Potential Surge
📊 BTC Dominance: Reaction Zone
🌊 WAVESUSDT.P: Demand Zone Potential
🟣 UNIUSDT.P: Long-Term Trade
🔵 XRPUSDT.P: Entry Zones
🔗 LINKUSDT.P: Follow The River
📈 BTCUSDT.P: Two Key Demand Zones
🟩 POLUSDT: Bullish Momentum

Venus? Moon? Who Cares?XVS, also known as Venus, has experienced a sudden price surge and an increase in volume. As a result, I have identified two potential demand zones.
These zones are based on the assumption that they could act as strong support levels, where buying interest might re-emerge due to the current momentum and the underlying market structure.
If the price retraces to these zones, they could provide an opportunity for a rebound, as they represent areas where buyers might step in again to drive the price higher.
I don't overcomplicate things and add a ton of dirty crap to my charts, but you can check out the success of my analysis below.
I approach trading with confidence backed by experience and past success in identifying high-probability setups.
While I don’t claim to be the best, my track record speaks for itself, and I strive to let my analysis and results do the talking. Watch these levels closely—markets can confirm what charts already whisper. Let’s see how this plays out together.
My Previous Ideas
DOGEUSDT.P | 4 Reward for 1 Risk much more if you hold it.
RENDERUSDT.P | HTF Accuracy
ETHUSDT.P | Accurate Buyer Zone Identification | High Risk Reward if you hold it.
BNBUSDT.P | Accurate Buyer Zone Identification | High Risk Reward if you hold it.
Bitcoin Dominance | Great Characteristic Detection and Accurate Analysis

XVS ANALYSIS (12H)From where we put the red arrow on the chart, it looks like the XVS correction has started.
XVS is approaching a flip range
We are looking for sell/short positions in the red range.
We have specified short-term targets on the chart.
Closing a daily candle above the invalidation level will violate the analysis.
For risk management, please don't forget stop loss and capital management
When we reach the first target, save some profit and then change the stop to entry
Comment if you have any questions
Thank You

XVS sell/short setupThe structure of large time frames is bearish. So we are looking for sell/short positions in the main supply ranges.
We are looking for sell/short positions on the supply range.
We specified the targets on the chart.
Closing a daily candle above the invalidation level will violate the analysis
Note that the financial market is risky, so:
Do not enter a position without setting a stop and capital management and confirmation and trigger.
When we reach the first TP, save some profit and try to move the stop continuously in the direction of your profit.
If you have any comments please post them, comments will help us improve our performance
Thanks

VENUS $XVS forming a inverse head & shoulders heading to $100?This could be a leverage position on #BNB as that hits all time highs
as it is part of that ecosystem along with
#Floki
#CAKE
#AI
#ID
#WHY
&
#BEL
as major dapps on BSC
Let's see if it can crush the neckline

#XVS/USDT#XVS
The price has been moving in a symmetrical triangle since December 2023
The price adheres to the boundaries of that triangle beautifully
The price is expected to break the triangle upward
Current price 12.11
First goal 13.02
For the second goal 13.74
Third goal 14.77

XVS #Crypto Inverse head and ShouldersThe big question ???
What kind of right shoulder will it give us?
If it just breaks the neckline --- there is a chance it just goes.
A sell the news event could be a golden entry though
The news as I hear --- this Crypto is soon to be deployed on #ETH
And the rate of emissions is to be reduced.
Let's monitor.
