$XVS - Weekly outlook: CRYPTOCAP:XVS - Weekly outlook:
💣Nuclear bomb incoming? 🚀
❌Bearish break? 📉
Current price: $4.50
Comment if you know about latest project news. ✍️
#trading #XVS
Xvsusdt

#XVS/USDT – Accumulation Nearing Its End, Major Breakout?#XVS
The price is moving in a descending channel on the 1-hour timeframe. It has reached the lower boundary and is heading towards breaking above it, with a retest of the upper boundary expected.
We have a downtrend on the RSI indicator, which has reached near the lower boundary, and an upward rebound is expected.
There is a key support zone in green at 4.10. The price has bounced from this zone multiple times and is expected to bounce again.
We have a trend towards stability above the 100-period moving average, as we are moving close to it, which supports the upward movement.
Entry price: 4.20
First target: 4.27
Second target: 4.35
Third target: 4.43
Don't forget a simple principle: money management.
Place your stop-loss below the support zone in green.
For any questions, please leave a comment.
Thank you.

#XVS - Price analysis: #XVS - Price analysis: 🍿
The current price is sitting on a monthly demand zone.
I didn't dive into the fundamentals in ages, but if support holds, it may be a good opportunity to DCA for the long term 💎
Daily view: Pretty neutral - nothing to do yet for trading.
⚠️ Not financial advice - DYOR.

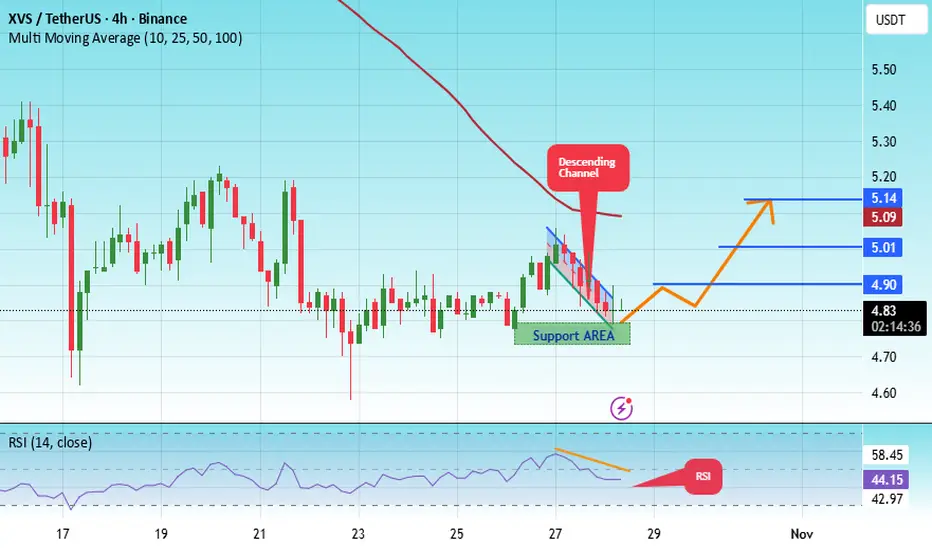
#XVS/USDT – Accumulation Nearing Its End, Major Breakout?#XVS
The price is moving in an ascending channel on the 1-hour frame, adhering well to it, and is heading for a strong breakout and retest.
We have a bearish trend on the RSI indicator that is about to be broken and retested, which supports the upward breakout.
There is a major support area in green at 4.77, representing a strong support point.
We are heading for consolidation above the 100 moving average.
Entry price: 4.80.
First target: 4.90.
Second target: 5.01.
Third target: 5.14.
Don't forget a simple matter: capital management.
When you reach the first target, save some money and then change your stop-loss order to an entry order.
For inquiries, please leave a comment.
Thank you.
XVS/USDT — Major Accumulation Zone or the Final Breakdown?XVS is once again standing at a critical historical zone between $4.00 and $3.00, a level that has defined market direction for more than three years.
Every touch on this area has led to either a major bullish reversal or a sharp continuation to the downside.
Recently, price printed a deep wick below the zone and quickly recovered — a classic sign of a liquidity grab, where smart money sweeps retail stop-losses before deciding the real direction.
From a technical perspective, XVS has been trading in a massive sideways range since 2022, with strong demand around 3–4 and multi-layer resistance levels above.
Every time this base has held, a strong rally followed — making this area one of the most decisive zones in XVS’s chart history.
---
Bullish Scenario
A weekly close above $4.50 would confirm that buyers are defending the zone, indicating potential accumulation by strong hands.
A follow-up breakout above $7.00 would shift the mid-term structure to bullish, confirming the start of a new upward phase.
Upside targets stand at $7.00 → $12.00 → $14.50 → $17.35, with a macro extension toward $38.50, the previous major supply zone.
Bullish narrative:
The 3–4 area may represent a final liquidity sweep before a new accumulation phase begins. If volume confirms, XVS could trigger a short-covering rally leading to sharp price recovery.
---
Bearish Scenario
A weekly close below $3.00 would invalidate the support zone and confirm a macro breakdown.
In that case, price could slide toward $1.70 – $1.16, the historical demand base from previous cycles.
Losing this zone could spark a capitulation phase, as major stop clusters are likely resting below it.
Bearish narrative:
Failure to defend the 3–4 range would mark the start of a deeper markdown phase — a potential final leg before a long-term bottom forms.
---
Pattern Overview
XVS is forming a macro horizontal accumulation structure since 2022.
The latest wick below the support zone indicates a possible shakeout event — an early hint of reversal if confirmed by higher closes.
Still, without confirmation above resistance levels, this remains a high-stakes battleground between bulls and bears.
---
The 3–4 zone isn’t just a number — it’s the defining line between recovery and collapse.
If the level holds, XVS could enter a powerful recovery phase toward mid-range resistance.
But if it breaks, the chart opens room for a capitulation wave toward historical lows.
The upcoming weekly closes will determine the next major chapter of this asset.
---
#XVS #XVSUSDT #Crypto #CryptoTrading #SupportZone #LiquiditySweep #SmartMoney #Accumulation #TechnicalAnalysis #Altcoins #RangeTrading #MarketStructure

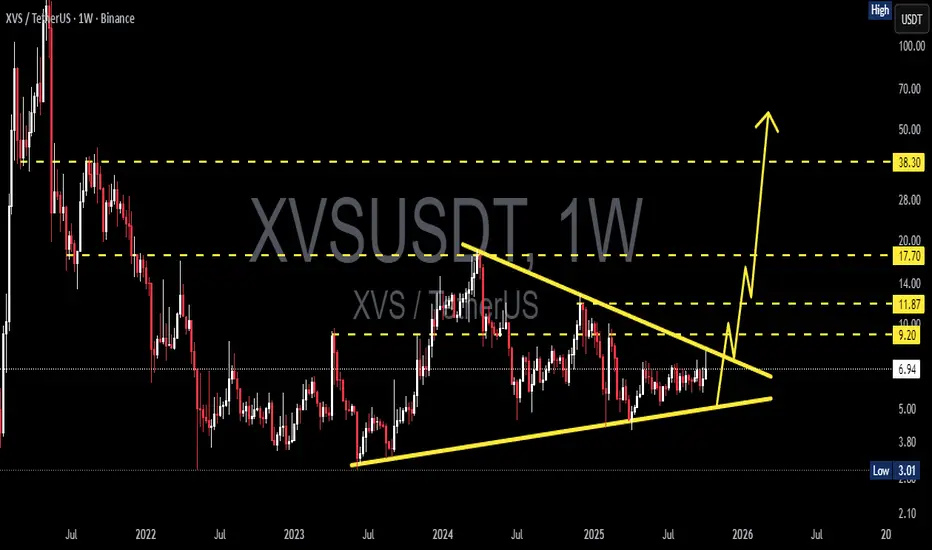
XVS/USDT – Accumulation Nearing Its End, Major Breakout?For over two years, XVS/USDT has been locked inside a massive multi-year accumulation phase, forming a clear Symmetrical Triangle pattern on the weekly timeframe.
Each move has been creating higher lows and lower highs, showing a tightening range and volatility compression — a classic setup before a major expansion phase begins.
Now, price action is once again testing the apex area of the triangle, suggesting that a decisive breakout is approaching.
This type of structure often precedes powerful reversals or trend continuations, depending on which direction the breakout confirms.
---
📈 Bullish Scenario
Breakout Confirmation: A weekly close above the descending trendline (around 7.0–9.2) with strong volume expansion.
Once confirmed, the medium-term targets are 11.87 → 17.70 → 21.60, with a possible extended rally toward 38.30 if broader market sentiment turns bullish.
The structure suggests that buyers have been quietly accumulating — and when this compression releases, momentum could accelerate quickly.
💡 Interesting Note: The longer a triangle forms, the stronger the breakout potential.
XVS has been building this base for over 100 weeks, indicating a significant amount of pent-up energy waiting to be released.
---
📉 Bearish Scenario
Failure to break above resistance followed by a weekly close below the rising trendline (~5.0) would shift momentum bearish.
Downside targets sit near 3.8 – 3.01, which represents the final historical demand zone.
A confirmed breakdown below 3.0 could invalidate the structure and potentially extend the downtrend further.
---
🔍 Pattern Analysis & Interpretation
Pattern Type: Symmetrical Triangle — a sign of prolonged accumulation and tightening market pressure.
Meaning: Such structures often mark a pivotal transition zone between accumulation and expansion.
Volume: Watch for a clear increase in trading volume during the breakout; without it, false breakouts are common.
---
🧭 Summary
XVS is entering a critical decision zone after years of sideways action.
A confirmed breakout above 9.2 could trigger the next major bullish cycle, while a breakdown below the lower boundary would confirm renewed weakness toward long-term support.
This is not just another consolidation — it’s a battle between accumulation and distribution, and its resolution could define XVS’s direction into 2026 and beyond.
---
#XVS #XVSUSDT #CryptoAnalysis #AltcoinBreakout #DeFi #TechnicalAnalysis #SymmetricalTriangle #CryptoChart #CryptoSetup #AccumulationPhase #CryptoMarket #BullishSetup
XVSUSDT Forming Bullish MomentumXVSUSDT is currently showing strong signs of bullish strength after breaking through a key resistance zone that has held for several weeks. The price action indicates renewed buying pressure, with traders positioning for a potential continuation of the uptrend. The market structure reflects a shift in sentiment as buyers dominate the chart, pushing for higher highs and higher lows, suggesting the beginning of a strong bullish phase.
Trading volume remains good, confirming that there is real demand backing this move. The current setup points toward a potential gain of 40% to 50%+ if momentum continues and the breakout sustains above key levels. This aligns well with the overall market trend where mid-cap altcoins are regaining traction after a period of consolidation. Such setups typically attract technical traders looking for breakout opportunities supported by volume expansion.
Investors are increasingly taking interest in XVSUSDT, recognizing the coin’s potential to deliver strong performance in the upcoming sessions. With market confidence returning and volatility providing fresh trading opportunities, XVSUSDT stands out as one of the promising bullish setups to watch in the near term.
✅ Show your support by hitting the like button and
✅ Leaving a comment below! (What is You opinion about this Coin)
Your feedback and engagement keep me inspired to share more insightful market analysis with you!

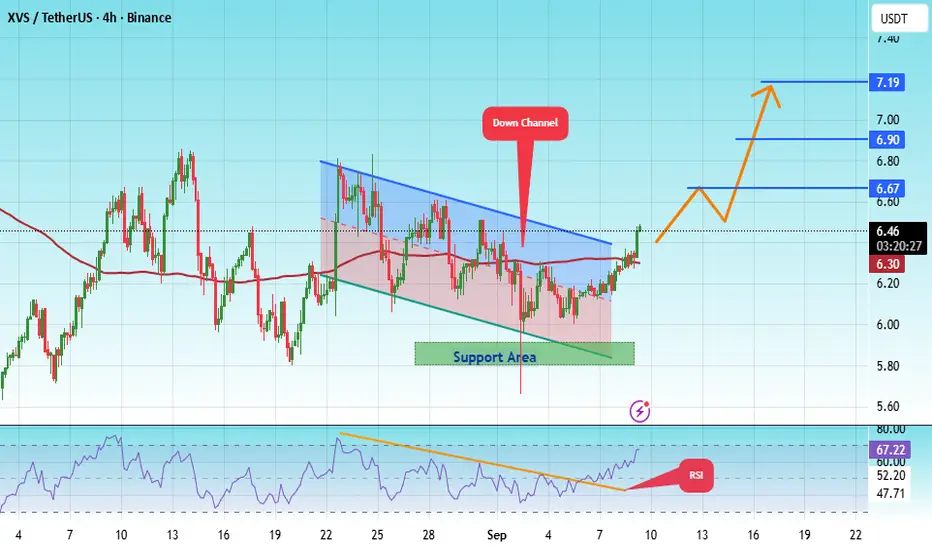
#XVS/USDT Go UP for 15% ?#XVS
The price is moving within a descending channel on the 4-hour frame, adhering well to it, and is heading for a strong breakout and retest.
We have a bearish trend on the RSI indicator that is about to be broken and retested, which supports the upward breakout.
There is a major support area in green at 5.86, representing a strong support point.
For inquiries, please leave a comment.
We are in a consolidation trend above the 100 Moving Average.
Entry price: 6.46
First target: 6.67
Second target: 6.90
Third target: 7.19
Don't forget a simple matter: capital management.
When you reach the first target, save some money and then change your stop-loss order to an entry order.
For inquiries, please leave a comment.
Thank you.
$XVS breakout watch After 8 months of tight consolidation, the $XVS breakout watch After 8 months of tight consolidation, the chart is showing serious strength.
Price is pressing against resistance, a breakout could send it toward $10+ momentum is building keep an eye 👀

Venus (XVS) After a 98% Drop | Is It Time to Fly Again?💀 Hey , how's it going ? Come over here — Satoshi got something for you !
⏰ We’re analyzing XVS on the 1-Week timeframe .
This is one of my personal favorite coins, which, after setting its all-time high, experienced a massive 98% drop in price. Despite that, it has managed to hold its position at rank 369 on CoinMarketCap.
👀 After forming a strong ATH around $140, Venus faced a rejection and entered a very deep correction. A downtrend channel has been drawn—serving purely to illustrate the slope and scale of the correction.
⚙️ Our key RSI level is 54.25; breaking above this level will likely trigger stronger long positions for Venus.
✏️ A curve line has been plotted to visualize the time–price path, making price action easier to interpret. In most cases, a curve line reaction or breakout tends to push the price toward the next key support or resistance level.
⚡ An important resistance has formed at $7.13. If this resistance breaks, a spot position with a tight stop-loss could be considered for the portfolio.
🎮 A Fibonacci retracement has been drawn to map important zones. On the multi-timeframe view, the weekly area appears to be in a range. The 0.236 level is acting as the ceiling—breaking this level (at $7.37) could be a trigger for opening positions.
🟢 Venus’s trading volume is decreasing, which is actually a positive sign; the lower the volume before a breakout, the easier and cleaner the breakout can be—similar to price escaping a consolidation box and surging upward.
🔍 Project fundamentals: Venus operates in the DeFi lending sector, built on the BSC network. It uses a governance token model where collateral supply can be adjusted by the supplier. By staking this coin, you can also mint the VAI stablecoin.
🔔 Alert zone: Set an alert at $7.737 and monitor price action on multiple timeframes when it’s reached. If it aligns with the above confirmations, you can open your position. This alert has been preset in the TradingView team setup.
🖥 Summary: On the weekly chart, Venus is facing a key resistance level. A breakout above it could significantly increase capital inflows and allow the coin to test higher price levels.
⏰ We’re analyzing XVS on the 1-Day timeframe .
👀 I’ve already provided the full project details above. On the daily timeframe, this coin is moving within an upward channel with a healthy slope and has maintained this structure well. A breakout above the channel’s upper boundary coincides with the zone we identified on the weekly timeframe, intersecting with the $7.26 resistance. The more we zoom out in multi-timeframe analysis, the more precise the resistance price zones become, allowing us to shift the alert zone to this key level.
⚙️ Our critical swing level is at 62.85. Breaking above this level will likely increase trading volatility, potentially pushing Venus into overbought territory again and driving it toward higher resistance levels.
🟢 Venus’s trading volume is decreasing, and we have a very strong daily box that essentially highlights the heavy $7.26 resistance.
🖥 Summary: If Venus breaks the identified zone, triggers the alert level, and confirms its reaction around $7.26, it could provide us with a long position. With proper profit-taking or closing the position, we could then consider buying Venus in spot.
❤️ Disclaimer: This analysis is purely based on my personal opinion and I only trade if the stated triggers are activated.

$XVS/USDT Just Broke Out – Eyes on $12 Next.$XVS just broke out of a long-term triangle and cleared the key $7 resistance zone.
This is a strong bullish sign. If the price holds above this level, we could see a sharp move toward $12–13.
A clean retest would make this setup even stronger.
DYOR, NFA

#XVS/USDT#XVS
The price is moving within a descending channel on the 1-hour frame, adhering well to it, and is heading for a strong breakout and retest.
We are seeing a bounce from the lower boundary of the descending channel, which is support at 5.75.
We are seeing a downtrend on the RSI indicator that is about to break and retest, supporting the upward trend.
We are looking for stability above the 100 Moving Average.
Entry price: 5.95
First target: 6.07
Second target: 6.25
Third target: 6.46

#XVS/USDT#XVS
The price is moving within a descending channel on the 1-hour frame, adhering well to it, and is heading for a strong breakout and retest.
We are experiencing a rebound from the lower boundary of the descending channel, which is support at 5.60.
We are experiencing a downtrend on the RSI indicator that is about to be broken and retested, supporting the upward trend.
We are looking for stability above the 100 Moving Average.
Entry price: 5.70
First target: 5.86
Second target: 6.03
Third target: 6.32

XVSUSDT | Sales Are Slowing, Resistance Zones AheadXVSUSDT is struggling to find sustained buying pressure. Over the past 24 hours, trading volume sits around 1.9 million USDT, yet the market buy ratio is –66.83 percent, showing sellers are dominating and buyers have largely stepped back
🔴 Resistance Levels to Respect
The red boxes on the chart mark strong resistance zones. Every prior test of these areas has triggered a sell‑off, and in the absence of fresh buying momentum, they’re likely to hold again.
🛠 How to Trade This Setup
Short at Resistance
• Wait for price to rally into a red box.
• Confirm with a clear lower‑time‑frame breakdown (e.g. on a 5‑ or 15‑minute chart) plus a negative CDV divergence or rising sell volume.
• Enter shorts only when these conditions align.
Stay Flexible
• I won’t force shorts if XVSUSDT breaks above a red box without giving a valid downward break on the low timeframe.
• If it clears resistance with strong volume and retests the former red box as support, I’ll shift bias and consider longs.
🎯 Key Takeaway
Buyers are taking a breather, and without new demand, resistance levels become even tougher to crack. By trading with confirmation and respecting these red‑box zones, you align yourself with the prevailing market flow rather than chasing fading momentum.
📌I keep my charts clean and simple because I believe clarity leads to better decisions.
📌My approach is built on years of experience and a solid track record. I don’t claim to know it all but I’m confident in my ability to spot high-probability setups.
📌If you would like to learn how to use the heatmap, cumulative volume delta and volume footprint techniques that I use below to determine very accurate demand regions, you can send me a private message. I help anyone who wants it completely free of charge.
🔑I have a long list of my proven technique below:
🎯 ZENUSDT.P: Patience & Profitability | %230 Reaction from the Sniper Entry
🐶 DOGEUSDT.P: Next Move
🎨 RENDERUSDT.P: Opportunity of the Month
💎 ETHUSDT.P: Where to Retrace
🟢 BNBUSDT.P: Potential Surge
📊 BTC Dominance: Reaction Zone
🌊 WAVESUSDT.P: Demand Zone Potential
🟣 UNIUSDT.P: Long-Term Trade
🔵 XRPUSDT.P: Entry Zones
🔗 LINKUSDT.P: Follow The River
📈 BTCUSDT.P: Two Key Demand Zones
🟩 POLUSDT: Bullish Momentum
🌟 PENDLEUSDT.P: Where Opportunity Meets Precision
🔥 BTCUSDT.P: Liquidation of Highly Leveraged Longs
🌊 SOLUSDT.P: SOL's Dip - Your Opportunity
🐸 1000PEPEUSDT.P: Prime Bounce Zone Unlocked
🚀 ETHUSDT.P: Set to Explode - Don't Miss This Game Changer
🤖 IQUSDT: Smart Plan
⚡️ PONDUSDT: A Trade Not Taken Is Better Than a Losing One
💼 STMXUSDT: 2 Buying Areas
🐢 TURBOUSDT: Buy Zones and Buyer Presence
🌍 ICPUSDT.P: Massive Upside Potential | Check the Trade Update For Seeing Results
🟠 IDEXUSDT: Spot Buy Area | %26 Profit if You Trade with MSB
📌 USUALUSDT: Buyers Are Active + %70 Profit in Total
🌟 FORTHUSDT: Sniper Entry +%26 Reaction
🐳 QKCUSDT: Sniper Entry +%57 Reaction
📊 BTC.D: Retest of Key Area Highly Likely
📊 XNOUSDT %80 Reaction with a Simple Blue Box!
📊 BELUSDT Amazing %120 Reaction!
I stopped adding to the list because it's kinda tiring to add 5-10 charts in every move but you can check my profile and see that it goes on..

TradeCityPro | XVS: Tracking Its Trajectory in the DeFi Space👋 Welcome to TradeCity Pro!
In this analysis, I want to review the XVS coin, which you requested in the comments. This project is one of the DeFi projects with a market cap of $72 million, ranking 346th on CoinMarketCap.
📅 Weekly Timeframe
In the weekly timeframe, as you can observe, the price started a downtrend after reaching a peak in 2021, and this trend is still ongoing.
✨ Currently, there is a consolidation box from 3.34 to 17.61, and the price has been fluctuating between these two areas for almost three years.
✔️ In the previous weekly candle, the support at 5.45 was broken, and now the price is moving towards the support at 3.34. This support is very crucial, and its breach could trigger another sharp drop.
🔽 There is also a descending trend line that the price has touched twice, and after being rejected by this trend, a significant amount of selling volume entered the market and induced a momentum that led to the breach of the 3.34 support.
📈 For XVS to turn bullish, the only trigger we have for now is the break of the trend line and the activation of its trigger. The trend line trigger is currently at 9.09. However, if the price creates a new structure, we might confirm a bullish turn sooner.
🛒 For buying in spot, the first trigger is the break of 9.09, which is considered a risky trigger in this timeframe. The main trigger is after 17.61.
⚡️ However, as I have mentioned in recent Bitcoin analyses, altcoin triggers and even the Total2 in spot don't currently hold much significance. For buying altcoins in spot, we should wait until Bitcoin dominance turns bearish.
📅 Daily Timeframe
Let's move to the daily timeframe to observe the details of the price movement more closely.
🧩 In this timeframe, we have a curved trend line that the price has hit several times and fallen.
⭐ Currently, after breaking 4.95, we can apply a Fibonacci Extension to find potential support areas. The price has reached the 0.618 level and has tested it. This area might be able to prevent further price falls. Otherwise, the next supports will be at the 0.786 and 1 Fibonacci levels, with the 1 area overlapping with the 3.34 support.
💥 The RSI oscillator is close to oversell and if this oscillator break the 30 level,it will support the bearish movement.
🔼 For buying or a long position, a suitable trigger is the 6.25 area, which is both a significant support and the last peak formed after breaking the 4.95 floor. The main trigger for the start of the primary bullish trend will be at 11.79.
📝 Final Thoughts
This analysis reflects our opinions and is not financial advice.
Share your thoughts in the comments, and don’t forget to share this analysis with your friends! ❤️

XVSUSDT – The Market is Talking… Are You Listening?Most traders lose because they react emotionally. Not us. We plan, we execute, we win. This is the difference between gambling and trading. If you're still guessing, you're already behind.
📌 Key Insights:
🔴 Red Box = Major Resistance Zone – This is where the market makers decide who wins and who loses. Do you want to be on the right side or the losing side?
📉 LTF Confirmations Are Everything – Without CDV alignment, volume profile support, and clear structural breaks, you are blind in the market. This is why 95% fail, and why we don’t.
🎯 Discipline Wins. Always. – No FOMO, no random entries. If resistance holds, we short with precision. If it breaks with volume and a clean retest, we go long.
💡 This is why you NEED to follow me. Most traders guess and hope—I show you the roadmap before it even happens. If you’re serious about winning, stop trading alone. Follow. Watch. Execute. Success leaves clues. I’m giving them to you.
✅I keep my charts clean and simple because I believe clarity leads to better decisions.
✅My approach is built on years of experience and a solid track record. I don’t claim to know it all but I’m confident in my ability to spot high-probability setups.
✅If you would like to learn how to use the heatmap, cumulative volume delta and volume footprint techniques that I use below to determine very accurate demand regions, you can send me a private message. I help anyone who wants it completely free of charge.
🔑I have a long list of my proven technique below:
🎯 ZENUSDT.P: Patience & Profitability | %230 Reaction from the Sniper Entry
🐶 DOGEUSDT.P: Next Move
🎨 RENDERUSDT.P: Opportunity of the Month
💎 ETHUSDT.P: Where to Retrace
🟢 BNBUSDT.P: Potential Surge
📊 BTC Dominance: Reaction Zone
🌊 WAVESUSDT.P: Demand Zone Potential
🟣 UNIUSDT.P: Long-Term Trade
🔵 XRPUSDT.P: Entry Zones
🔗 LINKUSDT.P: Follow The River
📈 BTCUSDT.P: Two Key Demand Zones
🟩 POLUSDT: Bullish Momentum
🌟 PENDLEUSDT.P: Where Opportunity Meets Precision
🔥 BTCUSDT.P: Liquidation of Highly Leveraged Longs
🌊 SOLUSDT.P: SOL's Dip - Your Opportunity
🐸 1000PEPEUSDT.P: Prime Bounce Zone Unlocked
🚀 ETHUSDT.P: Set to Explode - Don't Miss This Game Changer
🤖 IQUSDT: Smart Plan
⚡️ PONDUSDT: A Trade Not Taken Is Better Than a Losing One
💼 STMXUSDT: 2 Buying Areas
🐢 TURBOUSDT: Buy Zones and Buyer Presence
🌍 ICPUSDT.P: Massive Upside Potential | Check the Trade Update For Seeing Results
🟠 IDEXUSDT: Spot Buy Area | %26 Profit if You Trade with MSB
📌 USUALUSDT: Buyers Are Active + %70 Profit in Total
🌟 FORTHUSDT: Sniper Entry +%26 Reaction
🐳 QKCUSDT: Sniper Entry +%57 Reaction
📊 BTC.D: Retest of Key Area Highly Likely
📊 XNOUSDT %80 Reaction with a Simple Blue Box!
📊 BELUSDT Amazing %120 Reaction!
I stopped adding to the list because it's kinda tiring to add 5-10 charts in every move but you can check my profile and see that it goes on..

FireHoseReel " XVSUSDTWelcome to FireHoseReel ! ❤️
Today we're gonna dive into the XVS coin and break down what the project is all about. Stick with us
This coin has shot up 40% after breaking its upward channel, and then it had a solid climb but pulled back 50% because of profit-taking and heavy selling. It created a key demand zone, and a lot of market makers, retail traders, and exchanges have been buying in the $4.70 to $5.30 range. The next targets for this coin could be $11.50 and $12, and we could see a price increase of up to 90% !
XVSUSDT is the trading pair for the Venus token (XVS) against Tether (USDT). Venus is a decentralized finance (DeFi) protocol built on the Binance Smart Chain (BSC) that allows users to borrow and lend cryptocurrencies.
With Venus, users can supply assets to the platform to earn interest or take out loans using their crypto as collateral. The XVS token serves as the governance token for the Venus protocol, allowing holders to participate in decision-making processes related to the platform’s development and operations.
Hope you guys found these analyses useful! Wishing you all the best 🔥 Don't forget about money management and risk management. Love you all, friends ❤️

#XVS/USDT#XVS
The price is moving in a descending channel on the 1-hour frame and is expected to continue upwards
We have a trend to stabilize above the moving average 100 again
We have a descending trend on the RSI indicator that supports the rise by breaking it upwards
We have a support area at the lower limit of the channel at a price of 7.00
Entry price 7.31
First target 7.75
Second target 8.09
Third target 8.51

Good moment for Buy XVSGood moment for Buy XVS. The big flat channel and we are tested the middle line. Good risk reward ration with small top. The goal to take up level and check on the broke. Will see...

TradeCityPro | XVS : Navigating Market Dynamics👋 Welcome to TradeCityPro!
In this analysis, I want to review the XVS coin for you, as requested in the comments. So, I decided to analyze this coin in weekly, daily, and four-hour timeframes.
🔍 The Venus project is one of the DeFi projects active in Lend and Borrow, boasting a TVL of $1.88 billion, ranking it among the top platforms on the Binance network. It's one of the most reputable projects on this network. The project's coin, named XVS, offers additional capabilities on this platform through staking and holding.
📅 Weekly Timeframe
In the weekly timeframe, we see a very large range box starting from a floor of 3.34 and a ceiling at 17.61. XVS is considered a heavy coin due to a lot of staking and a significant number of whales and holders. This means it experiences fewer fluctuations because it has a large amount of money invested in it. Despite Bitcoin and other coins that are near or even above their previous ATHs, this coin is still in its consolidation box.
✨ Another very important support is at 5.45, which is crucial and the price has hit it several times. The market volume started to decrease after reaching the resistance at 17.61 but has increased again in recent weeks. This shows that whales are moving back towards this coin, increasing both the inflow and outflow of money, and consequently, the 24-hour volume has also increased.
🚀 If the price can stabilize above 17.61, we can expect the start of an upward trend and the price could move towards higher targets. The targets for this coin are at 38.73 and 141 dollars. Given the market cap of 137 million dollars, if the project becomes one of the successful crypto projects and attracts more holders and whales, the targets I mentioned will be attainable and not far-fetched.
⚡️ Another important note in the chart is that the 5.45 support, as I mentioned, is crucial, and if it breaks and the RSI also drops below 38.36, the situation for this coin will be very grim. We can expect the price to even break below the floor of 3.34 and move towards newer lows.
📅 Daily Timeframe
As you can see in the daily timeframe, after breaking 7.99, the price moved down to 4.98, but we observed a V pattern in the price that caused it to move back above 7.99. Given the large volume of buying seen in the candles, it seems a significant upward momentum has entered the market, and I believe if the price can continue upwards and break the 11.85 area, we can expect the next bullish leg and even the appropriate momentum to break the 1.49 to finally start the upward trend of this coin in higher cycles.
🔽 On the other hand, if the price forms a lower ceiling relative to 11.85 and moves back towards 4.98, if this area breaks, the next support will be at 3.33. In the RSI, for a bullish position and to confirm the upward trend, breaking the 70 area can give us a suitable confirmation, but for a downward momentum, I currently don’t have a specific trigger and we need to wait for the site and market structure to form to see what trigger it gives us for the entry of downward momentum.
⏳ 4-Hour Timeframe
Let's go to the 4-hour timeframe to specify the futures triggers. As you can see, we can observe the last bullish leg of the price in this timeframe with more details.
📊 After being supported at 4.87 and moving upwards, the price reached 9.10. As you see above, a divergence in the RSI has occurred. Despite the price hitting two identical peaks at 9.10, the RSI has made a lower peak, which could indicate a divergence. The divergence trigger, which was the 50 area, was activated in yesterday’s candle, and we can expect to see the effect of this divergence in the market.
💥 However, keep in mind that in bullish trends with very high momentum, the presence of divergence is due to the mathematical calculations of the RSI and is completely natural. So until the price falls below the 7.69 area, we will not see the effect of the divergence on the price, and the divergence we see will simply be due to the formula and mathematical calculations of the RSI.
🧩 If the 7.69 area breaks, the price might make deeper corrections down to the 0.382 and 0.618 Fibonacci levels, which correspond to areas of 7 dollars and 6.12 dollars respectively. For a long position, our task is very clear and has a good trigger. If the 9.10 area breaks, we can open a long position towards the 11.85 target.
📝 Final Thoughts
This analysis reflects our opinions and is not financial advice.
Share your thoughts in the comments, and don’t forget to share this analysis with your friends! ❤️

HOOKUSDT UPDATEHOOKUSDT is a cryptocurrency trading at $0.2285. Its target price is $0.4000, indicating a potential 120%+ gain. The pattern is a Bullish Falling Wedge, a reversal pattern signaling a trend change. This pattern suggests the downward trend may be ending. A breakout from the wedge could lead to a strong upward move. The Bullish Falling Wedge is a positive signal, indicating a potential price surge. Investors are optimistic about HOOKUSDT's future performance.

TradeCityPro | XVSUSDT Possibility of a Long-Term Move Starting 👋 Welcome to TradeCityPro Channel!
Let’s analyze XVS, one of my favorite coins in the crypto and DeFi space, which operates in the LEND & Borrow sector on the BNB network, as we may work with it more extensively in the future.
🌐 Overview Bitcoin
Before analyzing today's altcoin, let’s start by reviewing Bitcoin on the 1-hour timeframe
Yesterday, I mentioned opening a long position with Bitcoin’s break of 97343 and even suggested using a stop-buy order. Today, following the news announcement, this resistance was broken aggressively, showing strong whale activity.
With this breakout, Bitcoin dominance has begun to drop, so it would have been more logical to place stop-buy orders on altcoins. If you haven’t done so yet, don’t worry! You can wait for the next confirmation by Bitcoin breaking 99485 to take action on your altcoins.
📊 Weekly Timeframe
In the weekly timeframe, XVS remains in a large range and has been moving slowly.
Recently, after faking a breakout above the range, it did not return to its bottom. In 2024, we haven’t revisited the 3.51 support level. Instead, we formed a higher low at 5.33, suggesting a potential shift.
For re-entry, you could consider buying above 12.94. Personally, I entered at the 5.33 breakout in late 2023 and will not make any new purchases at the moment. My stop-loss remains below 3.51.
📈 Daily Timeframe
On the daily timeframe, after breaking 8.21 and exiting the daily range, XVS moved toward the 11.83 resistance, where it faced heavy rejection.
After that, lower highs were formed, leading to a descending triangle pattern with equal lows.
If the descending trendline breaks, we might see the uptrend resume with confirmation from momentum and volume. Otherwise, a break below the triangle’s base at 8.21 could lead to a correction toward 6.09, though this is less likely.
Risky Entry: You could buy now with the current daily candle, but ensure your stop-loss is below 6.09 , Safe Entry: Wait for a confirmed breakout above 11.83, aiming for a target of 17.58.
⏱ 4-Hour Timeframe
Finally, in the 4-hour timeframe, after briefly wicking to the 7.73 support, XVS has bounced back into its range and is nearing the 9.47 resistance.
📈 Long Position Trigger
wait for 9.47 to break with clear momentum and volume or wait for the formation of higher highs and higher lows.
📉 Short Position Trigger
monitor for signs of rejection. If 9.47 turns into a fake-out, a short position below 8.52 could be considered.
📝 Final Thoughts
Stay calm, trade wisely, and let's capture the market's best opportunities!
This analysis reflects our opinions and is not financial advice.
Share your thoughts in the comments, and don’t forget to share this analysis with your friends! ❤️

XVSUSDT | High PotentialThe blue boxes on the XVS chart represent strong demand zones, especially when analyzed on higher time frames (HTF).
While price may dip lower within these zones, they offer potential for quick reactions and short-term opportunities, making them ideal for scalping or intraday trades. For HTF traders, deeper entries can be targeted at lower levels for more substantial long positions.
Balancing between immediate reactions and a long-term perspective allows flexibility in capturing both short-term gains and larger moves within the broader trend.
Spot buys will be a safer choice here.
I keep my charts clean and simple because I believe clarity leads to better decisions.
My approach is built on years of experience and a solid track record. I don’t claim to know it all, but I’m confident in my ability to spot high-probability setups.
My Previous Analysis
🐶 DOGEUSDT.P: Next Move
🎨 RENDERUSDT.P: Opportunity of the Month
💎 ETHUSDT.P: Where to Retrace
🟢 BNBUSDT.P: Potential Surge
📊 BTC Dominance: Reaction Zone
🌊 WAVESUSDT.P: Demand Zone Potential
🟣 UNIUSDT.P: Long-Term Trade
🔵 XRPUSDT.P: Entry Zones
🔗 LINKUSDT.P: Follow The River
📈 BTCUSDT.P: Two Key Demand Zones
🟩 POLUSDT: Bullish Momentum
🌟 PENDLEUSDT: Where Opportunity Meets Precision
🔥 BTCUSDT.P: Liquidation of Highly Leveraged Longs
🌊 SOLUSDT.P: SOL's Dip - Your Opportunity
🐸 1000PEPEUSDT.P: Prime Bounce Zone Unlocked
🚀 ETHUSDT.P: Set to Explode - Don't Miss This Game Changer
🤖 IQUSDT: Smart Plan
⚡️ PONDUSDT: A Trade Not Taken Is Better Than a Losing One
💼 STMXUSDT: 2 Buying Areas
