XVS/USDT — Major Accumulation Zone or the Final Breakdown?XVS is once again standing at a critical historical zone between $4.00 and $3.00, a level that has defined market direction for more than three years.
Every touch on this area has led to either a major bullish reversal or a sharp continuation to the downside.
Recently, price printed a deep wick below the zone and quickly recovered — a classic sign of a liquidity grab, where smart money sweeps retail stop-losses before deciding the real direction.
From a technical perspective, XVS has been trading in a massive sideways range since 2022, with strong demand around 3–4 and multi-layer resistance levels above.
Every time this base has held, a strong rally followed — making this area one of the most decisive zones in XVS’s chart history.
---
Bullish Scenario
A weekly close above $4.50 would confirm that buyers are defending the zone, indicating potential accumulation by strong hands.
A follow-up breakout above $7.00 would shift the mid-term structure to bullish, confirming the start of a new upward phase.
Upside targets stand at $7.00 → $12.00 → $14.50 → $17.35, with a macro extension toward $38.50, the previous major supply zone.
Bullish narrative:
The 3–4 area may represent a final liquidity sweep before a new accumulation phase begins. If volume confirms, XVS could trigger a short-covering rally leading to sharp price recovery.
---
Bearish Scenario
A weekly close below $3.00 would invalidate the support zone and confirm a macro breakdown.
In that case, price could slide toward $1.70 – $1.16, the historical demand base from previous cycles.
Losing this zone could spark a capitulation phase, as major stop clusters are likely resting below it.
Bearish narrative:
Failure to defend the 3–4 range would mark the start of a deeper markdown phase — a potential final leg before a long-term bottom forms.
---
Pattern Overview
XVS is forming a macro horizontal accumulation structure since 2022.
The latest wick below the support zone indicates a possible shakeout event — an early hint of reversal if confirmed by higher closes.
Still, without confirmation above resistance levels, this remains a high-stakes battleground between bulls and bears.
---
The 3–4 zone isn’t just a number — it’s the defining line between recovery and collapse.
If the level holds, XVS could enter a powerful recovery phase toward mid-range resistance.
But if it breaks, the chart opens room for a capitulation wave toward historical lows.
The upcoming weekly closes will determine the next major chapter of this asset.
---
#XVS #XVSUSDT #Crypto #CryptoTrading #SupportZone #LiquiditySweep #SmartMoney #Accumulation #TechnicalAnalysis #Altcoins #RangeTrading #MarketStructure
Xvsusdtidea

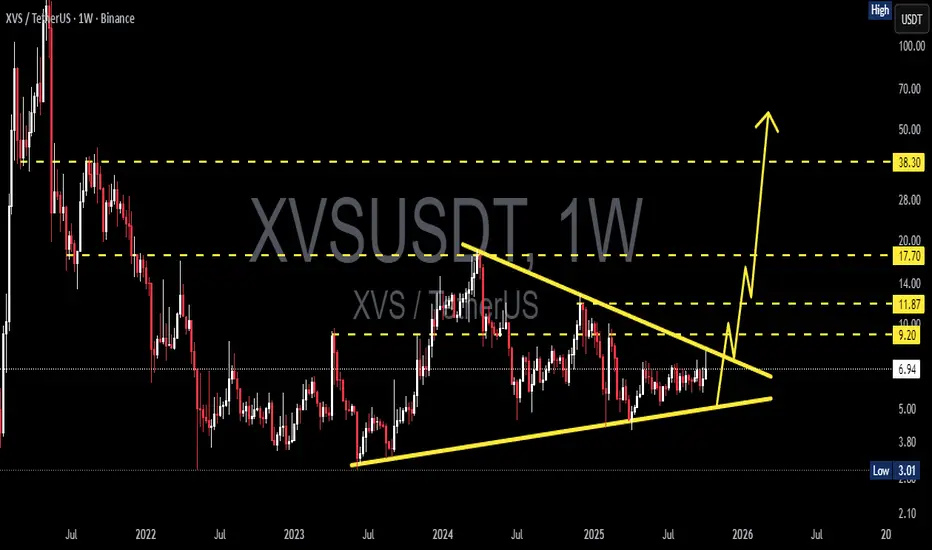
XVS/USDT – Accumulation Nearing Its End, Major Breakout?For over two years, XVS/USDT has been locked inside a massive multi-year accumulation phase, forming a clear Symmetrical Triangle pattern on the weekly timeframe.
Each move has been creating higher lows and lower highs, showing a tightening range and volatility compression — a classic setup before a major expansion phase begins.
Now, price action is once again testing the apex area of the triangle, suggesting that a decisive breakout is approaching.
This type of structure often precedes powerful reversals or trend continuations, depending on which direction the breakout confirms.
---
📈 Bullish Scenario
Breakout Confirmation: A weekly close above the descending trendline (around 7.0–9.2) with strong volume expansion.
Once confirmed, the medium-term targets are 11.87 → 17.70 → 21.60, with a possible extended rally toward 38.30 if broader market sentiment turns bullish.
The structure suggests that buyers have been quietly accumulating — and when this compression releases, momentum could accelerate quickly.
💡 Interesting Note: The longer a triangle forms, the stronger the breakout potential.
XVS has been building this base for over 100 weeks, indicating a significant amount of pent-up energy waiting to be released.
---
📉 Bearish Scenario
Failure to break above resistance followed by a weekly close below the rising trendline (~5.0) would shift momentum bearish.
Downside targets sit near 3.8 – 3.01, which represents the final historical demand zone.
A confirmed breakdown below 3.0 could invalidate the structure and potentially extend the downtrend further.
---
🔍 Pattern Analysis & Interpretation
Pattern Type: Symmetrical Triangle — a sign of prolonged accumulation and tightening market pressure.
Meaning: Such structures often mark a pivotal transition zone between accumulation and expansion.
Volume: Watch for a clear increase in trading volume during the breakout; without it, false breakouts are common.
---
🧭 Summary
XVS is entering a critical decision zone after years of sideways action.
A confirmed breakout above 9.2 could trigger the next major bullish cycle, while a breakdown below the lower boundary would confirm renewed weakness toward long-term support.
This is not just another consolidation — it’s a battle between accumulation and distribution, and its resolution could define XVS’s direction into 2026 and beyond.
---
#XVS #XVSUSDT #CryptoAnalysis #AltcoinBreakout #DeFi #TechnicalAnalysis #SymmetricalTriangle #CryptoChart #CryptoSetup #AccumulationPhase #CryptoMarket #BullishSetup
XVSUSD 1WXVS ~ 1W 📈
#XVS Make purchases gradually from here. We estimate that this resistance will be broken in the near future. minimum target 20%++

XVS LOOKS READY 👍Anticipating a potential surge in XVS price—expecting a rise of at least 20-40% from its current position. This anticipated breakout could be the confirmation we're waiting for!
Remember: This is my personal opinion, not financial advice. Always conduct your research before making any trading decisions. 📊💡
Happy Trading! 🌟

Xvs Retesting big breakout level Xvsusdt
Retesting big breakout level incase of successful retest expecting 50-80% Bullish move incoming days
Wait for confirmation all we have to wait for is momentum candles here for perfect entry

XVSUSDT Analysis (LOCAL VISION)Hello friends.
Please support my work by clicking the LIKE button👍(If you liked). Also i will appreciate for ur activity. Thank you!
Everything on the chart.
Entry: market and lower
Target: 14 and 19
after first target reached move ur stop to breakeven
Stop: 7.7 (depending of ur risk). ALWAYS follow ur RM .
Risk/Reward: 1 to 4
risk is justified
Good luck everyone!
Follow me on TRADINGView, if you don't want to miss my next analysis or signals.
It's not financial advice.
Dont Forget, always make your own research before to trade my ideas!
Open to any questions and suggestions.

XVSUSDT Analysis (perspective couple of months)Hello friends.
Please support my work by clicking the LIKE button👍(If you liked). Also i will appreciate for ur activity. Thank you!
Everything on the chart.
Upward movement from the current price or through 5$.
Entry: market and lower
Target: 10 - 15 - 20
after first target reached move ur stop to breakeven
Stop: (depending of ur risk). ALWAYS follow ur RM .
risk is justified
Good luck everyone!
Follow me on TRADINGView, if you don't want to miss my next analysis or signals.
It's not financial advice.
Dont Forget, always make your own research before to trade my ideas!
Open to any questions and suggestions.

XVSUSDT AnalysisHello friends.
Please support my work by clicking the LIKE button(If you liked).Thank you!
Everything on the chart.
open pos: market and lower
target: 30 - 36 - 45
after first target reached move ur stop to breakeven
stop: ~under 20 (depending of ur risk). ALWAYS follow ur RM .
risk/reward 1 to 4
risk is justified
Good luck everyone!
Follow me on TRADINGView, if you don't want to miss my next analysis or signals.
It's not financial advice.
Dont Forget, always make your own research before to trade my ideas!
Open to your questions or suggestions.
