YFI

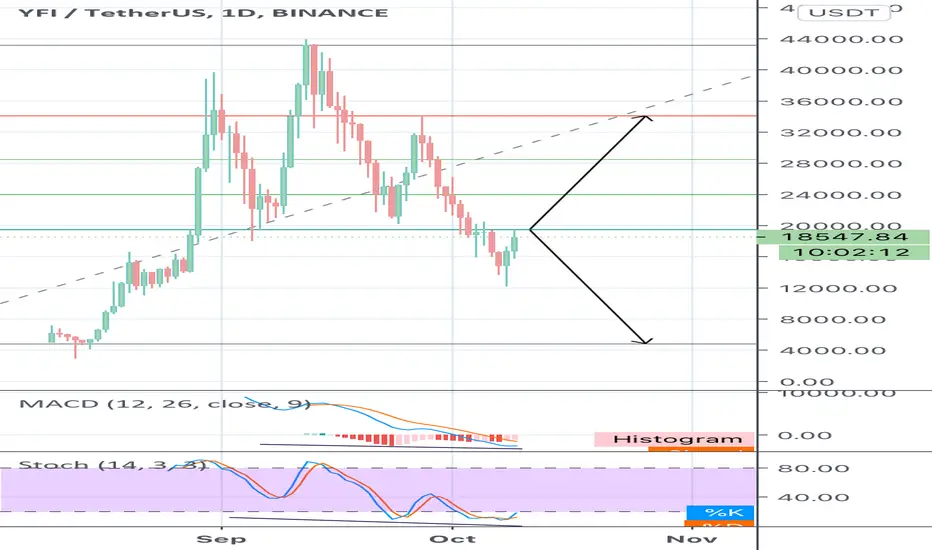
YFI: Imminent Breakout AnalysisIn this post, I'll be providing my technical analysis on YFI, specifically for the Tether (USDT) pair on the daily.
YFI is a decentralized finance (de-fi) coin that has seen immense gains ever since it got listed on Binance
Analysis
- The first thing we can notice is that YFI is consolidating within a descending wedge
- It has been forming lower highs and lower lows for the past few weeks
- However, what's worth noting is that the local support has been tested, and we have seen a breakout in volume
- This adds confidence to bulls who have been accumulating YFI
- The Relative Strength Index (RSI) as well, while still in a overall downtrend, is showing signs of a reversal by forming a higher low
- The Moving Average Convergence Divergence (MACD) shows decreasing bearish histograms, and a potential golden cross
- There are strong support and resistance zones we can identify
- Firstly, we need to break and close above the point where the descending trend line resistance and 0.236 Fibonacci resistance converge
- With confirmation, we could see a breakout with momentum leading up to the 0.618 Fibonacci resistance, and then the ascending trend line resistance marked by the dotted red line
Conclusion
In summary, the fact that there was a volume breakout at the local support level is extremely bullish. Indicators are demonstrating signs of a reversal as well, and we could anticipate huge upside as this coin has a price history of having demonstrated huge momentum.
If you like this analysis, please make sure to like the post, and follow for more quality content!
I would also appreciate it if you could leave a comment below with some original insight.

YFI going to floor?! It was full of challenges from the beginning. Its creator was against buying and selling for profit, and this platform was not designed for this kind of profitability. But the market continued to do the opposite! It quickly surpassed the price of bitcoin, and what if you don't call it a price bubble? I predict that prices will fall in the future much faster. October will be a strange month, during this time be strict about your trades. Thank God. Good luck.

YFI - In the middle of the rangeMissed the bottom, but guessed it perfectly, w/e, waiting for a new scalp setup.
Long around $12.3k again or short at $20k.
Hit the "LIKE" button and follow to support, thank you!
Information is just for educational purposes, never financial advice. Always do your own research.


YFI IS BULLISH TARGET 25910! LOOK AT MY ALL YFI ANALYSIS!!!Hi guys i see some people suggest short on YFI but they are wrong!
Just look at my all YFI analysis they all hit the target
I see YFI as bull signal if price reach 15000 after that we can say bearish! so let see what will happen next!
entry is 16317 then 25910 enjoy!

YFIUSDT going for the pullbackYFI after pumping for more than 7k
needs a pullback for more growth
and everything is going as i expected
u can see proofs in my previous post


Yearn.Finance ($YFI) in an ascending channel Looking at $YFI to see if it can hold this channel. If it can bounce off the bottom of the channel I would target mid of the channel


$yfibtc looks like it will bounce herebottom of falling wedge on horizontal support with hidden macd/obv (and bottom bband). enjoy


YFI resumes upward after possible completion of H&SYFI has made a good volume recovery. I will be waiting for the 8hr retest of the closest S/R line and a good resumption before going long. A safer entry would be the retest and resumption around the 21000 S/R line. It would also be above the EMAs at that point.

Yfi/btc short head and shoulder patternYfi/btc show bearish pattern
Enter short when break of right shoulder
Stop if daily close above the neck of right shoulder
T1 = 1.22btc
T2= 0.7 btc
If you like my idea hit like and show your opinion

YFI set to retest key levelPrice still trending down, it remains to be seen if this bounce is a change in trend. Otherwise HnS is in play and YFI will go to zero.
A small pullback is expected commensurate with a pullback from the pump in most coins.

$btc thoughtssome thoughts, no real bias up or down, been flipping alts,
$xmr $bnb moonage
$loltc soon
$yfi boucne to 20-23k baby!


Will it be different this time? YFI Will it be different this time? Following on from my previous YFI chart. I'm still waiting to go long.
What are everyones thoughts?
RSI is showing a clear bullish divergence.

YFI 12500 or 11700? then 22300? Let see!so i don't see bullish market on YFI after last analysis! so we need go deeper to break RED trend AGAIN!
i think the last station YFI can stay on it is 11700 so keep eye on CHART as always we have GREEN AND BLUE way and i think green is going to happen!
thanks for reading let see what will happen 12500 or 11700? 11700 in my opinion
Good luck Guys! SEE my old YFI analysis! thanks
