YFI/USDT — Multi-Year Demand Zone: Rebound or Breakdown?🔎 Full Analysis
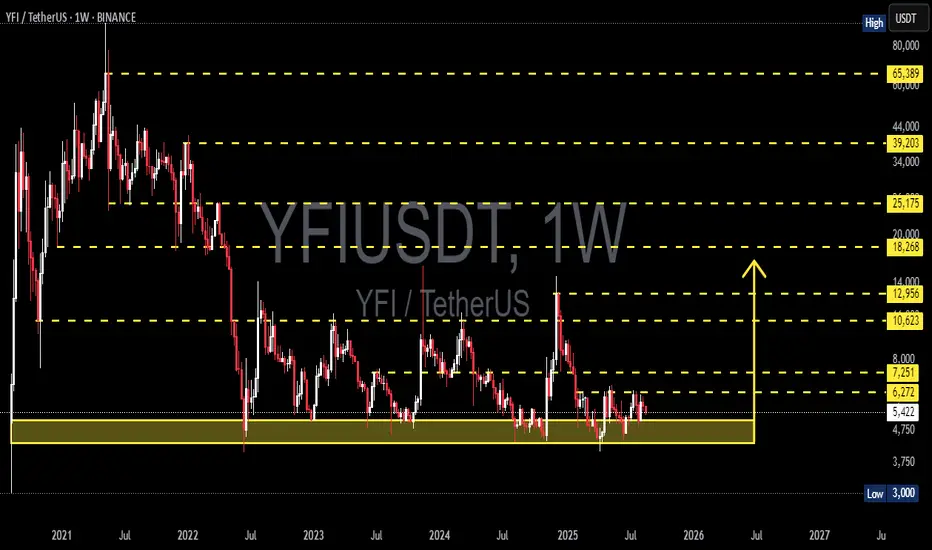
On the weekly timeframe, YFI/USDT is trading right above a multi-year demand zone around $3,800 – $4,750 (yellow box). This area has repeatedly acted as a strong support since 2022, where buyers step in to prevent deeper declines.
After a sharp drop from its 2021 peak, price action has formed a long-term base/accumulation structure, suggesting that while selling pressure has slowed down, there’s still no strong bullish momentum to drive a sustainable uptrend.
Looking upward, we can identify historical resistance levels as key barriers and potential targets if price breaks higher:
$6,272 → short-term resistance
$7,251 → major resistance (bullish confirmation if broken)
$10,623 → $12,956 → $18,268 → $25,175 → mid-to-long term targets
$65,389 → ultimate historical high, only realistic in a strong macro bull cycle
---
🐂 Bullish Scenario
1. Rebound from demand → As long as weekly closes remain above $4,750, buyers can attempt to defend this zone.
2. First breakout trigger → A weekly close above $6,272 opens the door toward $7,251.
3. Momentum continuation → Breaking $7,251 with volume may confirm a shift back into a bullish cycle, targeting $10,623 – $12,956 – $18,268.
💡 Strategy: Swing traders may accumulate within the demand zone with tight stops below $3,800. Conservative traders may wait for a breakout above $6,272/$7,251 before entering.
---
🐻 Bearish Scenario
1. Breakdown of demand zone → A weekly close below $3,800 – $4,750 would invalidate multi-year support.
2. Downside targets → The next major support sits near $3,000, with further downside possible if selling accelerates.
3. False breakout risk → A rally toward $7k–$10k followed by a sharp rejection could send price back into the demand zone, increasing the chance of a breakdown.
💡 Strategy: If breakdown occurs, short setups or waiting for entries at lower supports may provide better risk/reward.
---
📐 Pattern Structure
Accumulation Base / Long-Term Range → price consolidating for multiple years above a key demand zone.
Range-Bound Market → current trading range remains between $3,800 – $7,251.
Decision Point → the longer the consolidation, the more powerful the breakout will likely be.
---
🔑 Key Takeaways
YFI is at a critical decision point: hold above demand or break down to new lows.
Bullish Case: breakout above $6,272 → confirmation at $7,251 → potential rally to $10k – $12k+.
Bearish Case: breakdown below $3,800 – $4,750 → likely move to $3,000 or lower.
The yellow zone = the battleground that will define YFI’s multi-month trend.
---
📝 Important Note
This analysis is based on price action & historical levels. Always combine with indicators (RSI, MACD, volume) and keep an eye on market sentiment (BTC dominance, macro conditions).
This is not financial advice — do your own research before making trading decisions.
#YFI #YFIUSDT #YearnFinance #Crypto #TechnicalAnalysis #SupportResistance #PriceAction #SwingTrading #Altcoin
Yfiusdtanalysis
YFIUSDT 1W AnalysisYFI ~ 1W Analysis
#YFI This is the lowest support block for now. Buy gradually from here with a short term target of at least 20%+ from this support.

YFIUSDT 1WYFI ~ 1W Analysis
#YFI Buy gradually from here with a short -term target of at least 20%+. This is a strong support for now.

YFIUSDT 1WYFI ~ 1W Analysis
#YFI This is the lowest support for now. Buy from here if you still have a Conviction on this coin with a minimum target of 20%+

YFIUSDT 1WYFI Update ~ 1W
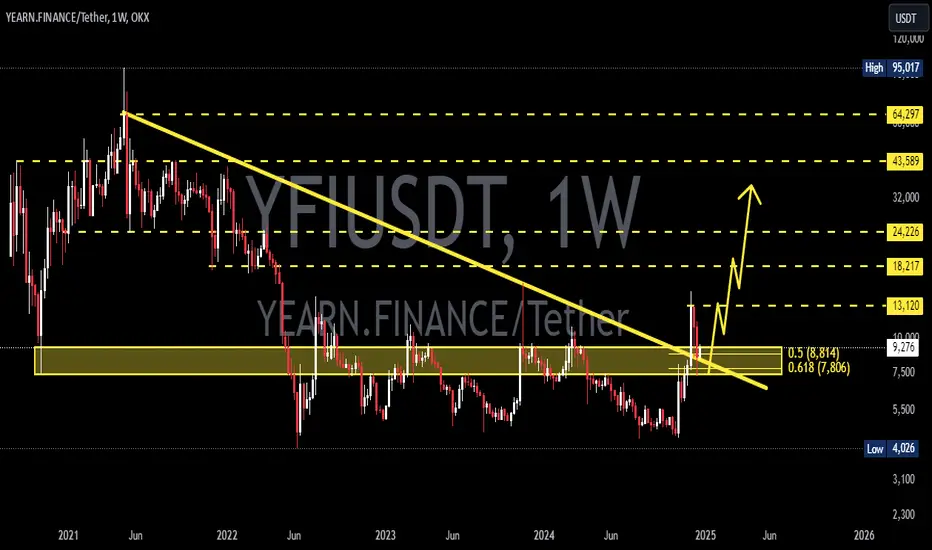
#YFI So far it is still maintaining its Bullish structure. and the current price successfully retested this rupport line + this Golden ratio. Buy gradually from here with a target of at least 20%+ from here.
YFIUSDTYFI ~ 1W
#YFI 1It is at its lowest price currently. if you still have Conviction on this coin. this should be a very good price to start buying again.

YFIUSDTYFI ~ 1W ✅
#YFI Make purchases gradually on this support block. with a minimum target of 20%+ 🟡

YFIUSDT 1WYFI ~ 1W
#YFI So far this support line is holding the price of COINBASE:YFIUSD from falling any lower.
Make purchases gradually in this pattern. with a target of at least 15%+ from here.

YFIUSDT IdeaYFIUSDT - YFIUSD
✅ ✅ Risk warning, disclaimer: the above is a personal market judgment and analysis based on published information and historical chart data on The trading view,
And only some of these analyzes are my actual real trades.
I hope Traders consider I am Not responsible for your trades and investment decision.

YFIUSD Idea | YFIUSDTYFIUSD Idea | YFIUSDT | YFI vs US Dollar |YFI vs Tether
✅ ✅ Risk warning, disclaimer: the above is a personal market judgment and analysis based on published information and historical chart data on The trading view,
And only some of these analyzes are my actual real trades.
I hope Traders consider I am Not responsible for your trades and investment decision.

ADVANCED SETUP ON YFI !!!A beautiful compressing pattern is being completed while the price is going to the end of it. I assume that a huge price action we might see soon.
Meanwhile, I got a trigger to enter on a buy position with the mentioned sl.

YFIUSDT Analysis (LOCAL VISION)Hello friends.
Please support my work by clicking the LIKE button👍(If you liked).Thank you!
Everything on the chart.
Entry: market and lower
Target: 46k - 54k - 57k
after first target reached move ur stop to breakeven
Stop: under 21k(depending of ur risk). ALWAYS follow ur RM .
Risk/Reward: 1 to 4
risk is justified
Good luck everyone!
Follow me on TRADINGView, if you don't want to miss my next analysis or signals.
It's not financial advice.
Dont Forget, always make your own research before to trade my ideas!
Open to any questions and suggestions.

YFIUSDT- Trend Breakout!YFIUSDT (4h Chart) Technical analysis
YFIUSDT (4h Chart) Currently trading at $33695
Buy level: Above $33483
Stop loss: Below $30811
Target 1: $35390
Target 2: $37125
Target 3: $39200
Target 4: $41700
Max Leverage 3x
Always keep Stop loss
Follow Our Tradingview Account for More Technical Analysis Updates, | Like, Share and Comment Your thoughts.

YFIUSDT AnalysisHello friends.
Please support my work by clicking the LIKE button(If you liked).Thank you!
Everything on the chart.
open pos: market and lower
target: 42k - 46k - 50k
after first target reached move ur stop to breakeven
stop: ~33000(depending of ur risk). ALWAYS follow ur RM .
risk/reward 1 to 3
Good luck everyone!
Follow me on TRADINGView, if you don't want to miss my next analysis or signals.
It's not financial advice.
Dont Forget, always make your own research before to trade my ideas!
Will be very APPRECIATE FOR UR DONAT/coins :)
Open to your questions or suggestions(Looking for investors!).

YFIUSDT AnalysisHello friends.
Please support my work by clicking the LIKE button(If you liked).Thank you!
Everything on the chart.
open pos: 41-42k
target: ~50k
stop: ~38k (depending of ur risk). ALWAYS follow ur RM .
risk/reward 1 to 2.8
Good luck everyone!
Follow me on TRADING View, if you don't want to miss my next analysis or signals.
It's not financial advice.
Dont Forget, always make your own research before to trade my ideas!
Open to your questions or suggestions(Looking for investors!).


YFI 1D Careful with long, active sales started, drawing PinbarWe missed something about YFI and haven't analyzed it for a long time, but in vain)
YFIUSDT price came to life and soundly updated the maximum, new ATH $95,000
After yesterday's strong growth, today at the daily candlestick, the price of YFIUSD begins to draw a pinbar. And if today the value of the token of the Yearn.finance project closes in the range of $80-85K, then a Pin bar will finally form, which in turn will be perceived by traders as a strong reversal signal.
The consequences of a reversal after such growth are difficult to assess, however, we note that the strong liquid zone where YFIUSDT longs were accumulated is $30-44 thousand. If we take a little narrower, then the range of $34,000-37,500 can be considered a tasty zone for investment long term.
_______________________________
Since 2016 , we have been analyzing and trading the cryptocurrency market.
We transform our knowledge, trading moods and experience into ideas. Each "like under the idea" boosts the level of our happiness by 0.05% . If we help you to be calmer and richer - help us to be happier :)
