Dow Futures (YM) Looking for 5 Waves Elliott Wave Move LowerCycle from 12.13.2022 high in Dow Futures (YM) is unfolding as a zigzag Elliott Wave structure. Down from 12.13.2022 high, wave A ended at 32686. Wave B rally ended at 34487 as the 90 minutes chart below shows. Internal subdivision of wave B unfolded as a zigzag structure in lesser degree. Up from wave A, wave ((a)) ended at 33663 and dips in wave ((b)) ended at 32750. Index then extended higher in wave ((c)) as a 5 waves diagonal. Up from wave ((b)), wave (i) ended at 33613 and dips in wave (ii) ended at 32943. Wave (iii) ended at 34080, wave (iv) ended at 33489, and final leg higher wave (v) ended at 34487 which completed wave ((c)) and B in higher degree.
Wave C lower is currently in progress as an impulse structure. The Index still needs to break below wave A at 32686 to confirm this view. Down from wave B, wave (i) ended at 33916 and rally in wave (ii) ended at 34131. Wave (iii) ended at 33318 and expect rally in wave (iv) to fail and Index to extend lower in wave (v) to complete wave ((i)). Afterwards, it should rally in wave ((ii)) to correct cycle from 1.16.2023 high before the decline resumes. Near term, as far as pivot at 34487 high stays intact, expect rally to fail in 3, 7, or 11 swing for further downside. Potential target lower is 100% – 161.8% Fibonacci extension of wave A. This area comes at 30385 – 31952 from where buyers can appear and Index can start to resume higher.
Ym

ES Looking For Support Near 3920 - Then LIFTOFFPay attention. Today will likely be a large range bar - possibly with a deep low near 3920.
My SPY cycle patterns call today a "Major CRUSH". That means we could see a very large price range today.
Combined with other SPY Cycle patterns, I believe the ES will attempt to establish a base/bottom - retesting recent lows.
As we move into 2023, be aware that cycle trends have shifted. We are entering a Wave-5 bullish price trend.
This Wave-5 trend may not result in new all-time highs this year, but we should see a solid recovery/reversion back to the upside.
There are still risks related to the global banking/credit system, so stay cautious of crisis events.
Follow my research. Pay attention to the clear market data - not the perma-bears that continue to tell you a "major crash" is about to happen.
After today, we move into more bullish consolidation as Earnings start to hit.

SPY Fibonacci & TA. Bullish Target Above $410.For everyone interested:
Expect volatility to be king over the next few weeks (earnings and economic data).
SPY reaching a major APEX in price trend. It is very likely to resolve to the upside, but that means we have to be prepared for "false breakouts".
Fibonacci price trends suggest current trend is BULLISH (closing GAPS). The upper GAP may be the next target on a strong rally phase.
Don't play around with this trend. If you are SHORT - PROTECT YOUR CAPITAL.
Economic data continues to suggest the US markets will resolve to the upside if inflation trends continue to weaken.
Follow my research & videos.
I've been trying to warn you about the start of a Wave-5 rally for more than 5+ months.

Levels of the Week (Week 1) by DowhausPrice movements in Week 1 confirmed two levels for future references: 33498 and 32990.
Both levels are below closing price of Week 1.

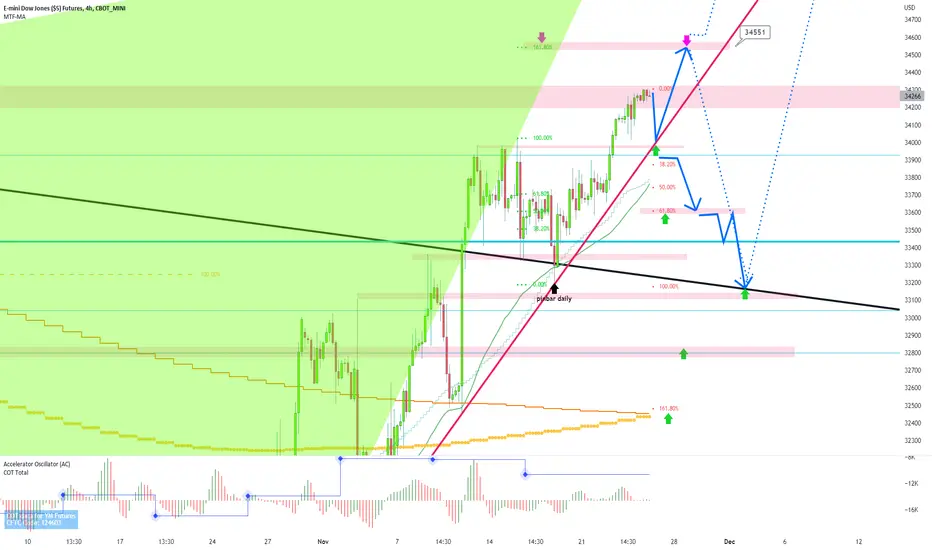
Dow 4hour say = fibo 61% is dow 1st target ,it can go to 38000STRONGLY ADVICE DONT PICK SELL ABOVE EMA200 DAILY 32700
dow frist want touch fibo61%=34200 but in next 6 month it can go to fibo 161% near 38000 so 90% looking for buy but very low size
good luck

SPY Cycle Patterns For 2023Here we go. Starting out 2023, my SPY cycle patterns show a solid RALLY phase sets up on Wednesday/Thursday.
Time to get ready for a strong reflation trade to start 2023. Possibly breaking above resistance channels and rallying to NEW ALL-TIME HIGHS.
Follow my research.

YM is on a unpredictable spot and you should wait Dow Jones is reaching an area of uncertainty.
YM has moved into a trading range for weeks.
A break through the 209 MA will signal a good opportunity for a Short move

Global Markets Are Setting Up A MAJOR BOTTOM For 2023+US/Global markets are actively seeking a bottom at this point.
We've witnessed the largest unwinding of global excesses since the DOT COM bubble and, before that, the 1929 market peak.
Use this symbol to experiment with market trends/setups: (TSLA + ARKK + ARKW + ARKQ + GME ) / 5
In my opinion, the deep selling is nearly over. This chart shows the custom symbol is very close to the center level on the historical Pitchfork and very close to a 1.0 (100%) Fibonacci extension from 2016 to 2019. I suspect the unwinding of the global markets is very close to a BOTTOM right now.
2023 could be very explosive, considering the extreme downside pressure we've seen over the past 15+ months.
Think about this for a few minutes...
_This chart shows price is currently AT or BELOW 2016~2018 center Std Dev levels. It may move a bit lower before actually finding a bottom.
_This price level represents a pre-2019 earnings/revenue expectation (ignoring the past four years of progress).
_The US Fed has already disrupted inflation trends and will likely shift towards more moderate policies in H1:2023.
_This was not an excess bubble as much as it was a speculative bubble during the COVID supply disruption.
Now, we shift back to more normal Revenue/Growth expectations. The US/Global markets are actively seeking a bottom RIGHT NOW. The reversion/reflation trade (bullish) could be very powerful.
---- ------------------------------------------------
Precious Metals will continue to appreciate - just like what happened in 2002~2005+. We are in the early stages of a reflation cycle (post COVID speculative bubble).
The bubble has burst. Prices have deflated. A reflation rally is very likely unless some global crisis event disrupts the global economy. Gold and Silver will likely rally 35% to 55% higher over the next 2+ years (possibly higher).
This is just like 2002~2005 all over again.
-----------------------------------------------------------------------------------------------------------------
I believe it is time to start initiating "TOKEN" positions in deeply undervalued Technology, Energy, Consumer Staples, Healthcare, and other "relation" sectors.
Follow my research.

Weekly Analysis 12/18After a crazy, news heavy week, I expect price to begin bullish, and end bearish. Next week, we have the Consumer Confidence, GDP, and PCE releases. It will be interesting to see if we do in fact see a santa rally to finish the year off. In ICT fashion, I expect the high of week to be made on tuesday / wednesday.

New SPY Cycle Patterns Headed Into Christmas 2022Pay attention to the very real possibility that the current GAP will be filled early this week as price attempts to find a base/bottom after last week's selling.
I expect moderate volatility and a change of trend as we move closer to Christmas. Initially, we'll see some moderate downward price pressure, then we'll see a shift upward near the end of this week.
12/18/2022 Inside-Breakaway
12/19/2022 POP
12/20/2022
12/21/2022 Top/Resistance
12/22/2022 Flat-Down
12/23/2022 MntmRally-012
12/24/2022 GapUp-Lower
Remember, stay protected and stay safe as volatility may be excessive over the next few weeks. 2023 looks very interesting. Follow my research to learn more.

Watch for Flag Support near 3932.Markets are digesting the Fed rate increase and consolidating in an uptrend.
Watch for Flag support near 3930~3932.
Bias should still be BULLISH right now.
Protect your capital as we move into end of year trading. Don't get aggressive with trades.
Follow my research.

US Stocks are about to EXPLODE higher. Here we goThe reflation trade in the US stock market (Wave-5) is about to explode above the GREEN resistance line.
Far too many people continue to believe the US markets will collapse on some Fed/Economic crisis event. What they don't understand is the US is in a different position right now.
Yes, deflation trends may continue for REAL ASSETS (homes, cars, commodities, others), but as long as the US economy continues to tick along (employment, wages, consumers), billions of dollars every month flow into IRAs, 401Ks, and other investment assets.
This is what I call the "economic bias" related to money flow and US dollar depreciation. Over time, the natural process of the US/global economy is to GROW - not CONTRACT.
Therefore, we need to be prepared for a reflation trade (similar to 2003-05 when the US markets move upward after the 9/11 event).
Follow my research.

ES support @ 4018 now becomes critical trigger levelThis big rotation to the upside, after the CPI number, presents a new $4018 support level on the ES for traders.
The Fed rate decision tomorrow may send markets briefly below this level, but watch for a reflation trade to setup after the Fed comments.
If my research is correct, a melt-up trend has already been established. I expect the US Dollar to melt back above 105 while Gold and Silver continue to melt upward as well.
The US markets may continue this upward trend into Q1:2023.
Follow my research.

SPY Cycle Patterns For Dec 12, 2022 - More sideways melt-up.Here are the SPY Cycle Patterns for this week.
Expect more sideways melt-up trending as we head into the Fed rate decision and key economic data.
Traders will start to shift into early 2023 expectations this week (after the Fed). Check out my other posts.
The markets are not expecting anything extraordinary right now - more of the same.
The Fed rate decision will likely come in between 50pb and 75pb (as expected).
All of this has been BAKED INTO the markets already.
I can tell you what I'm seeing out here in So. Cal... Shoppers EVERYWHERE. Traffic is a mess. Lots of our of state cars everywhere. Malls and shopping centers seem packed.
From what I can see, Q4:2022 will probably stay very solid for retail and online shopping. Unless there is some catalyst to BREAK the markets, US stocks should slide into 2023 with fairly strong expectations.
Follow my research.

ES Critical Zone - 3990-3995. Watch for a melt-up trend this wee#ES 60 Min Zones for this week.
Support: 3912 & 3960
Resistance: 4018, 4058, & 4101
Trigger Zone: 3990~3995
I expect a melt-up to continue as expectations for 2023 settle into the EOY trends - likely attempting to break resistance at 4058 & 4101.
Follow my research.

E-MINI DOW JONES ($5) FUTURESE-MINI DOW JONES ($5) FUTURES
A very strong landing as we analyzed and broke the forces of the zones of support and demand and God willing to continue landing

DXY will find support above 103.70As the global economy continues to recoil after the US Fed rate increase - watch for the USD/DXY to find support above 103.70 and flag sideways/higher over the next 15+ weeks.
I suspect any continued Fed rate increases will put further pressure on global markets/currencies and drive foreign investment in USD assets throughout 2023.
Yes, the US economy is contracting - which is exactly what the Fed wants (breaking inflationary trends). But, that does not mean the US economy is CRASHING.
What is happening is the strength of the US economy/USD is creating a capital-shift we've not seen since the early 2011~2013 bottom.
Foreign investors are rushing away from risk - towards safety, security, & ROI. That means they are seeking the safest, strongest economy on the planet, with the best chance of ROI.
I believe that is the US economy (the strongest on the planet) which is currently ON SALE at a 40% to 70% discount.
Pay attention.

SPY Cycle Patterns for Dec 5 thru 9 - A Flat Sideways Melt-upI love the fact that traders are messaging me asking questions regarding my SPY Cycle Patterns. Thank you.
I hope all of you are starting to see some value from my research and using it to profit from some of these moves higher.
Right now, and probably until next week (Dec 12 of later), the markets will probably slide into a fairly volatile sideways melt-up phase. I'm expecting a 4 to 6%+ volatility range over the next 7+ trading days before some catalyst sends the markets higher.
I've listed all the SPY Cycle Patterns for December below. I've highlighted the key days (**) that I believe will create a bias trend in December. The other patterns may still represent upward trending and volatility.
12/1/2022 Flat-Down
12/2/2022 Harami-Inside
12/3/2022 Tmp-Btm-102
12/4/2022 GAP22 Potential **
12/5/2022
12/6/2022 Top
12/7/2022 Flat-Down
12/8/2022 Break-Away
12/9/2022 Carryover
12/10/2022 Tmp-Btm-102 **
12/11/2022 Top/Resistance21
12/12/2022 Consol-210
12/13/2022 Tmp-Btm-102 **
12/14/2022 GAP-Reversal
12/15/2022 Breakdown201
12/16/2022 Break-Away **
12/17/2022 Carryover
12/18/2022 Inside-Breakaway
12/19/2022 POP **
12/20/2022
12/21/2022 Top/Resistance
12/22/2022 Flat-Down
12/23/2022 MntmRally-012 **
12/24/2022 GapUp-Lower
12/25/2022 Rotation
12/26/2022 GAP-Reversal
12/27/2022 Breakdown201
12/28/2022 MntmRally-012 **
12/29/2022 GapUp-Lower
12/30/2022 Top
12/31/2022 Flat-Down

The Santa Rally Continues - Don't get stuck in Perma-Bear modeFar too many people got burned over the past 24 hours by betting the FARM on the Fed coming out Hawkish.
I was chatting with a guy on Twitter last week about his call for a deep selling phase (possibly reaching COVID lows) in the US markets. His followers got burned by today's move (some really badly).
You have to shift with the market trends and prepare for the unexpected.
My research kept my followers away from risks and has been pointing towards a Wave-5 rally setting up in the US markets for many months.
I use my Custom Indexes to get a better "feel" for how the markets are reacting to various inputs/outcomes.
My Rotational Modeling system has been cautious for more than 14+ months - off only -6% for 2022. Many other Hedge funds are off by at much as -40% to -60%.
Days like today, if you were lucky enough to survive them, will teach you a few lessons...
Don't get married to a trend
Protect capital at all times
READ THE DATA - not the emotions
Price can fool you - so protect your position.
Follow my research.. Or, at least, check out my content before you decide to place your trade.
Check out my SPY Cycle Pattern posts. Ask questions if you have them.
This move isn't over yet.

SPY Cycle Patterns for Nov 28 Thru Dec 2 - A Sideways Melt-upThis week, I expect a bit of a sideways melt-up before the Dec 7 start of the Santa Rally.
The markets are digesting the post Thanksgiving trends and may continue to stay in a fairly narrow range over the next 7~10+ days.
I do believe a critical Fibonacci inflation point is likely before Dec 7~10 - prompting a moderately strong Santa Rally phase to start.
Reading some of the comments on Twitter, analysts and various traders seem to be all over the place. Some are calling for a massive price collapse to take place. Others are suggesting a new rally phase will take place.
What I can tell you is that, which you should be watching my Youtube videos to follow my Custom Indexes, global traders are shifting capital away from global risks and into US Dollar based assets. This trend will likely continue for many months still.
The unwinding of global speculative excesses (particularly in nations which saw big increases in home values - think China/Asia, Canada, others) and/or those caught in the pre-Covid excess credit/debt trap (the cheap USD carry trade) will likely continue to struggle as the "revaluation event" puts even more pressure on these foreign markets.
Canada is an interesting example. A fairly strong economy that saw a big increase in wealth, asset valuations, and investments before, through, and even after COVID. The excesses were fueled by a global speculative phase (rising prices), almost like a "tulip bubble" where everyone through "I can't miss this incredible opportunity"... So they jumped in AT ANY COST.
Just like what we saw with Bitcoin, the downside to that rally may be a -50% to -70% decline of certain assets over time.
One must try to understand that when an environment of weaker asset growth (homes and other tangible assets) settles in throughout the world, capital will seek three things:
Safety
Security
ROI
You can't find these three things in extended underperforming assets (think China/Asia, Canada, others). That capital MUST move towards any economy that will contract the least, has the strongest base valuation correlation, and has the potential for moderate earnings, revenues, and RECOVERY.
In my opinion, that is the US, UK, and possibly Japanese markets.

dowjones 4hour : all scenario on dow 1-70% go down and touch support and go up to fibo161
2-30% go down break support and go downer
above green arrow after pinbar come on 1hour or 4hour or daily chart we must buy Sl: pinbar low and hold to new high ok?
if you have old sell,you must close all or hedge them in fibo50 33760-33770...dont forget dow,index, dax sp500 and gold love buy and uptrend so sell on them is very very dangerous..check weekly chart exactly
note: as predict 10 days ago in low dow can go to 35000 even 3600 so be careful from sell and 90% looking for buy
ALERT: END OF YEAR UP TREND RALLY ON INDEX LIKE DAX NASDAQ SP500 AND DOW CAN START
good luck
SPY Cycle Patterns For Thanksgiving Week - Sideways Melt-UpHere you go. This week I expect the markets to melt upward with a couple of bottom/momentum bottom patterns as well as holiday trading liquidity.
This week may see some volatile price swings, but overall I believe the US markets will continue to melt upward.
As we near the end of the year, I expect some traders to try to pull out of positions (anchoring in tax losses) and repositioning early in 2023.
Enjoy your holidays with family/friends.
Follow my research if you are looking for more detailed analysis of the US/Global markets.

DOW 4hour : year end rally can start, dow can go up to 36000strongly advice dont pick sell, looking for buy signal and buy pinbar for hold to new high
if you have old sell you must close all near 33000
good luck
