Elliott Wave View: Pullback in Dow Futures (YM) to Find SupportShort term Elliott Wave View in Dow Futures (YM) suggest cycle from March 2020 low remains intact in a 5 waves impulse Elliott Wave structure. The 45 minutes chart below shows wave ((4)) of this impulse ended at 32891. The Index has turned higher in wave ((5)) with the internal unfolding as another impulse in lesser degree. It still needs to break above previous wave ((3)) peak at 35000 on May 10 peak to rule out a deeper correction. Up from wave ((4)) low, wave (i)) ended at 33380 and pullback in wave (ii) ended at 33289.
Index resumes higher in wave (iii) towards 33863 and dips in wave (iv) ended at 33627. Final leg higher wave (v) ended at 33962 which also completed wave ((i)). Pullback in wave ((ii)) ended at 33752. Index then resumes rally higher in wave ((iii)) towards 34240, and pullback in wave ((iv)) ended at 34133. Final push higher in wave ((v)) ended at 34411 which completes wave 1 in higher degree. The index is now correcting cycle from June 21 low in wave 2 before the rally resumes. As far as pivot at 32891 low stays intact, dips should find support in 3, 7, or 11 swing for more upside.
Ym

we have sell signal in dow but with SL trend is powerfull up to 36000 ,but dow can see this 2 pullback (green arrow buylimit place with sl=80)
winrate in 100 pos =70 tp - 30 sl
if you cant put 80 point SL (trailstop=80) dont pick these
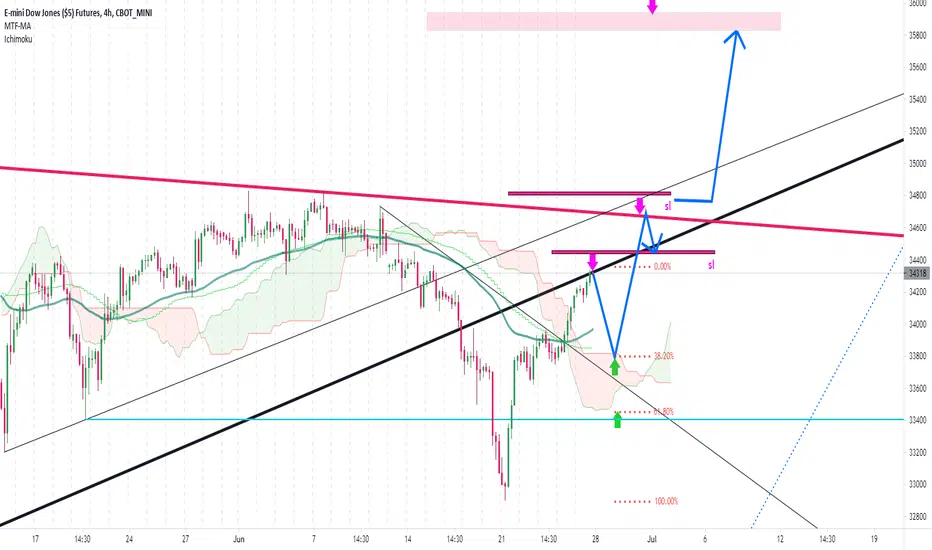
we predict down currection if ...daily chart clearly show sell , we have 2 trend line in down , technical say if dowjones can break them ,down trend will start ,can go to 28500 (big gap on cash phisical dowjones)
www.tradingview.com
red arrow=powerfull sellimit place with sl and trailstop= 80
green arrow=buylimit place with sl and trailstop=80
if big trend (daily chart trend line start from corona crash) near 33900 break , you can sell
us exclent GDP will shoot dow to 353006.4 GDP for US after corona is real miracle , this mean in next months we will see 8.5 even 9 too
prnt.sc
source=forex factory
fibo extention show dow target is 35300 ok? (next can reach 37000 soon),we strongly advice stand on buyside, looking for buy ,dont pick sell signals in next 10 day
www.marketwatch.com
dow reach fibo 61%,for W shape mast go down like FDAX1! dow love fibo 61% so we predict pull back
AC 4hour turn red too
note= 5% tolerance possible to reaction ,if you see this post and dow is in green box,you can sell
100% put SL=80
ALERT= if bad news comes ,dow can break low and crash downer

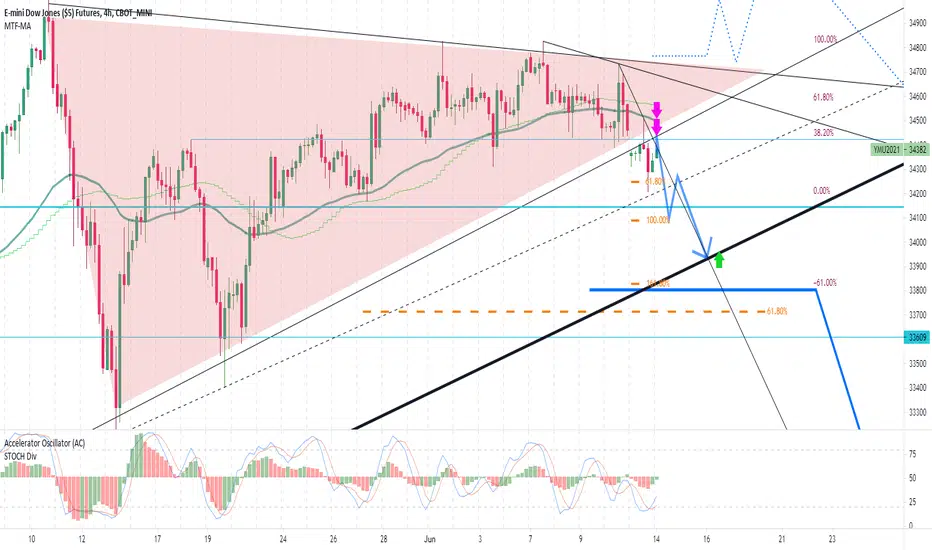
now dow have powerful sell sl=100point trail stop=100point tp= min 34000
green arrow=buylimit place with sl=100
orange fibo in left = trend base FIBO EXTENTION (projection)
for load it on metatrader right click or up,drawing tools, then load FIBO expantion (this tools good on zigzag market like dow and dax not good for trendy markets like gold)
draw it on last N shape in 30min chart(for day trader) for longterm trader draw it on 4hour chart
on your real ,if you pick profit from this signal , please send 5% of profit , CHEAR (coin) above my profile
www.tradingview.com
GOOD LUCK

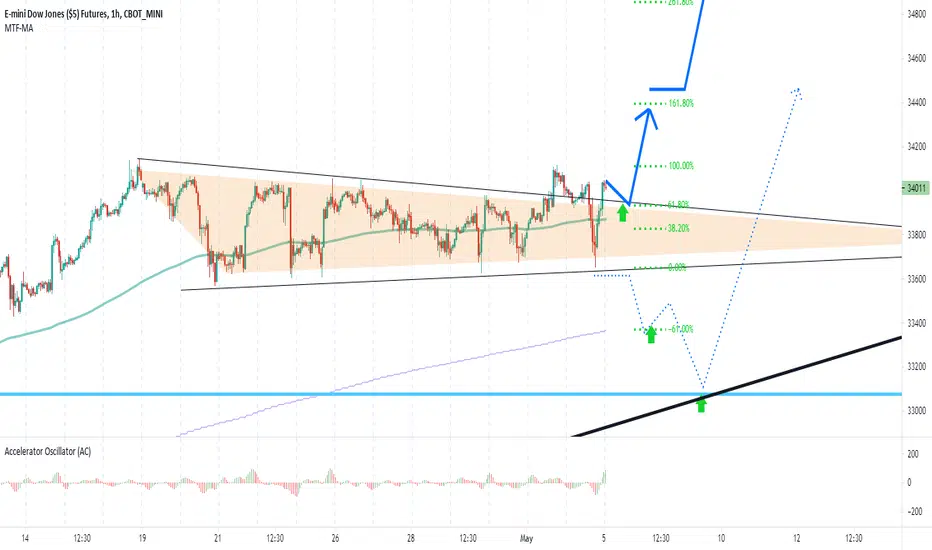
we more exactly recalculate=100% dow will crash in coming days after bad NFP news and big unemployment 6.1% seller pressure ,affect of negative news will be big
100% dow will see 34000 (100% put buylimit with sl=100)
90% dow will touch 33100 (100% put buylimit with sl=200)
keep monitor AC accelator occilator (if your platform dont have it ,search it in google or use stoch 7.4.4) on 240-30min chart is very very important, when AC 4hour is red,looking for sell
technical big trends + fibo 161% show 33100 ,save this number in your mind,you will see it soon (golden place for buy and hold 20-30 day)
advice = dont pick buy above 34000 , if you have buy close it now ,looking for sell ,bet you dow little can go up BIG CURRECTION comming in next days will clean all green candel in 30-60 min

we bet ,time to sell dow and wait 8 day NFP unemployment 6.1% news comes very very bad , in comming week it will push down market,dow,dax,sp500
if you draw trend base FIBO extention(projection) on last N shape,you will see it reach level 161%(most important level on fibo extention)
we advice for next 10 day =looking for sell but put SL=100point,if you eat 2-3 SL dont fear ,continiue looking for sell ,after go 100 point to profit,move sl to open price,shot down platform ,then 4-5 day go and rest ,give time to it go down)
www.marketwatch.com

Is DowJones Futures ready to move to newer high?So far Dow Jones Industrial Average is showing strength while Nasdaq showing weakness. Similar to what happened during February. Dow futures have been in tight range since last two weeks, maybe this week it is ready to breakout?

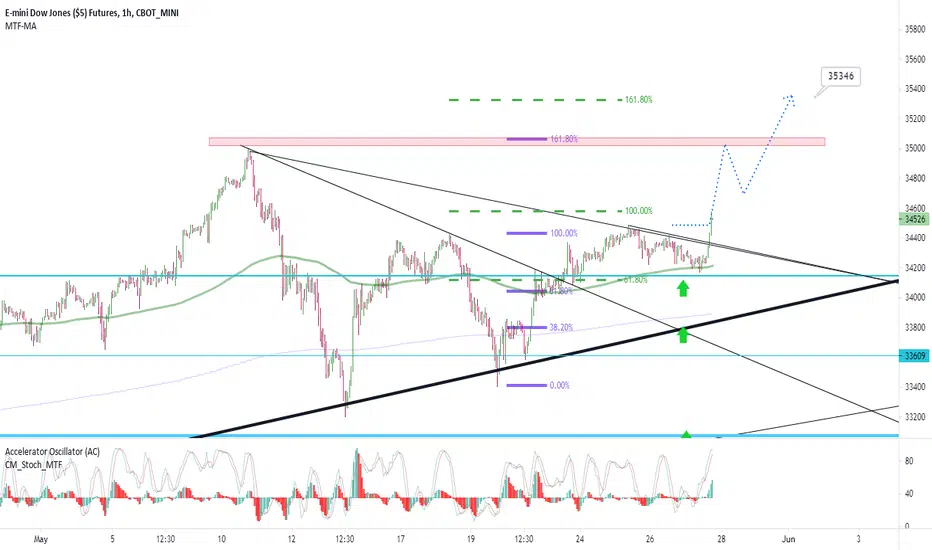
ALERT=WE PREDICT DOW =35000for next days target 1=34400
looking for buy ,dont open sell ,dow in way to 40.000 very exclent company earnings give is super energy +
for next days we advice = dow is full , looking for buy on gold and germany index dax ,both in + trend ,can grow above 20%
FDAX1!
GC1!

SPX500 Index Testing Channel TopThe markets follow the channels like train tracks, use them like support and resistance to guide you

Dow jones generational top is inThis is it, I think the big one is coming. Easy short here not even worried, I cannot believe how easy this short trade is going to be.

YM UpdateIf the Dow gaps up tomorrow, I'm probably shorting it (or maybe just a component like DIS or MMM). I don;t expect it to tank thoughh.
Stocks Spread OutNQ just completed a head and shoulders. That can mean anything, but it sure makes things interesting.
RTY has clearly taken the lead in relative strength since the markets bottomed in march.
More money is going to a larger group of stocks in RTY, and it looks like the tech bubble is paying for it.
Tech bubble:

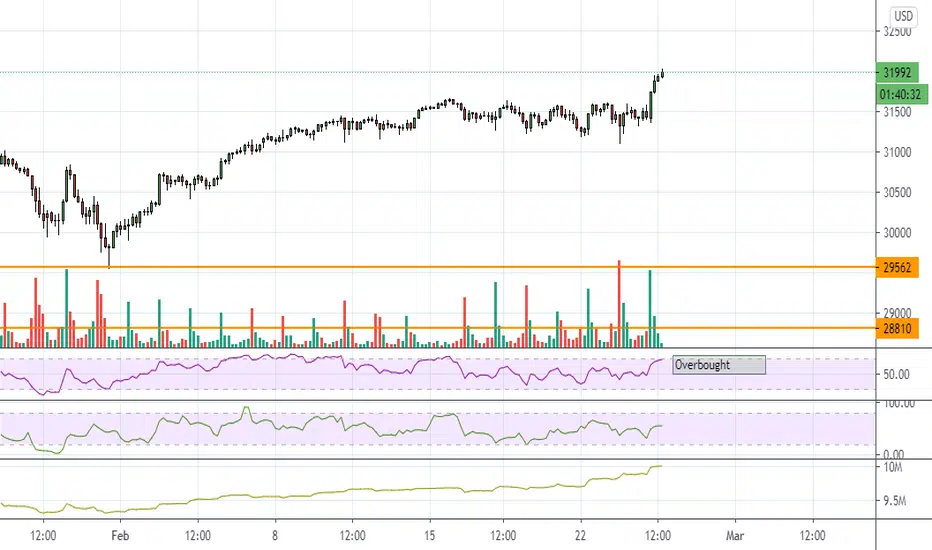
DOW ATHI don't pay as much attention to the DOW as the other indices, bit it broke out to a new high, so there's no reason why the other indices can't. That being said, RSI is overbought.
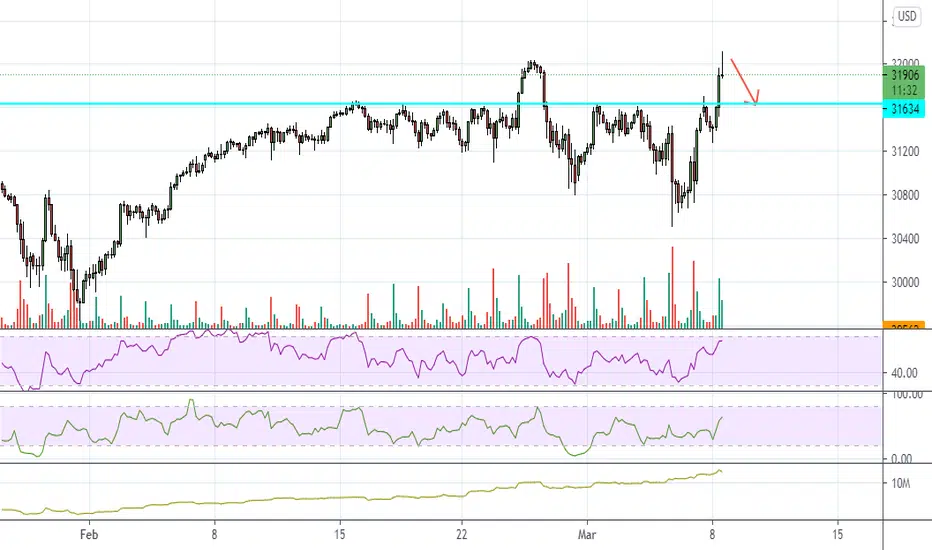
Elliott Wave View: Dow Futures (YM) Should Continue to Print AllDow Futures (YM_F) continues to make a new all-time high and the Index should see further upside. Short term Elliott Wave suggests the rally from February 1 low is unfolding as a 5 waves impulse. Up from February 1 low, wave 1 ended at 31662 and pullback in wave 2 ended at 31100. The internal subdivision in wave 2 unfolded as a double three Elliott Wave structure. Down from wave 1 at 31662, wave ((w)) ended at 31228 as a zigzag. Index then pullback in wave ((x)) which ended at 31615, then it resumed lower to end wave ((y)) at 31100 with internal as a zigzag. This move lower completed wave 2 in higher degree.
Index has resumed higher and broken above wave 1 high, suggesting the next leg higher has started. Rally from wave 2 low also looks impulsive and incomplete. Expect a few more highs to end the 5 waves up from wave 2 low and end wave ((i)) of 3. Index should then pullback in wave ((ii)) of 3 to correct cycle from February 23 low before the rally resumes again. As far as wave 2 pivot low at 31100 stays intact, expect dips to find support in 3, 7, or 11 swing for further upside.

YM30 Dowjones industrial average LONG signalNice support levels in there . Long term bull market, expect stop loss hunts as all it does that... nothing special.


YM30 Dow jones LONG signalThis is incredible trend.... i guess its a pandemic amazing results for all companies right ? :D

YM30 Dowjones industrial average REVERSAL SHORT SIGNAL (counter)PRICE REVERSE... BIG DROP 300 TICS OR MORE !

YM30 Dowjones industrial average LONG signalSpiking channel breakout , (FLAG) . Pretty easy to see..

Elliott Wave View: Dow Futures (YM) Remains Bullish as We End YeShort term Elliott Wave view on Dow Futures (YM) suggests the rally from October 30 low is unfolding as a 5 waves impulse Elliott Wave structure. Wave (1) of this impulsive rally ended at 30333 and pullback in wave (2) ended at 29308. The Index has resumed higher in wave (3). Up from wave (2) low at 29308, wave ((i)) ended at 30198 and wave ((ii)) pullback ended at 29735.
Index then resumed higher in wave ((iii)) which subdivide into another 5 waves of lesser degree. Up from wave ((ii)) low, wave (i) ended at 30182 and dips in wave (ii) ended at 29956. Wave (iii) ended at 30418, wave (iv) ended at 30278, and final leg wave (v) of ((iii)) ended at 30502. Wave ((iv)) pullback is currently in progress as a zigzag where wave (a) ended at 30166 and wave (b) ended at 30416. Expect another leg lower in wave (c) to complete wave ((iv)) before Index resumes the rally again. Potential target for wave (c) of ((iv)) is 100% – 161.8% Fibonacci extension of wave (a) which comes at 29877 – 30083. From this area, the Index can extend higher or bounce in 3 waves at least. As far as December 21 pivot low at 29308 remains intact, expect Index to extend higher.
