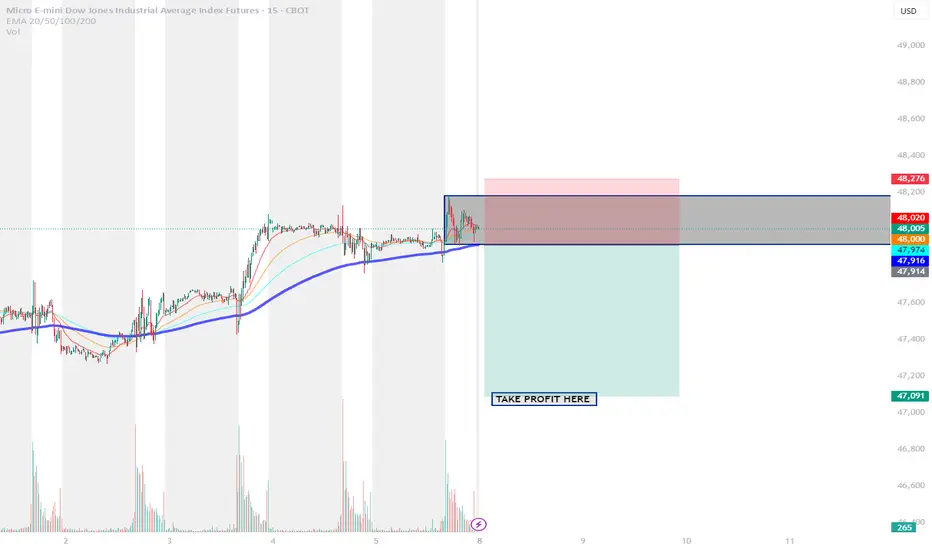
DOW JONES Triangle started a Bullish Leg.Dow Jones (DJI) has been trading within a Triangle pattern on the short-term, with the price making a Higher Low on Wednesday on its bottom. With the 4H RSI rebounding just after it breached below the 30.00 oversold barrier, we expect the pattern to start its new Bullish Leg now.
A +1.30% rise to test its top (Lower Highs trend-line), would still be a minimum based on all the Bullish Legs that preceded. As a result, our short-term Target (unless the 4H MA50 rejects the uptrend) is 48650.
---
** Please LIKE 👍, FOLLOW ✅, SHARE 🙌 and COMMENT ✍ if you enjoy this idea! Also share your ideas and charts in the comments section below! This is best way to keep it relevant, support us, keep the content here free and allow the idea to reach as many people as possible. **
---
💸💸💸💸💸💸
👇 👇 👇 👇 👇 👇
YM1

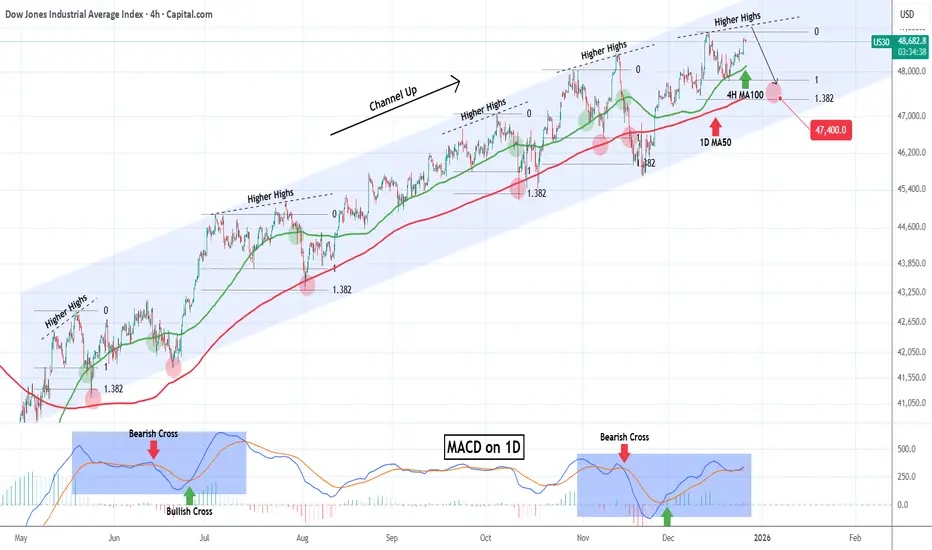
DOW JONES headed towards a rejection.Dow Jones (DJI) has been trading within a nearly 8-month Channel Up and is close to its All Time High (ATH) after rebounding last week on its 4H MA100 (green trend-line).
This pattern is cyclical and every time the latter support broke after a medium-term rally from its 1D MA50 (blue trend-line), the index got rejected on a Higher Highs trend-line and corrected back to the 1D MA50. Even the 1D MACD is printing a sequence similar to June - July.
As a result, we expect the new year to find Dow on its 1.382 Fibonacci extension at 47400 at least, which is the Fib level that every such correction pulled back to.
---
** Please LIKE 👍, FOLLOW ✅, SHARE 🙌 and COMMENT ✍ if you enjoy this idea! Also share your ideas and charts in the comments section below! This is best way to keep it relevant, support us, keep the content here free and allow the idea to reach as many people as possible. **
---
💸💸💸💸💸💸
👇 👇 👇 👇 👇 👇
YM1! DOW JONES E-MINI FUTURES - THE POST-FED BLUEPRINTDecember 10, 2025 | by officialjackofalltrades
🟢 BULLISH | Fed's "Hawkish Cut" Creates Opportunity
EXECUTIVE SUMMARY - THE FED DECISION IS IN
Current Price: $47,913 | Date: December 10, 2025 - POST-FOMC
The Dow Jones E-mini futures just experienced a historic moment :
The Dow gained 497.46 points, or 1.1%, to close at 48,057.75 following the Federal Reserve's decision to lower rates by a quarter percentage point, putting it in a range between 3.5%-3.75%.
But here's what NOBODY is talking about: This was a "hawkish cut" with three "no" votes, which hasn't happened since September 2019. Yet the market RALLIED .
Why? Because the "hawkish" part was already priced in.
The Technical Setup:
Pattern: Ascending channel (intact since November)
Current Position: Testing mid-channel at 47,700-47,800
Resistance: 48,100-48,300 (upper channel boundary)
Support: 46,800-47,00 (mid-channel), 46,500-46,100 (lower channel)
Breakout Target: 48,000-48,500
The Fed Backdrop:
Powell said "We are well positioned to wait and see how the economy evolves"
Translation? The Fed is DONE cutting for now.
But here's the twist: Fed funds futures suggest around a 68% chance the central bank will cut rates two or more times in 2026. The market doesn't believe Powell!
The Trade: Long from 47,700-48,300, target 48,000+
🔎 MARKET CONTEXT - THE FED'S "HAWKISH CUT" PARADOX
What Just Happened (Last 6 Hours)
At 2:00 PM ET today, the Fed delivered exactly what was expected: 25-basis-point reduction from 3.75-4% to 3.50-3.75%.
But the details were hawkish:
Three dissenting votes (Cleveland Fed President Beth Hammack voted against, plus two others)
Dot plot indicated just one more cut in 2026 and another in 2027
Seven officials indicated they want NO cuts next year
Powell called it a "very challenging situation"
The Market's Response?
Dow jumped 497.46 points (+1.1%) to 48,057.75. Why rally on hawkish news?
Answer: Because the hawkish tone was already priced in from the pre-meeting leaks and October's dissenting votes. The market expected worse .
The Internal Fed War
Asked about the elevated level of dissenting members, Powell emphasized that everyone on the FOMC agrees that inflation is still too high, and that there are also risks to economic growth.
This Fed is more divided than any time in recent memory :
Hawks (7 members): Want ZERO cuts in 2026
Centrists (5 members): Want 1-2 cuts in 2026
Doves (7 members): Want 2-3 cuts in 2026
19 participants among the governors and regional presidents, 12 of whom vote.
This division means volatility , but also opportunity .
TECHNICAL ANALYSIS - THE ASCENDING CHANNEL AT DECISION POINT
The Pattern: Ascending Channel (Bullish Structure)
Your chart shows a textbook ascending channel that's been in play since early November 2025.
Channel Characteristics:
Lower Support: Started at 44,000 (early Nov) → 46,500 (mid-Nov) → 47,000
Current Position: Dow closed at 48,057.75, which is mid-channel perfect positioning for next leg up.
Technical Indicators:
Moving Averages:
50-day MA: ~46,800 (rising, bullish)
200-day MA: ~45,200 (rising, bullish)
Golden Cross: Active since mid-October = long-term bullish
Volume:
Dow jumped on Wednesday after Fed decision with significant volume, this confirms the breakout is real , not a fake pump.
RSI:
Current: ~58-62 (slightly bullish but not overbought)
Room to run to 70+ before overbought conditions
🎯 SCENARIO ANALYSIS - WHAT HAPPENS NEXT
BASE CASE: Grind Higher to 48,000+ - BULLISH
What Happens:
Dow consolidates 48,000-48,400 for 2-3 days
Then breaks above 48,600 with volume
Grinds higher toward 49,000-49,500
Powell's "wait and see" stance removes uncertainty
Holiday buying + year-end window dressing pushes higher
Timeline: 2-3 weeks (by end of December)
Expected Return: +3-4% from 48,000 to 49,500-50,000
Catalysts:
Continued corporate buybacks
Holiday retail strength
Year-end fund rebalancing (institutional buying)
No negative Fed surprises (Powell on "pause")
BULL CASE: Breakout to 50,500+ - VERY BULLISH
What Happens:
Market doesn't believe Powell - 68% chance of 2+ cuts in 2026
Strong economic data (retail sales, employment) supports growth
Dow breaks 49,500 with conviction
FOMO kicks in, target 50,500-51,000
Timeline: 3-4 weeks (by early January)
Expected Return: +5-6% from 48,000
Catalysts:
Q4 earnings beat expectations
Strong holiday retail numbers
Dovish Fed speakers in January
International capital flows into US equities
BEAR CASE : Channel Break to 46,500 - BEARISH
What Happens:
Economic data deteriorates (unemployment spikes)
Earnings disappoint in early Q4 reporting
Geopolitical shock (unlikely but possible)
Dow breaks below 47,400, tests 46,500-47,000
Timeline: 1-2 weeks
Expected Return: -3-4% from 48,000
This is LOW probability given Fed just cut and Powell said "well positioned to wait."
📊 FUNDAMENTAL ANALYSIS - WHY DOW OUTPERFORMS
CATALYST #1: The Fed's "Hawkish Cut" Was Actually Dovish
Let me explain the paradox:
Hawkish Elements:
Three dissenting votes
Dot plot shows only 1 cut in 2026
Powell says "wait and see"
But Dovish Reality:
They STILL cut rates (3rd in a row!)
GDP forecast raised to 2.5% for 2025 and 2.3% for 2026
Unemployment expectations unchanged at 4.5% for 2025
68% market probability of 2+ cuts in 2026 means market doesn't believe the hawkish talk
Net Effect: Lower rates NOW + no immediate threat of hikes = bullish for stocks .
CATALYST #2: Corporate Earnings Remain Strong
GE Vernova jumped 8% after saying 2025 revenue trending toward higher end of guidance and doubled quarterly dividend.
This is indicative of broader Dow strength:
Industrial companies benefiting from infrastructure spending
Dividend increases signal confidence
Guidance raises = earnings momentum
CATALYST #3: Small Caps Leading (Risk-On)
Russell 2000 jumped to new all-time highs as lower interest rates benefit smaller firms that need to refinance debt.
When small caps outperform, it's a risk-on signal . Dow industrials benefit from this environment.
CATALYST #4: Year-End Window Dressing
Fund managers underperformed in 2025. In December, they buy winners to make their portfolios look good for year-end reports.
Dow = full of winners like UnitedHealth, Goldman Sachs, Boeing (recovery story).
⚠️ RISK FACTORS - THE BEAR CASE
RISK #1: The Fed Is More Hawkish Than Market Believes
Seven officials indicated they want NO cuts next year
If the Fed actually holds rates at 3.5-3.75% all of 2026, stocks could stall or correct 5-8%.
RISK #2: Channel Break Below 47,000
If Dow closes below 47,000 on daily chart, the ascending channel is broken . Next support: 46,000-46,500 (-4-5%).
RISK #3: Economic Data Deteriorates
Unemployment at 4.5% is manageable, but rising. If it spikes to 5%+, recession fears return.
RISK #4: Geopolitical Shock
US Coast Guard seized sanctioned crude tanker off Venezuela. Tensions with Venezuela/Russia could spike oil prices, hurting economy.
Entry Confirmation Checklist:
Before entering, CHECK:
✅ Price holding above 47,800 (support intact)
✅ Volume on bounce (>50K contracts on daily)
✅ No negative Fed speakers this week
✅ S&P 500 also bouncing (correlation check)
✅ VIX declining below 15 (fear subsiding)
✅ Treasury yields stable or declining
WAIT FOR 4/6 CONFIRMATIONS
THE BOTTOM LINE
Here's what I KNOW on December 10, 2025 (POST-FED):
✅ Dow rallied +497 points (+1.1%) post-Fed to 48,057
✅ Fed cut 25bps as expected to 3.5-3.75%
✅ Powell says "well positioned to wait and see"
✅ Market pricing 68% chance of 2+ cuts in 2026
✅ Ascending channel intact since November
✅ Your technical analysis shows clear support/resistance
Here's what I DON'T know:
Will economic data support more cuts?
Will earnings season (Jan) beat or miss?
Will geopolitical risks escalate?
📍 Follow officialjackofalltrades for post-FOMC analysis, institutional setups, and professional risk management.
Drop a 📊 if you're trading the post-Fed bounce.
Drop a 🎯 if this helped your YM1! setup.
Drop a 💰 if you're ready for 50K Dow.

DOW JONES Multi-month Bear Cycle to 40000 starting.Dow Jones (DJI) has been trading within a 16-year Channel Up since the 2008 Housing Crisis and approximately every 3.5 years (44 months) it tops and starts a technical correction/ Bearish Leg.
All of those Bear Cycles essentially since October 2011 have eventually pulled-back to the 1M MA50 (blue trend-line) at roughly he 0.382 Fibonacci retracement level. Only once time the 1M MA50 broke significantly and that was in March 2020 during the COVID flash crash, which eventually found Support on the 1M MA100 (green trend-line).
As a result, we expect Dow to start its Bear Cycle in 2026. From the current high the 0.382 Fib stands at exactly 40000, which based on its trajectory is where the 1M MA50 is headed by Q3 2026.
---
** Please LIKE 👍, FOLLOW ✅, SHARE 🙌 and COMMENT ✍ if you enjoy this idea! Also share your ideas and charts in the comments section below! This is best way to keep it relevant, support us, keep the content here free and allow the idea to reach as many people as possible. **
---
💸💸💸💸💸💸
👇 👇 👇 👇 👇 👇

Dow Jones Faces Potential Downside Correction“The Dow Jones may start a bearish correction from the current price range toward 47,423. The level at 48,916.77 is critical.” CMCMARKETS:US30

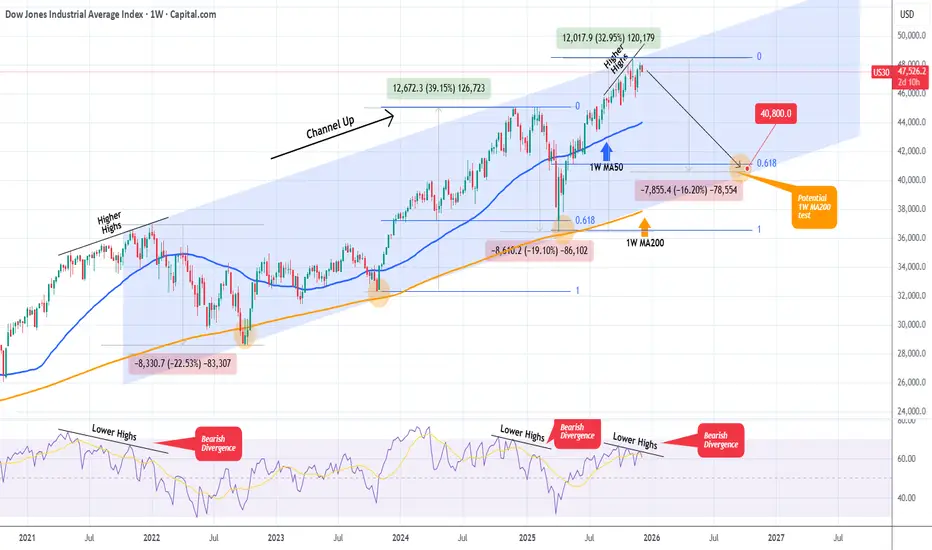
DOW JONES Is it starting a new Bear Cycle towards 40800?Dow Jones (DJI) has been trading within a 4-year Channel Up since the start of the 2022 Inflation Crisis. One month ago it hit the top of this pattern and hasn't made a new High since.
This is increasingly alarming as the 1W RSI is on a Bearish Divergence under Lower Highs against the market's Higher Highs. Every time this took place within this pattern, the index corrected heavily and attempted a 1W MA200 (orange trend-line) test.
As a result, if Dow fails to make a new High, we expect the bearish sentiment to intensify and start a new Bear Cycle (Bearish Leg for the Channel Up) towards its 1W MA200 and the 0.618 Fibonacci retracement level, which was the Target of the previous correction. Based on that it is possible for the index to hit 40800 at the bottom of the Channel Up.
---
** Please LIKE 👍, FOLLOW ✅, SHARE 🙌 and COMMENT ✍ if you enjoy this idea! Also share your ideas and charts in the comments section below! This is best way to keep it relevant, support us, keep the content here free and allow the idea to reach as many people as possible. **
---
💸💸💸💸💸💸
👇 👇 👇 👇 👇 👇
Short YM Trading ideaIf we broke this box to the downside I expect price will go to 1.5 Standard deviation or 4.23 Fibo Level drawn from the box
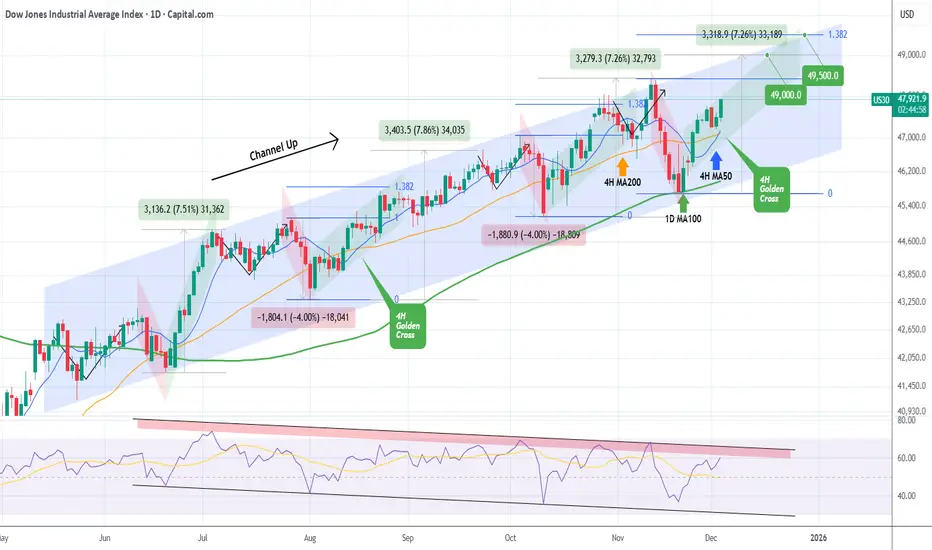
DOW JONES formed its first 4H Golden Cross since August. BullishDow Jones (DJI) has been trading within a 6-month Channel Up and today it formed its first 4H Golden Cross since August 15. Coming off a Higher Low bottom 2 weeks ago on the 1D MA100 (green trend-line), we are currently on the new Bullish Leg of the pattern.
The last one rose by +7.26%, roughly the % amount of the previous two as well, so our immediate Target remains 49000 as we've shown on last weeks analysis.
This time we also see an over-extended Target if the end-of-year rally lasts a bit longer, on the 1.382 Fibonacci extension at 49500, as this level has been hit on every Bullish Leg of this pattern.
If the 1D RSI though hits its Lower Highs Zone (red) earlier, it might be a good idea technically to book profits before those Targets are reached.
---
** Please LIKE 👍, FOLLOW ✅, SHARE 🙌 and COMMENT ✍ if you enjoy this idea! Also share your ideas and charts in the comments section below! This is best way to keep it relevant, support us, keep the content here free and allow the idea to reach as many people as possible. **
---
💸💸💸💸💸💸
👇 👇 👇 👇 👇 👇
DOW JONES Inverse Head and Shoulders formed. Bullish.Last week (November 19, see chart below), we caught the very bottom of the 6-month Channel Up on the 1D MA100 (green trend-line) of Dow Jones (DJI):
This time we view the price action using the 4H time-frame, where we can see that an Inverse Head and Shoulders has been formed, with its Head being the 1D MA100 bottom.
If more aggressive, it may not follow the typical green Bullish Leg of the Channel Up but the Target remains almost the same at 48900. That is the 2.0 Fibonacci extension. Typically we should see the 4H MA50 (blue trend-line) turning into the Support until the very top.
---
** Please LIKE 👍, FOLLOW ✅, SHARE 🙌 and COMMENT ✍ if you enjoy this idea! Also share your ideas and charts in the comments section below! This is best way to keep it relevant, support us, keep the content here free and allow the idea to reach as many people as possible. **
---
💸💸💸💸💸💸
👇 👇 👇 👇 👇 👇

DOW JONES Will the 1D MA100 save the day?Dow Jones (DJI) has been trading within a 6-month Channel Up and in the past 4 days it has been correcting on its latest Bearish Leg. By doing so, it broke below the 1D MA50 (blue trend-line) and is approaching the 1D MA100 (green trend-line) right at the bottom of the pattern.
This is the Channel's last Support. As long as it closes the daily candles above it, we will be bullish on Dow, targeting 49000, which represents a +7.25% rise, something all previous 3 Bullish Legs did.
---
** Please LIKE 👍, FOLLOW ✅, SHARE 🙌 and COMMENT ✍ if you enjoy this idea! Also share your ideas and charts in the comments section below! This is best way to keep it relevant, support us, keep the content here free and allow the idea to reach as many people as possible. **
---
💸💸💸💸💸💸
👇 👇 👇 👇 👇 👇

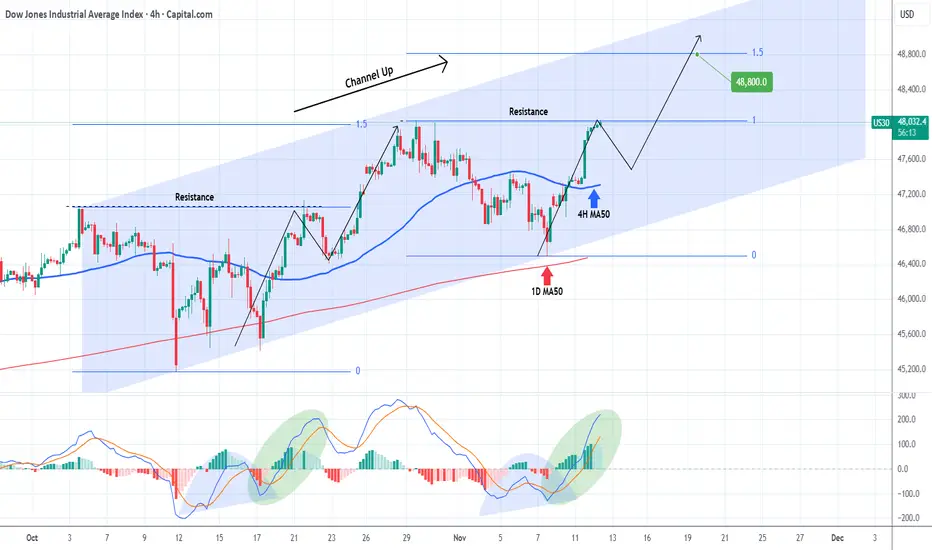
DOW JONES to new All Time Highs and won't stop there!Dow Jones (DJI) has been trading within an aggressive Channel Up since October 03, which made today a new All Time High (ATH). This is its technical Bullish Leg following the Higher Low bottom near the 1D MA50 (red trend-line).
With a 4H MACD sequence identical to the previous Leg, it is possible to see a re-test of the 4H MA50 (blue trend-line) next but on the medium-term, a new Higher High of at least 48800 (the 1.5 Fibonacci extension as on the previous Bullish Leg) is expected.
---
** Please LIKE 👍, FOLLOW ✅, SHARE 🙌 and COMMENT ✍ if you enjoy this idea! Also share your ideas and charts in the comments section below! This is best way to keep it relevant, support us, keep the content here free and allow the idea to reach as many people as possible. **
---
💸💸💸💸💸💸
👇 👇 👇 👇 👇 👇
DOW JONES recovered and is looking for a High at 48500.Exactly 2 weeks ago (October 22, see chart below), we gave a strong Buy Signal on Dow Jones (DJI), as the index had already initiated the new Bullish Leg of its 6-month Channel Up and quickly hit our 47700 Target:
That trading plan included a 2nd Target as well at 48500, which represented a +7.50% rise from the October 10 Low, which was a Higher Low for the Channel Up on its 1D MA50 (blue trend-line).
As Target 1 was on the 1.382 Fibonacci extension, the recent pull-back was technically expected as the sequence was similar to those of August 22 - September 02 among others. As you can see, all minor pull-backs that took place within this Channel Up, hit the 4H MA100 (red trend-line) and rebounded. Major ones found support lower on the 1D MA50, as did the October 10 Low.
Since the index hit yesterday its 4H MA100 and is rebounding today, the Bullish Leg remains valid and on the medium-term can reach our final 48500 Target.
-------------------------------------------------------------------------------
** Please LIKE 👍, FOLLOW ✅, SHARE 🙌 and COMMENT ✍ if you enjoy this idea! Also share your ideas and charts in the comments section below! This is best way to keep it relevant, support us, keep the content here free and allow the idea to reach as many people as possible. **
-------------------------------------------------------------------------------
💸💸💸💸💸💸
👇 👇 👇 👇 👇 👇

DOW JONES approaching the end of its Bull Cycle?Dow Jones (DJI) has been trading within a 16-year Channel Up ever sine the March 02 2009 market bottom of the U.S. Housing Crisis. As this chart shows, we have divided this pattern into three different phases.
Since the March 2020 COVID crash, it appears that the Cycle got restarted as the index broke below its 1W MA200 (orange trend-line) again after 10 years. Technically that was the only time that multi-year Support trend-line broke in 15 years.
In any case, following that Cycle 'restart', it appears that the index is currently inside the Megaphone pattern that in 2015 concluded Phase 2. The conclusion came with a second test on the 1W MA200 (Double Bottom). The first test was the April 07 2025 Low.
With their 1W RSI sequences also identical, having the first 1W MA200 forcing a 30.00 (oversold) RSI rebound, we expect the index to start a new Bearish Leg that might potentially test the 1W MA200 around 39000. For long-term investors, that is the market's next Buy Entry.
-------------------------------------------------------------------------------
** Please LIKE 👍, FOLLOW ✅, SHARE 🙌 and COMMENT ✍ if you enjoy this idea! Also share your ideas and charts in the comments section below! This is best way to keep it relevant, support us, keep the content here free and allow the idea to reach as many people as possible. **
-------------------------------------------------------------------------------
💸💸💸💸💸💸
👇 👇 👇 👇 👇 👇

Live YM Trade - Opening Range BreakoutCBOT_MINI:YM1!
Opening range breakout trade
Set stop orders on both ends for entry
Around a 100 point profit

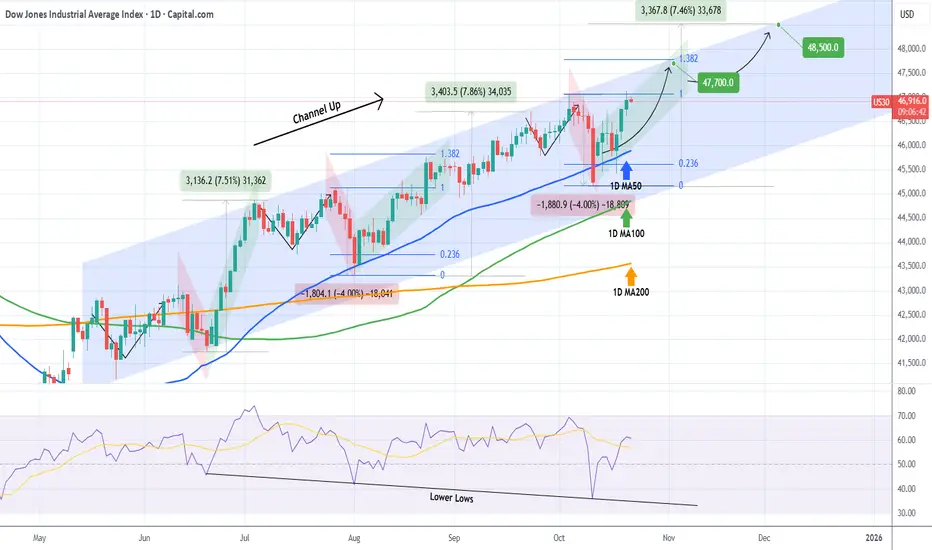
DOW JONES eyes two Bullish Targets before the end of the year.Dow Jones (DJI) has been trading within a 5-month Channel Up and is currently on its new Bullish Leg following the October 10 bounce on its 1D MA50 (blue trend-line).
As you can see, there is a high degree of symmetry between both the Bearish and Bullish Legs within this pattern and if that continues to hold, the immediate Target of the current Bullish Leg is the 1.382 Fibonacci extension at 47700, which we've already mentioned on our previous analysis.
This time however, we also set a second Target towards the end of the year, being a +7.50% rise (standard Leg as you can see) from the bottom at 48500. Both Targets would make ideal technical Higher Highs for the Channel Up.
Notice also how the October 10 bounce took place also on the 1D RSI's Lower Lows trend-line. An additional indication of a strong support for the long-term bullish trend.
-------------------------------------------------------------------------------
** Please LIKE 👍, FOLLOW ✅, SHARE 🙌 and COMMENT ✍ if you enjoy this idea! Also share your ideas and charts in the comments section below! This is best way to keep it relevant, support us, keep the content here free and allow the idea to reach as many people as possible. **
-------------------------------------------------------------------------------
💸💸💸💸💸💸
👇 👇 👇 👇 👇 👇
Breaking Down my Strategy for YM Trade46,700 to 45,700 is my prediction this week. I'm breaking down my thought process for journaling purposes.

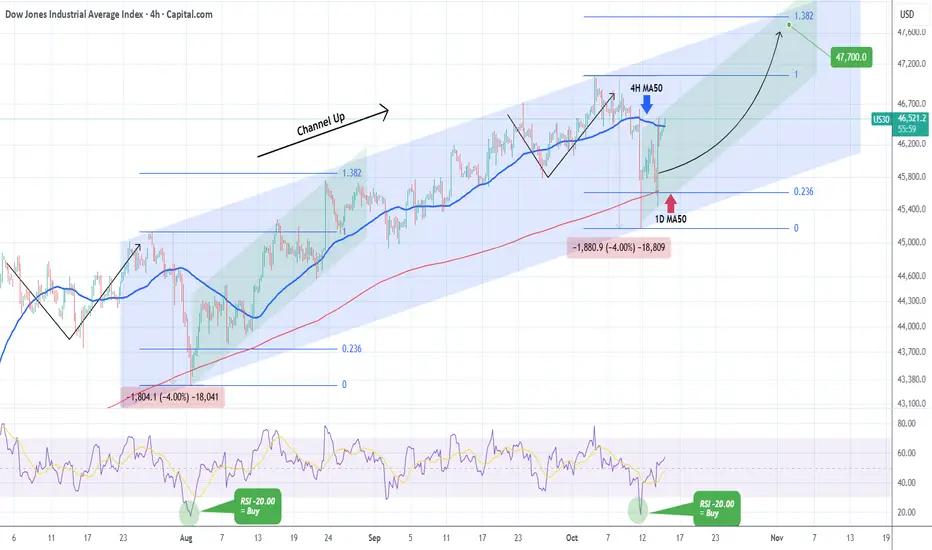
DOW JONES bounced at the bottom of the Channel Up. Buy signal.Dow Jones (DJI) has been trading within a 3-month Channel Up, with last Friday's flash crash breaching marginally below its 1D MA50 (red trend-line). That touched the bottom of the pattern and is technically a Higher Low, identical to the what the previous Bearish Leg did on the August 01 Low.
As you can see both Legs declined by -4.00% with their 4H RSIs touching the -20.00 level and rebounded. That is a technical Buy Signal, the strongest you can get within this Channel Up, and as long as the pattern's bottom holds, we expect another rise to the 1.382 Fibonacci extension (Our Target is 47700), similar to August's Bullish Leg.
-------------------------------------------------------------------------------
** Please LIKE 👍, FOLLOW ✅, SHARE 🙌 and COMMENT ✍ if you enjoy this idea! Also share your ideas and charts in the comments section below! This is best way to keep it relevant, support us, keep the content here free and allow the idea to reach as many people as possible. **
-------------------------------------------------------------------------------
💸💸💸💸💸💸
👇 👇 👇 👇 👇 👇
DOW JONES waiting for a rebound on its 4H MA50.Dow Jones (DJI) gave us last week (October 01, see chart below) an excellent Buy Signal on its 4H MA100 (green trend-line) that almost instantly hit our 47000 Target:
This time it is the 4H MA50 (blue trend-line) that is providing the new buy opportunity as following the 47000 Higher High of the Bullish Leg, the index pulled-back on a Bearish Leg.
As you can see, the symmetry within this pattern remains high with all three Bullish Legs so far rising by around +2.75% and the 4 MA50 / 4H MA100 providing support for the Bearish Legs.
As a result, we expect a new short-term rebound, as long as the 4H MA50 holds, targeting the 1.5 Fibonacci extension at 47180.
-------------------------------------------------------------------------------
** Please LIKE 👍, FOLLOW ✅, SHARE 🙌 and COMMENT ✍ if you enjoy this idea! Also share your ideas and charts in the comments section below! This is best way to keep it relevant, support us, keep the content here free and allow the idea to reach as many people as possible. **
-------------------------------------------------------------------------------
💸💸💸💸💸💸
👇 👇 👇 👇 👇 👇

DOW JONES Can the 4H MA100 initiate a comeback??Dow Jones (DJI) has been trading within a 2-month Channel Up and today touched its 4H MA100 (green trend-line) for a second time after September 25.
Both in terms of price and 4H RSI action, this sequence is similar to the September 02 rebound fractal, which also following a Bull Flag, it touched the 4H MA100 for a 2nd time and then moved on to a rally that peaked on the 1.5 Fibonacci extension.
The 1.5 Fib ext also priced the Higher High of the first Bullish Leg of the pattern, thus offers currently the highest probability for our next Higher High. Our long Target is slightly below it at 47000, representing a +2.80% rise from the recent Low.
-------------------------------------------------------------------------------
** Please LIKE 👍, FOLLOW ✅, SHARE 🙌 and COMMENT ✍ if you enjoy this idea! Also share your ideas and charts in the comments section below! This is best way to keep it relevant, support us, keep the content here free and allow the idea to reach as many people as possible. **
-------------------------------------------------------------------------------
💸💸💸💸💸💸
👇 👇 👇 👇 👇 👇

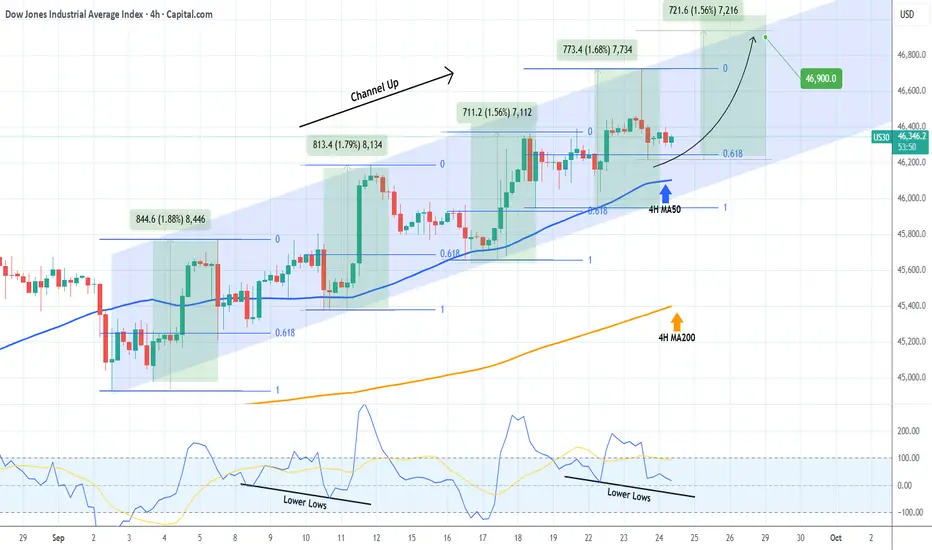
DOW JONES forming a bottom ahead of the next rally.Dow Jones (DJI) has been trading within a Channel Up since the start of September and right now it is consolidating after having hit the 0.618 Fibonacci retracement level, following a Higher High rejection at the top of the pattern.
As you can see, the 0.618 Fib was always pull-back tested after a Higher High, with the 4H MA50 (blue trend-line) also or at least coming very close to. As a result, the current 4H candle consolidation is technically a bottoming process before the new Bullish Leg.
The weakest Bullish Leg of this Channel Up has been +1.56%, which more than covers our 46900 Target.
-------------------------------------------------------------------------------
** Please LIKE 👍, FOLLOW ✅, SHARE 🙌 and COMMENT ✍ if you enjoy this idea! Also share your ideas and charts in the comments section below! This is best way to keep it relevant, support us, keep the content here free and allow the idea to reach as many people as possible. **
-------------------------------------------------------------------------------
💸💸💸💸💸💸
👇 👇 👇 👇 👇 👇
dowjones must goes to 46047Based on the analysis, Dow Jones has the potential to continue its upward movement from the 45,868 range. The price level of 45,809 serves as a warning zone for this decision.
If this area holds, the target could reach the peak of 46,100. CMCMARKETS:US30

DOW JONES The Cyclical Pivot that MUST hold.Last week (Sep 03, see chart below) we gave a buy signal on Dow Jones (DJI) right at the bottom of its medium-term Channel Up, which quickly hit our 46100 Target:
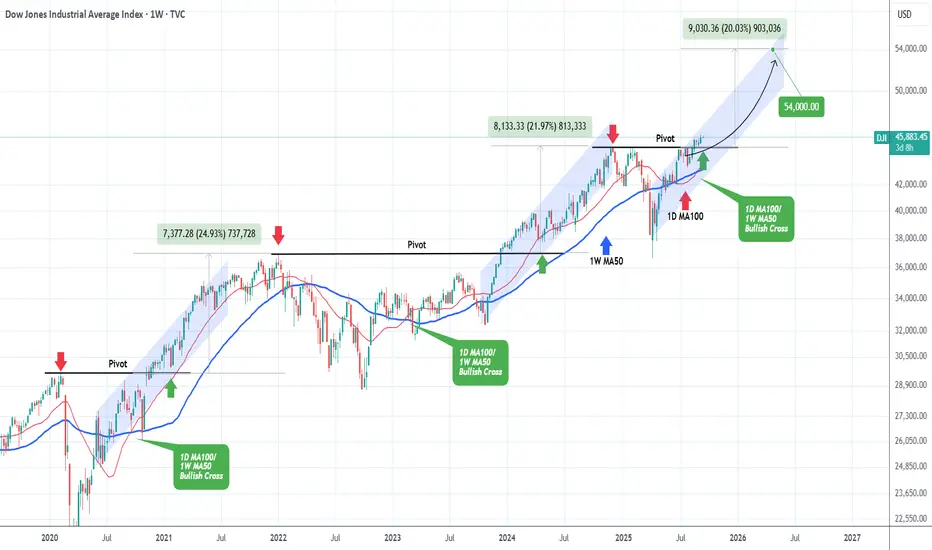
This time we switch to a much wider and longer term outlook on the 1W time-frame as we are just a day before the Fed Rate Decision. The index has been trading within a strong Channel Up ever since the April 07 2025 market bottom, product of the Trade War correction early in 2024.
The 1D MA100 (red trend-line) crossed above the 1W MA50 (blue trend-line) forming a peculiar Bullish Cross, which interestingly enough, it is the 3rd time we see it since September 2020.
As a result, it is highly critical and as you can see, after such cross, the 1W MA50 has historically led the index higher.
What is perhaps even more critical however is the Pivot trend-line, which is essentially the former All Time High (ATH) turned into Support for the Channel Up pattern that have pushed the market higher since 2020.
As you can see, that level always held and the two rallies that we've had on the pattern like the current one, completed +25% and +22% rallies above it before an eventually correction that broke below the 1W MA50.
As a result, we could see another +20% rise at least, translating into a 54000 long-term Target, as long as both the 1W MA50 and the Pivot hold.
-------------------------------------------------------------------------------
** Please LIKE 👍, FOLLOW ✅, SHARE 🙌 and COMMENT ✍ if you enjoy this idea! Also share your ideas and charts in the comments section below! This is best way to keep it relevant, support us, keep the content here free and allow the idea to reach as many people as possible. **
-------------------------------------------------------------------------------
💸💸💸💸💸💸
👇 👇 👇 👇 👇 👇
Multi-Asset Execution Chart Analysis & TradesAnalysis Date : September 11, 2025
Trading Analyst : Institutional Intelligence Framework
Methodology : Enhanced Dual Renko Chart System with Optimized Technical Indicators
Executive Summary
Execution chart analysis validates the exceptional institutional opportunities identified in our structure analysis. All three primary equity indices show perfect technical confirmation of institutional positioning with strong momentum indicators. Commodity and currency markets reveal significant technical conflicts requiring defensive positioning adjustments.
Enhanced Indicator Configuration
DMI/ADX Visual Standards :
ADX (Green) : Trend strength indicator (>25 = strong trend)
+DI (Blue) : Bullish directional movement
-DI (Red) : Bearish directional movement
Line Weight : 3pt for enhanced visibility
Dual Stochastics Configuration :
Tactical (5,3,3) : %K (Dark Blue), %D (Teal) - Short-term momentum
Strategic (50,3,3) : %K (Black), %D (Red Circles) - Medium-term context
Primary Opportunities - Technical Validation (75-85% Total Allocation)
1. DOW JONES (YM) - 30-35% ALLOCATION
Classification : OPTIMAL RISK/REWARD - Superior Technical Confirmation
YM Execution View:
Execution Signal Analysis :
DEMA Status : Bullish alignment confirmed (black above orange)
ADX : 47.74 (highest trend strength among all indices)
+DI/-DI Ratio : 2.69:1 bullish dominance
Momentum Quality : Exceptional - strongest ADX with optimal positioning
Stochastics : Tactical 98.86/84.24, Strategic 98.86/84.02 (peak momentum)
Technical Trade Setup :
Bullish Scenario (80% probability) :
Entry : /MYM at current levels 46,050 (optimal positioning confirmed)
Technical Edge : Strongest ADX + minimal extension risk
Stop Loss : 45,000 (2.3% risk - best among indices)
Target 1 : 47,000 (+2.1% - close 40% position)
Target 2 : 48,000 (+4.2% - close 30% position)
Trail Strategy : 150-point swing lows on remaining 30%
Consolidation Scenario (15% probability) :
Range : 45,500-46,500 around YTD POC consensus
Strategy : Accumulate on any dips to 45,700
Advantage : Minimal downside to institutional support
Risk Management : Optimal positioning within institutional zone
Bearish Scenario (5% probability) :
Trigger : Break below 45,000 (institutional consensus violation)
Action : Reduce position by 50%
Probability : Very low given YTD POC validation and technical strength
Re-entry : Require fresh institutional accumulation evidence
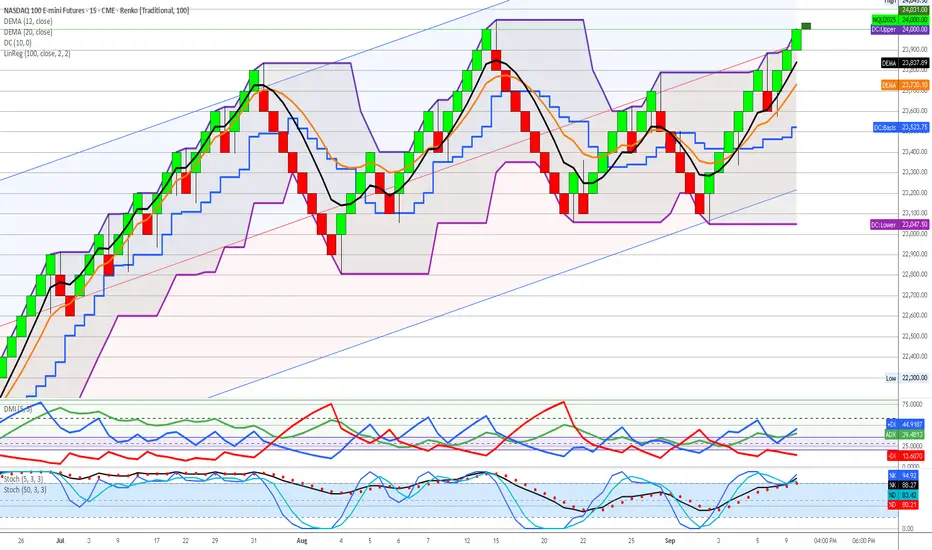
2. NASDAQ 100 (NQ) - 25-30% ALLOCATION
Classification : EXCEPTIONAL MOMENTUM - Exceptional Institutional Backing
NQ Execution View:
Execution Signal Analysis :
DEMA Status : Strong bullish alignment (black above orange)
ADX : 44.91 (exceptional trend strength)
+DI/-DI Ratio : 2.90:1 bullish dominance (highest among indices)
Momentum Quality : Exceptional directional bias
Stochastics : Tactical 88.27/80.21, Strategic 88.27/80.21 (strong sustainable)
Technical Trade Setup :
Bullish Scenario (75% probability) :
Entry : /MNQ at current levels or pullback to 23,700-23,800
Technical Edge : Highest +DI/-DI ratio with institutional backing
Stop Loss : 23,000 (4.3% risk)
Target 1 : 25,000 (+4.3% - close 50% position)
Target 2 : 25,500 (+6.1% - close 25% position)
Trail Strategy : 100-point swing lows on remaining 25%
Consolidation Scenario (20% probability) :
Range : 23,500-24,500 above institutional accumulation
Strategy : Scale into weakness, maintain core position
Management : Use tactical stochastics for entry timing
Support : 26.8:1 institutional backing provides confidence
Bearish Scenario (5% probability) :
Trigger : Break below 23,000 (Q3 POC violation)
Action : Exit all positions immediately
Reassessment : Wait for institutional re-accumulation
Probability : Very low given exceptional institutional support
3. S&P 500 (ES) - 20-25% ALLOCATION
Classification : SOLID CONFIRMATION - Strong Institutional Support
ES Execution View:
Execution Signal Analysis :
DEMA Status : Bullish alignment maintained (black above orange)
ADX : 41.32 (strong trend strength)
+DI/-DI Ratio : 1.74:1 bullish dominance
Momentum Quality : Solid institutional validation
Stochastics : Tactical 34.44/93.30, Strategic 98.26/95.30 (extreme overbought)
Technical Trade Setup :
Bullish Scenario (70% probability) :
Entry : /MES on any pullback to 6,450-6,500
Current Caution : Strategic stochastics extremely overbought
Stop Loss : 6,300 (3.8% risk)
Target 1 : 6,700 (+2.8% - close 50% position)
Target 2 : 6,800 (+4.4% - close 25% position)
Profit Management : Take profits on strength given overbought conditions
Consolidation Scenario (25% probability) :
Range : 6,400-6,600 around institutional levels
Strategy : Wait for tactical stochastics to reset before adding
Management : Reduce position size until momentum cools
Context : Strategic overbought suggests pause needed
Bearish Scenario (5% probability) :
Trigger : Break below 6,300 (institutional support failure)
Action : Systematic position reduction
Management : Tight stops given overbought technical readings
Re-entry : Wait for technical reset and institutional validation
Secondary Opportunities - Mixed Technical Signals (10-15% Total Allocation)
4. WTI CRUDE OIL (CL) - 8-12% ALLOCATION
Classification : INSTITUTIONAL CONFLICT - Defensive Positioning Required
CL Execution View:
Execution Signal Analysis :
DEMA Status : Bullish alignment (black above orange)
ADX : 42.19 (strong trend strength)
+DI/-DI Ratio : BEARISH 2.44:1 (-DI 42.10 vs +DI 17.86)
Critical Conflict : DEMA bullish vs DMI strongly bearish
Stochastics : Tactical 9.26/27.64, Strategic 27.64/33.61 (oversold setup)
Technical Trade Setup :
Bullish Scenario (45% probability) :
Entry Criteria : WAIT for +DI to cross above -DI for confirmation
Current Action : Reduce position size due to momentum conflict
Stop Loss : 61.50 (tight due to bearish momentum)
Target : 65.50 if technical alignment achieved
Risk Management : Maximum 1.5% account risk due to signal conflict
Neutral Scenario (35% probability) :
Range : 62.00-64.00 within institutional accumulation
Strategy : Maintain minimal defensive position
Monitoring : Daily +DI/-DI relationship for momentum shift
Institutional Support : Strong Q2 accumulation provides floor
Bearish Scenario (20% probability) :
Trigger : Break below 61.00 (institutional support failure)
Action : Complete position liquidation
Reason : Bearish momentum confirming institutional breakdown
Re-entry : 58.00 area (Q2 POC support) with technical confirmation
High-Risk Positions - Technical Deterioration (0-8% Total Allocation)
5. NATURAL GAS (NG) - 3-5% ALLOCATION
Classification : HIGH RISK - Institutional Disengagement Confirmed
NG Execution View:
Execution Signal Analysis :
DEMA Status : Bearish alignment (black below orange)
ADX : 42.79 (strong trend - bearish direction)
+DI/-DI Ratio : EXTREME BEARISH 6.30:1 (-DI 53.25 vs +DI 8.45)
Technical Reality : All major indicators bearishly aligned
Stochastics : Tactical 0.00/6.70 (maximum oversold), Strategic 51.98/65.70
Technical Trade Setup :
Bullish Scenario (20% probability) :
Entry Criteria : AVOID - all technical signals bearish
Required Confirmation : DEMA bullish cross + DMI reversal + institutional re-engagement
Current Action : Complete avoidance recommended
Speculative Only : Maximum 1% account risk if attempting reversal play
Neutral Scenario (30% probability) :
Range : 2.80-3.20 with declining institutional participation
Strategy : Avoid new positions, monitor for institutional return
Risk : 65% volume decline from Q1 peak activity
Liquidity : /MNG insufficient volume (13,991) for meaningful sizing
Bearish Scenario (50% probability) :
Continuation : Further decline toward 2.50-2.70 historical lows
Institutional Reality : Smart money disengagement pattern
Technical Confirmation : 6.30:1 bearish momentum supports decline
Strategy : Complete avoidance until institutional re-engagement
6. EURO FUTURES (6E) - 2-3% ALLOCATION
Classification : DANGEROUS EXTENSION - Technical Breakdown Confirmed
6E Execution View:
Execution Signal Analysis :
DEMA Status : Bearish crossover (black below orange)
ADX : 29.21 (moderate trend strength)
+DI/-DI Ratio : BEARISH 1.19:1 (-DI 29.21 vs +DI 24.49)
Extension Risk : 12.1% above YTD POC institutional consensus
Stochastics : Tactical 23.24/66.57, Strategic 74.26/90.89 (extremely overbought)
Technical Trade Setup :
Bullish Scenario (15% probability) :
Entry : AVOID - dangerous extension with technical breakdown
Existing Positions : Immediate systematic profit-taking required
Risk : Overextension + bearish technical = correction imminent
Management : Emergency profit-taking protocols engaged
Neutral Scenario (25% probability) :
Range : 1.1650-1.1800 at dangerous extension levels
Strategy : Avoid range trading given extension risk
Risk Assessment : All signals point to mean reversion
Professional Response : Defensive positioning only
Bearish Scenario (60% probability) :
Target : Return to YTD POC 1.0525 (-12.1% correction)
Technical Trigger : DEMA bearish cross + momentum deterioration
Strategy : Short opportunities on any strength above 1.1780
Entry : /M6E shorts with tight stops above 1.1820
Risk Control : Maximum 1% account risk given extension
7. GOLD FUTURES (GC) - 0% ALLOCATION
Classification : LIQUIDATION - High Risk Territory
GC Execution View:
Execution Signal Analysis :
DEMA Status : Bearish crossover from distribution highs
ADX : 34.91 (declining trend strength)
+DI/-DI Ratio : BEARISH 1.31:1 (-DI 34.91 vs +DI 26.64)
Extension Risk : 12.2%+ beyond ALL institutional positioning
Stochastics : Tactical 11.25/30.89, Strategic 89.46/93.86 (maximum overbought)
Technical Trade Setup :
Emergency Liquidation Protocol :
Immediate Action : Complete liquidation using market orders if necessary
Rationale : Void territory + technical breakdown = catastrophic risk
No Stops : Emergency exit protocols - immediate execution required
Reallocation : Proceeds to YM, NQ, ES primary opportunities immediately
Short Opportunity (High Probability) :
Strategy : /MGC shorts on any rallies above 2,690
Target : 2,380-2,400 (return to institutional zones)
Stop : 2,720 (tight risk control)
Correction Magnitude : 12-15% decline expected
Risk : Maximum 1% account risk for speculative short
Portfolio Risk Management Protocols
Position Sizing Framework
Maximum Risk Per Trade : 2% account value (1.5% for conflicted signals)
Portfolio Heat Limit : 15% total risk across all positions
Correlation Controls : Maximum 85% equity exposure given technical alignment
Cash Management : 5-10% opportunity fund for technical setups
Technical Signal Hierarchy
Primary Confirmation : DEMA + DMI + ADX alignment required
Entry Timing : Stochastics for tactical positioning optimization
Risk Management : Institutional levels for strategic stop placement
Profit Taking : Systematic protocol at 2:1, 3:1, trail remainder
Market Scenario Analysis
Scenario A: Continued Equity Strength (70% probability)
Characteristics : Technical momentum sustains institutional accumulation
Winners : YM, NQ, ES (maximize allocation to 85%)
Losers : GC, 6E (extension corrections accelerate)
Strategy : Aggressive equity positioning, complete defensive liquidation
Technical Catalyst : ADX strength maintenance + DEMA alignment
Scenario B: Technical Consolidation (25% probability)
Characteristics : Momentum indicators cool, range-bound trading
Management : Reduce position sizes, use stochastics for timing
Opportunity : Accumulate on pullbacks to institutional levels
Risk Control : Tighter stops, faster profit-taking on strength
Technical Signal : ADX decline below 35, stochastics reset
Scenario C: Technical Breakdown (5% probability)
Trigger : DEMA bearish crosses on primary indices
Action : Emergency position reduction protocols
Management : Systematic liquidation, increase cash to 25%+
Re-entry : Wait for institutional level retests with technical confirmation
Probability : Very low given exceptional institutional backing
Weekly Monitoring Checklist
Daily Technical Assessment
DEMA relationship maintenance across all positions
DMI momentum quality and directional bias confirmation
Stochastics positioning for entry/exit timing optimization
ADX strength validation for trend continuation
Risk Management Verification
Position sizing within 2% account risk per trade
Portfolio heat below 15% total risk exposure
Stop loss proximity to institutional support levels
Profit-taking discipline at predetermined targets
Technical Signal Evolution
Cross-asset momentum convergence/divergence analysis
Stochastics reset opportunities for position optimization
DEMA separation quality for trend strength assessment
Institutional level respect vs violation monitoring
Key Success Factors
Technical Execution Excellence
Signal Clarity : Enhanced visual indicators enable precise timing
Risk Discipline : Systematic adherence to technical signal hierarchy
Momentum Quality : ADX + DMI confirmation prevents false signals
Entry Optimization : Dual stochastics for tactical timing precision
Institutional Integration
Strategic Context : Structure charts provide positioning intelligence
Tactical Timing : Execution charts optimize entry/exit precision
Risk Management : Institutional levels anchor stop placement
Professional Standards : Both frameworks align for optimal decisions
Framework Validation Results
Primary Opportunities : Perfect technical confirmation of institutional intelligence
Risk Identification : Technical signals validate structure chart warnings
Professional Execution : Enhanced indicators enable institutional-grade precision
Capital Preservation : Systematic risk management across all timeframes
Risk Disclaimer : All trading involves substantial risk of loss. Past performance does not guarantee future results. Technical analysis and institutional intelligence frameworks are tools for risk assessment and should not be considered guaranteed predictors of future price movement. Position sizing and risk management protocols must be adjusted based on individual account size, risk tolerance, and market conditions.
Document Status : Active execution framework requiring daily technical monitoring and weekly risk assessment updates. Integration with structure analysis mandatory for optimal decision-making.
Framework Evolution : Enhanced visual indicators and systematic technical analysis represent significant advancement in execution precision. Continuous optimization based on market regime changes and signal quality assessment required.