DOW JONES bearish short-term as long as this Resistance holds.Dow Jones (DJI) got rejected last week below the 1-month Resistance and that formed a Lower High on the 1H time-frame, establishing a Channel Down.
It appears that we are in the process of repeating a Bearish Leg highly symmetrical to the previous one. So far we have completed a -1.80% Stage 1 decline and after a rebound, the price dropped again below the 1H MA50 (blue trend-line) in a similar way as January 18-19. Observe how even the 1H RSI sequences between the two fractals are identical.
As long as this holds as Resistance, we expect Stage 2 of the Bearish Leg to hit the bottom of the Channel Down on the 1.618 Fibonacci extension (as the previous Bearish Leg) at 48250.
---
** Please LIKE 👍, FOLLOW ✅, SHARE 🙌 and COMMENT ✍ if you enjoy this idea! Also share your ideas and charts in the comments section below! This is best way to keep it relevant, support us, keep the content here free and allow the idea to reach as many people as possible. **
---
💸💸💸💸💸💸
👇 👇 👇 👇 👇 👇
YM1!

Short Idea On US30 (Dow Jones)Based on :
-quantitative analysis
- vp and avwap levels
- correlations misprice model
- IV deviation bands models

DOW JONES broke below its 4H MA200 after 2 months!Dow Jones (DJI) has been trading within a Channel Up for almost 9 months and 2 weeks ago (January 07, see chart below) we gave a strong Sell Signal on its Top:
Yesterday the price broke below its 4H MA200 (orange trend-line) for the first time in 2 months and this confirms the extension of the current Bearish Leg. We slightly modify our Target on the 47800 Support exactly, which is almost a -4.00% decline from the Top and will also test the 1D MA100 (red trend-line), which is the long-term Support of the pattern.
The 36.50 1D RSI Support is where the last two Channel Up bottoms where priced, so keep an eye on that too.
---
** Please LIKE 👍, FOLLOW ✅, SHARE 🙌 and COMMENT ✍ if you enjoy this idea! Also share your ideas and charts in the comments section below! This is best way to keep it relevant, support us, keep the content here free and allow the idea to reach as many people as possible. **
---
💸💸💸💸💸💸
👇 👇 👇 👇 👇 👇

YM1! - Symmetrical Wedge Compression Inside 2HR FVG | Breakout?
What's up traders! 👋
YM1! E-mini Dow Jones Futures is setting up for a big move. We've got a symmetrical wedge compressing right inside a 2HR FVG zone - this is textbook pre-breakout structure. Let me break down what I'm seeing.
The Setup
YM1! is trading at 49,639 on the 45-minute timeframe. Price is consolidating inside a symmetrical wedge pattern - descending resistance on top (lower highs) and ascending support on bottom (higher lows). The apex of this wedge is converging right inside the 2HR FVG zone around 48,700-48,850.
This is compression before expansion. The question is: which way does it break?
Why I'm Leaning Bullish
Higher timeframes (2HR, 4HR, Daily) all bullish structure
Dow closed +292 points (+0.60%) today at 49,442
TSMC blockbuster earnings - AI capex up 37% to $52-56B
Goldman Sachs +4%, Morgan Stanley +6% on earnings beats
Jobless claims 198K (beat expectations of 215K)
Forward curve pricing 50,800+ by December 2026
Up 15.95% over the past year - strong momentum
Just 0.5% from 52-week high (49,901)
The Wedge Structure
DESCENDING RESISTANCE (Top): Lower highs forming - sellers capping rallies
ASCENDING SUPPORT (Bottom): Higher lows forming - buyers defending dips
CONVERGENCE POINT: Price squeezing into tighter range inside FVG
2HR FVG ZONE: 48,700-48,850 acting as equilibrium zone
BREAKOUT PENDING: Wedge apex approaching - move coming soon
The News Context - January 15, 2026
Today's session was BULLISH:
Dow +292.81 points (+0.60%) to 49,442.44
TSMC surged 4.4% on record Q4 profits + massive AI capex plans
Goldman Sachs +4% - 12% profit increase, deal-making fees +25%
Morgan Stanley +6% - 18% profit jump, IB revenue +47%
Jobless claims 198K vs 215K expected - labor market strong
Airlines +2.6%, Semiconductors +1.8%
Oil down 4.68% - Trump eased Iran tensions
10Y Treasury yield +2bp to 4.16%
Macro Drivers
TSMC 2026 capex $52-56B (37% increase) - AI boom has legs
Fed's Schmid: Independent Fed serves public best
Japan #1 holder of US securities at $1.2T
China holdings down to $682.6B (selling continues)
European stocks at record highs
KOSPI 10-day winning streak - global risk-on
Key Levels I'm Watching
Resistance:
49,792 - Day's high / immediate resistance
49,901 - 52-WEEK HIGH (critical breakout level)
50,000 - PSYCHOLOGICAL ROUND NUMBER
50,200 - Wedge breakout target 1
50,800 - Forward curve target (Dec 2026)
Support:
49,639 - Current price
49,253 - Day's low
48,700-48,850 - 2HR FVG ZONE (key support)
48,200 - Major horizontal support
48,000 - Lower wedge support / psychological
47,600 - Channel bottom (if breakdown)
Two Scenarios
BULLISH BREAKOUT (PRIMARY):
The symmetrical wedge breaks to the upside. Price holds the 2HR FVG zone, bounces off ascending support, and breaks above descending resistance. Targets:
First target: 49,901 (52-week high retest)
Second target: 50,000 (psychological)
Extended target: 50,200-50,400 (new ATH territory)
Triggers: Break above 49,800 with volume, TSMC momentum continues, bank earnings strength, risk-on sentiment.
BEARISH BREAKDOWN:
The wedge breaks down. Price loses the 2HR FVG zone, breaks below ascending support, and targets lower levels:
First target: 48,200 (horizontal support)
Second target: 48,000 (psychological)
Extended target: 47,600 (channel bottom)
Triggers: Break below 48,700 with volume, Fed hawkish surprise, geopolitical escalation, risk-off rotation.
My Take - BULLISH BIAS
I'm leaning BULLISH here. Here's why:
1. Higher timeframe structure is bullish - 2HR, 4HR, and Daily all showing higher highs and higher lows. The large bearish candle on higher TFs is just a pullback within the uptrend.
2. Wedge inside FVG = accumulation - When price consolidates inside an FVG with a symmetrical wedge, it's typically smart money accumulating before the next leg.
3. News flow is bullish - TSMC's massive AI capex, bank earnings beats, strong labor data. The fundamentals support higher prices.
4. Forward curve is bullish - Market pricing 50,800+ by December 2026. The path of least resistance is higher.
5. Just 0.5% from ATH - We're consolidating near all-time highs. This is typically bullish - accumulation before breakout.
The risk is the descending wedge top - sellers are capping rallies. But the ascending wedge bottom shows buyers are defending. When these converge, the breakout typically follows the prevailing trend - which is UP.
Trade Plan
Bullish Entry:
Entry: Break above 49,800 with volume OR bounce from FVG zone (48,700-48,850)
Stop: Below 48,500 (below FVG zone)
Target 1: 49,901 (52-week high)
Target 2: 50,000 (psychological)
Target 3: 50,200+ (new ATH)
R:R: ~1:2.5
Bearish Entry (if breakdown):
Entry: Break below 48,700 with volume
Stop: Above 49,000
Target 1: 48,200
Target 2: 48,000
Target 3: 47,600
R:R: ~1:2
The Bottom Line
YM1! is compressing inside a symmetrical wedge right at the 2HR FVG zone. This is textbook pre-breakout structure. The higher timeframes are bullish, the news flow is bullish, and we're just 0.5% from all-time highs.
I'm watching for the breakout above 49,800 to confirm the bullish thesis. If we lose the FVG zone at 48,700, I'll reassess.
The wedge is tightening. The move is coming. I think it's UP.
What do you think? Breakout or breakdown? Drop your thoughts below! 👇

DOW JONES in synch with the USD to start a massive correction.Dow Jones (DJI) has been trading within a 17-year Channel Up ever since the bottom of the 2008 U.S. Housing Crisis. This is not the first time we give you this pattern, so I won't be getting into too much detail on its specifics.
What we do combine it with for the first time though, is the DXY (black trend-line), which has also been trading within a Channel Up since 2008, a direct consequence of the monetary policies that were applied globally by central banks to save the system following that credit-shock event.
What this cross symbol comparison offers, is give a clear unbiased illustration of the patterns and correlation involved between the stock market and DXY (U.S. Dollar Index). Most times that the DXY bottoms (green circles), Dow peaks its Bull Cycle and starts a correction (Bear Cycle, as shown in red). All of Dow's Bear Cycles have either pulled back to the 0.382 Fibonacci retracement level or the 1W MA200 (orange trend-line) or even both.
As a result, we estimate Dow to target 40000 by the time one of the above takes place, which can coincide with the DXY hitting the top of its inner Channel Down, similar to what it did during the previous two such smaller patterns within the main 17-year Channel Up.
---
** Please LIKE 👍, FOLLOW ✅, SHARE 🙌 and COMMENT ✍ if you enjoy this idea! Also share your ideas and charts in the comments section below! This is best way to keep it relevant, support us, keep the content here free and allow the idea to reach as many people as possible. **
---
💸💸💸💸💸💸
👇 👇 👇 👇 👇 👇

MYM!/YM1! Day Trade Plan — Week of 01/12/2026🎯 **MYM!/YM1! Day Trade Plan — Week of 01/12/2026** 🎯
Huge thanks to all my followers! Your support drives this content. Please like & share! 🤓📈💰
**Sample Trade Setup:**
- **Entry:** 49,286
- **Stop Loss:** 49,236
- **Take Profit:** 49,447
> 3RR! For every $100 risked, $300 is the reward.
How to Trade This Chart (Simple & Repeatable):
**🟢 LONG TRADES:** When price approaches ABOVE **orange support level**, enter long with stop below and target the next resistance level above.
**🔴 SHORT TRADES:** When price hits BELOW **orange support level**, enter short with stop above and target the next support level below.
**The Process:**
1. Wait for price to reach a marked level
2. Enter in the direction indicated by color
3. Set your stop loss tight (50 points)
4. Let it run to the next level for profit (150+ points)
5. Repeat at every level—same rules, consistent execution
*These levels are built from comprehensive backtesting and quantitative analysis with proven accuracy. Price often exceeds initial projections—trade with discipline!* NOT FINANCIAL ADVICE.
Let's capitalize on these setups this week! 📉📈🚀

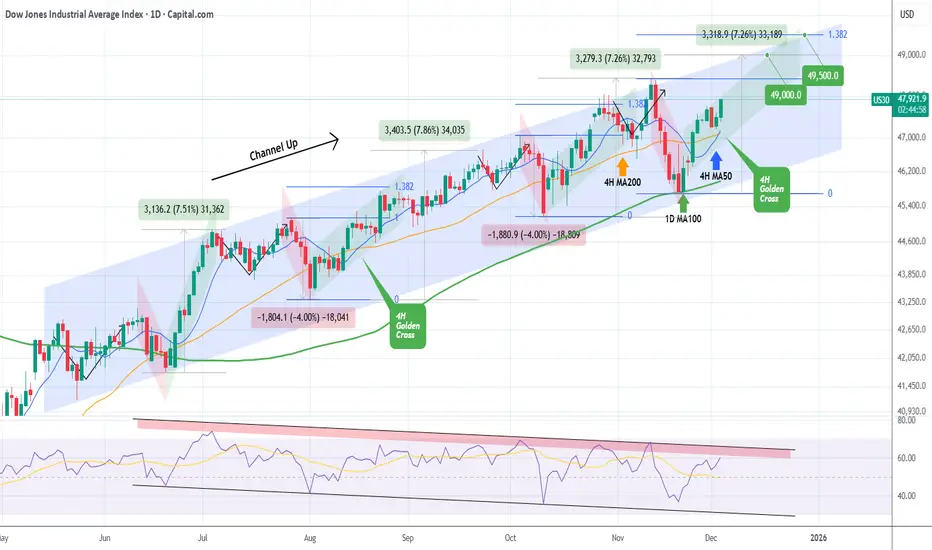
DOW JONES Strongest sell signal in 2 months.Last week (see chart below) we gave a buy signal on Dow Jones (DJI), which easily hit our 48650 short-term Target, as the price found support inside a tight Triangle pattern:
This time, a strong sell opportunity is emerging (in fact strongest in two months) as we move to the longer 1D time-frame, where Dow has been trading within an 8-month Channel Up that is very close to its top (Higher Highs trend-line).
The 1D RSI however is already touching its multi-month Resistance Zone, which makes it a prime Sell Signal already as the last time it was there was almost 2 months ago (November 12 2025). What followed this was a strong -5.59% technical pull-back that found support exactly on the 1D MA100 (green trend-line) at the bottom of the Channel Up.
Basically, the current Bullish Leg has also just completed a +8.59 rise, which is the most a Bullish Leg has grown within this pattern. And since a -4.00% correction has been the usual decline on all corrections also, we expect Dow to hit the 47900 - 47600 Target Zone, consisting of the 1D MA50 (blue trend-line) and 1D MA100 respectively, with Support 1 in between.
Keep an eye also on the 1D RSI Support Zone. If it gets hit before any of those targets, it will be a good idea to take the profit on the shorts then, regardless of the price.
---
** Please LIKE 👍, FOLLOW ✅, SHARE 🙌 and COMMENT ✍ if you enjoy this idea! Also share your ideas and charts in the comments section below! This is best way to keep it relevant, support us, keep the content here free and allow the idea to reach as many people as possible. **
---
💸💸💸💸💸💸
👇 👇 👇 👇 👇 👇

DOW JONES Triangle started a Bullish Leg.Dow Jones (DJI) has been trading within a Triangle pattern on the short-term, with the price making a Higher Low on Wednesday on its bottom. With the 4H RSI rebounding just after it breached below the 30.00 oversold barrier, we expect the pattern to start its new Bullish Leg now.
A +1.30% rise to test its top (Lower Highs trend-line), would still be a minimum based on all the Bullish Legs that preceded. As a result, our short-term Target (unless the 4H MA50 rejects the uptrend) is 48650.
---
** Please LIKE 👍, FOLLOW ✅, SHARE 🙌 and COMMENT ✍ if you enjoy this idea! Also share your ideas and charts in the comments section below! This is best way to keep it relevant, support us, keep the content here free and allow the idea to reach as many people as possible. **
---
💸💸💸💸💸💸
👇 👇 👇 👇 👇 👇

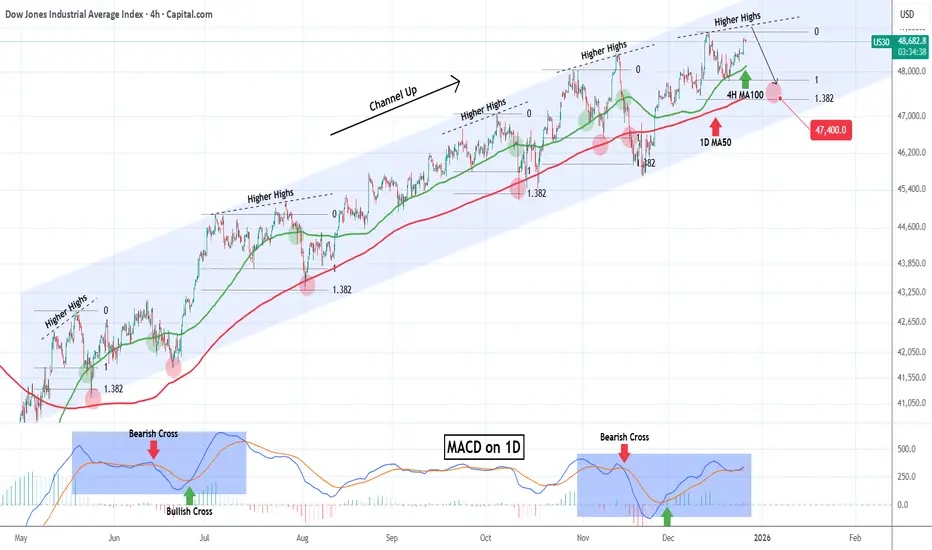
DOW JONES headed towards a rejection.Dow Jones (DJI) has been trading within a nearly 8-month Channel Up and is close to its All Time High (ATH) after rebounding last week on its 4H MA100 (green trend-line).
This pattern is cyclical and every time the latter support broke after a medium-term rally from its 1D MA50 (blue trend-line), the index got rejected on a Higher Highs trend-line and corrected back to the 1D MA50. Even the 1D MACD is printing a sequence similar to June - July.
As a result, we expect the new year to find Dow on its 1.382 Fibonacci extension at 47400 at least, which is the Fib level that every such correction pulled back to.
---
** Please LIKE 👍, FOLLOW ✅, SHARE 🙌 and COMMENT ✍ if you enjoy this idea! Also share your ideas and charts in the comments section below! This is best way to keep it relevant, support us, keep the content here free and allow the idea to reach as many people as possible. **
---
💸💸💸💸💸💸
👇 👇 👇 👇 👇 👇
YM1! DOW JONES E-MINI FUTURES - THE POST-FED BLUEPRINTDecember 10, 2025 | by officialjackofalltrades
🟢 BULLISH | Fed's "Hawkish Cut" Creates Opportunity
EXECUTIVE SUMMARY - THE FED DECISION IS IN
Current Price: $47,913 | Date: December 10, 2025 - POST-FOMC
The Dow Jones E-mini futures just experienced a historic moment :
The Dow gained 497.46 points, or 1.1%, to close at 48,057.75 following the Federal Reserve's decision to lower rates by a quarter percentage point, putting it in a range between 3.5%-3.75%.
But here's what NOBODY is talking about: This was a "hawkish cut" with three "no" votes, which hasn't happened since September 2019. Yet the market RALLIED .
Why? Because the "hawkish" part was already priced in.
The Technical Setup:
Pattern: Ascending channel (intact since November)
Current Position: Testing mid-channel at 47,700-47,800
Resistance: 48,100-48,300 (upper channel boundary)
Support: 46,800-47,00 (mid-channel), 46,500-46,100 (lower channel)
Breakout Target: 48,000-48,500
The Fed Backdrop:
Powell said "We are well positioned to wait and see how the economy evolves"
Translation? The Fed is DONE cutting for now.
But here's the twist: Fed funds futures suggest around a 68% chance the central bank will cut rates two or more times in 2026. The market doesn't believe Powell!
The Trade: Long from 47,700-48,300, target 48,000+
🔎 MARKET CONTEXT - THE FED'S "HAWKISH CUT" PARADOX
What Just Happened (Last 6 Hours)
At 2:00 PM ET today, the Fed delivered exactly what was expected: 25-basis-point reduction from 3.75-4% to 3.50-3.75%.
But the details were hawkish:
Three dissenting votes (Cleveland Fed President Beth Hammack voted against, plus two others)
Dot plot indicated just one more cut in 2026 and another in 2027
Seven officials indicated they want NO cuts next year
Powell called it a "very challenging situation"
The Market's Response?
Dow jumped 497.46 points (+1.1%) to 48,057.75. Why rally on hawkish news?
Answer: Because the hawkish tone was already priced in from the pre-meeting leaks and October's dissenting votes. The market expected worse .
The Internal Fed War
Asked about the elevated level of dissenting members, Powell emphasized that everyone on the FOMC agrees that inflation is still too high, and that there are also risks to economic growth.
This Fed is more divided than any time in recent memory :
Hawks (7 members): Want ZERO cuts in 2026
Centrists (5 members): Want 1-2 cuts in 2026
Doves (7 members): Want 2-3 cuts in 2026
19 participants among the governors and regional presidents, 12 of whom vote.
This division means volatility , but also opportunity .
TECHNICAL ANALYSIS - THE ASCENDING CHANNEL AT DECISION POINT
The Pattern: Ascending Channel (Bullish Structure)
Your chart shows a textbook ascending channel that's been in play since early November 2025.
Channel Characteristics:
Lower Support: Started at 44,000 (early Nov) → 46,500 (mid-Nov) → 47,000
Current Position: Dow closed at 48,057.75, which is mid-channel perfect positioning for next leg up.
Technical Indicators:
Moving Averages:
50-day MA: ~46,800 (rising, bullish)
200-day MA: ~45,200 (rising, bullish)
Golden Cross: Active since mid-October = long-term bullish
Volume:
Dow jumped on Wednesday after Fed decision with significant volume, this confirms the breakout is real , not a fake pump.
RSI:
Current: ~58-62 (slightly bullish but not overbought)
Room to run to 70+ before overbought conditions
🎯 SCENARIO ANALYSIS - WHAT HAPPENS NEXT
BASE CASE: Grind Higher to 48,000+ - BULLISH
What Happens:
Dow consolidates 48,000-48,400 for 2-3 days
Then breaks above 48,600 with volume
Grinds higher toward 49,000-49,500
Powell's "wait and see" stance removes uncertainty
Holiday buying + year-end window dressing pushes higher
Timeline: 2-3 weeks (by end of December)
Expected Return: +3-4% from 48,000 to 49,500-50,000
Catalysts:
Continued corporate buybacks
Holiday retail strength
Year-end fund rebalancing (institutional buying)
No negative Fed surprises (Powell on "pause")
BULL CASE: Breakout to 50,500+ - VERY BULLISH
What Happens:
Market doesn't believe Powell - 68% chance of 2+ cuts in 2026
Strong economic data (retail sales, employment) supports growth
Dow breaks 49,500 with conviction
FOMO kicks in, target 50,500-51,000
Timeline: 3-4 weeks (by early January)
Expected Return: +5-6% from 48,000
Catalysts:
Q4 earnings beat expectations
Strong holiday retail numbers
Dovish Fed speakers in January
International capital flows into US equities
BEAR CASE : Channel Break to 46,500 - BEARISH
What Happens:
Economic data deteriorates (unemployment spikes)
Earnings disappoint in early Q4 reporting
Geopolitical shock (unlikely but possible)
Dow breaks below 47,400, tests 46,500-47,000
Timeline: 1-2 weeks
Expected Return: -3-4% from 48,000
This is LOW probability given Fed just cut and Powell said "well positioned to wait."
📊 FUNDAMENTAL ANALYSIS - WHY DOW OUTPERFORMS
CATALYST #1: The Fed's "Hawkish Cut" Was Actually Dovish
Let me explain the paradox:
Hawkish Elements:
Three dissenting votes
Dot plot shows only 1 cut in 2026
Powell says "wait and see"
But Dovish Reality:
They STILL cut rates (3rd in a row!)
GDP forecast raised to 2.5% for 2025 and 2.3% for 2026
Unemployment expectations unchanged at 4.5% for 2025
68% market probability of 2+ cuts in 2026 means market doesn't believe the hawkish talk
Net Effect: Lower rates NOW + no immediate threat of hikes = bullish for stocks .
CATALYST #2: Corporate Earnings Remain Strong
GE Vernova jumped 8% after saying 2025 revenue trending toward higher end of guidance and doubled quarterly dividend.
This is indicative of broader Dow strength:
Industrial companies benefiting from infrastructure spending
Dividend increases signal confidence
Guidance raises = earnings momentum
CATALYST #3: Small Caps Leading (Risk-On)
Russell 2000 jumped to new all-time highs as lower interest rates benefit smaller firms that need to refinance debt.
When small caps outperform, it's a risk-on signal . Dow industrials benefit from this environment.
CATALYST #4: Year-End Window Dressing
Fund managers underperformed in 2025. In December, they buy winners to make their portfolios look good for year-end reports.
Dow = full of winners like UnitedHealth, Goldman Sachs, Boeing (recovery story).
⚠️ RISK FACTORS - THE BEAR CASE
RISK #1: The Fed Is More Hawkish Than Market Believes
Seven officials indicated they want NO cuts next year
If the Fed actually holds rates at 3.5-3.75% all of 2026, stocks could stall or correct 5-8%.
RISK #2: Channel Break Below 47,000
If Dow closes below 47,000 on daily chart, the ascending channel is broken . Next support: 46,000-46,500 (-4-5%).
RISK #3: Economic Data Deteriorates
Unemployment at 4.5% is manageable, but rising. If it spikes to 5%+, recession fears return.
RISK #4: Geopolitical Shock
US Coast Guard seized sanctioned crude tanker off Venezuela. Tensions with Venezuela/Russia could spike oil prices, hurting economy.
Entry Confirmation Checklist:
Before entering, CHECK:
✅ Price holding above 47,800 (support intact)
✅ Volume on bounce (>50K contracts on daily)
✅ No negative Fed speakers this week
✅ S&P 500 also bouncing (correlation check)
✅ VIX declining below 15 (fear subsiding)
✅ Treasury yields stable or declining
WAIT FOR 4/6 CONFIRMATIONS
THE BOTTOM LINE
Here's what I KNOW on December 10, 2025 (POST-FED):
✅ Dow rallied +497 points (+1.1%) post-Fed to 48,057
✅ Fed cut 25bps as expected to 3.5-3.75%
✅ Powell says "well positioned to wait and see"
✅ Market pricing 68% chance of 2+ cuts in 2026
✅ Ascending channel intact since November
✅ Your technical analysis shows clear support/resistance
Here's what I DON'T know:
Will economic data support more cuts?
Will earnings season (Jan) beat or miss?
Will geopolitical risks escalate?
📍 Follow officialjackofalltrades for post-FOMC analysis, institutional setups, and professional risk management.
Drop a 📊 if you're trading the post-Fed bounce.
Drop a 🎯 if this helped your YM1! setup.
Drop a 💰 if you're ready for 50K Dow.

DOW JONES Multi-month Bear Cycle to 40000 starting.Dow Jones (DJI) has been trading within a 16-year Channel Up since the 2008 Housing Crisis and approximately every 3.5 years (44 months) it tops and starts a technical correction/ Bearish Leg.
All of those Bear Cycles essentially since October 2011 have eventually pulled-back to the 1M MA50 (blue trend-line) at roughly he 0.382 Fibonacci retracement level. Only once time the 1M MA50 broke significantly and that was in March 2020 during the COVID flash crash, which eventually found Support on the 1M MA100 (green trend-line).
As a result, we expect Dow to start its Bear Cycle in 2026. From the current high the 0.382 Fib stands at exactly 40000, which based on its trajectory is where the 1M MA50 is headed by Q3 2026.
---
** Please LIKE 👍, FOLLOW ✅, SHARE 🙌 and COMMENT ✍ if you enjoy this idea! Also share your ideas and charts in the comments section below! This is best way to keep it relevant, support us, keep the content here free and allow the idea to reach as many people as possible. **
---
💸💸💸💸💸💸
👇 👇 👇 👇 👇 👇

Dow Jones Faces Potential Downside Correction“The Dow Jones may start a bearish correction from the current price range toward 47,423. The level at 48,916.77 is critical.” CMCMARKETS:US30

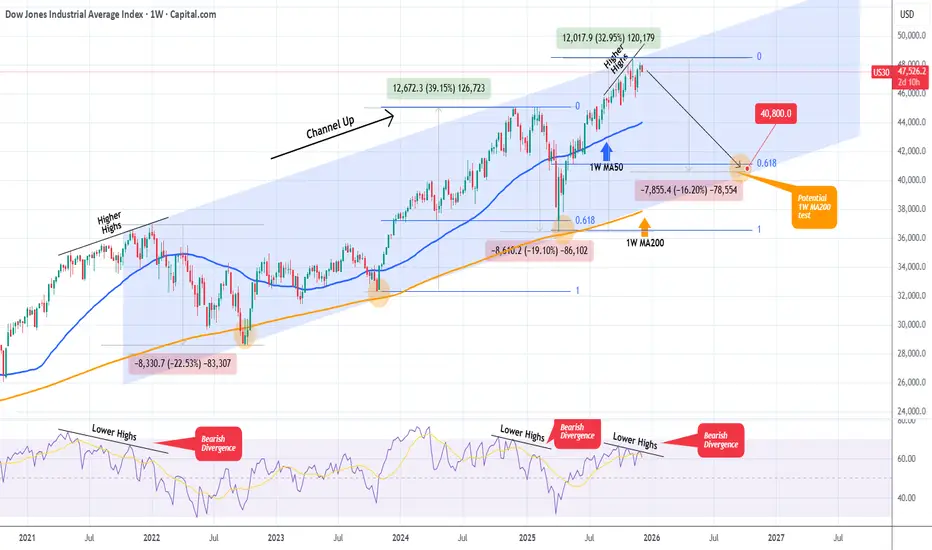
DOW JONES Is it starting a new Bear Cycle towards 40800?Dow Jones (DJI) has been trading within a 4-year Channel Up since the start of the 2022 Inflation Crisis. One month ago it hit the top of this pattern and hasn't made a new High since.
This is increasingly alarming as the 1W RSI is on a Bearish Divergence under Lower Highs against the market's Higher Highs. Every time this took place within this pattern, the index corrected heavily and attempted a 1W MA200 (orange trend-line) test.
As a result, if Dow fails to make a new High, we expect the bearish sentiment to intensify and start a new Bear Cycle (Bearish Leg for the Channel Up) towards its 1W MA200 and the 0.618 Fibonacci retracement level, which was the Target of the previous correction. Based on that it is possible for the index to hit 40800 at the bottom of the Channel Up.
---
** Please LIKE 👍, FOLLOW ✅, SHARE 🙌 and COMMENT ✍ if you enjoy this idea! Also share your ideas and charts in the comments section below! This is best way to keep it relevant, support us, keep the content here free and allow the idea to reach as many people as possible. **
---
💸💸💸💸💸💸
👇 👇 👇 👇 👇 👇
Short YM Trading ideaIf we broke this box to the downside I expect price will go to 1.5 Standard deviation or 4.23 Fibo Level drawn from the box
DOW JONES formed its first 4H Golden Cross since August. BullishDow Jones (DJI) has been trading within a 6-month Channel Up and today it formed its first 4H Golden Cross since August 15. Coming off a Higher Low bottom 2 weeks ago on the 1D MA100 (green trend-line), we are currently on the new Bullish Leg of the pattern.
The last one rose by +7.26%, roughly the % amount of the previous two as well, so our immediate Target remains 49000 as we've shown on last weeks analysis.
This time we also see an over-extended Target if the end-of-year rally lasts a bit longer, on the 1.382 Fibonacci extension at 49500, as this level has been hit on every Bullish Leg of this pattern.
If the 1D RSI though hits its Lower Highs Zone (red) earlier, it might be a good idea technically to book profits before those Targets are reached.
---
** Please LIKE 👍, FOLLOW ✅, SHARE 🙌 and COMMENT ✍ if you enjoy this idea! Also share your ideas and charts in the comments section below! This is best way to keep it relevant, support us, keep the content here free and allow the idea to reach as many people as possible. **
---
💸💸💸💸💸💸
👇 👇 👇 👇 👇 👇
DOW JONES Inverse Head and Shoulders formed. Bullish.Last week (November 19, see chart below), we caught the very bottom of the 6-month Channel Up on the 1D MA100 (green trend-line) of Dow Jones (DJI):
This time we view the price action using the 4H time-frame, where we can see that an Inverse Head and Shoulders has been formed, with its Head being the 1D MA100 bottom.
If more aggressive, it may not follow the typical green Bullish Leg of the Channel Up but the Target remains almost the same at 48900. That is the 2.0 Fibonacci extension. Typically we should see the 4H MA50 (blue trend-line) turning into the Support until the very top.
---
** Please LIKE 👍, FOLLOW ✅, SHARE 🙌 and COMMENT ✍ if you enjoy this idea! Also share your ideas and charts in the comments section below! This is best way to keep it relevant, support us, keep the content here free and allow the idea to reach as many people as possible. **
---
💸💸💸💸💸💸
👇 👇 👇 👇 👇 👇

DOW JONES Will the 1D MA100 save the day?Dow Jones (DJI) has been trading within a 6-month Channel Up and in the past 4 days it has been correcting on its latest Bearish Leg. By doing so, it broke below the 1D MA50 (blue trend-line) and is approaching the 1D MA100 (green trend-line) right at the bottom of the pattern.
This is the Channel's last Support. As long as it closes the daily candles above it, we will be bullish on Dow, targeting 49000, which represents a +7.25% rise, something all previous 3 Bullish Legs did.
---
** Please LIKE 👍, FOLLOW ✅, SHARE 🙌 and COMMENT ✍ if you enjoy this idea! Also share your ideas and charts in the comments section below! This is best way to keep it relevant, support us, keep the content here free and allow the idea to reach as many people as possible. **
---
💸💸💸💸💸💸
👇 👇 👇 👇 👇 👇

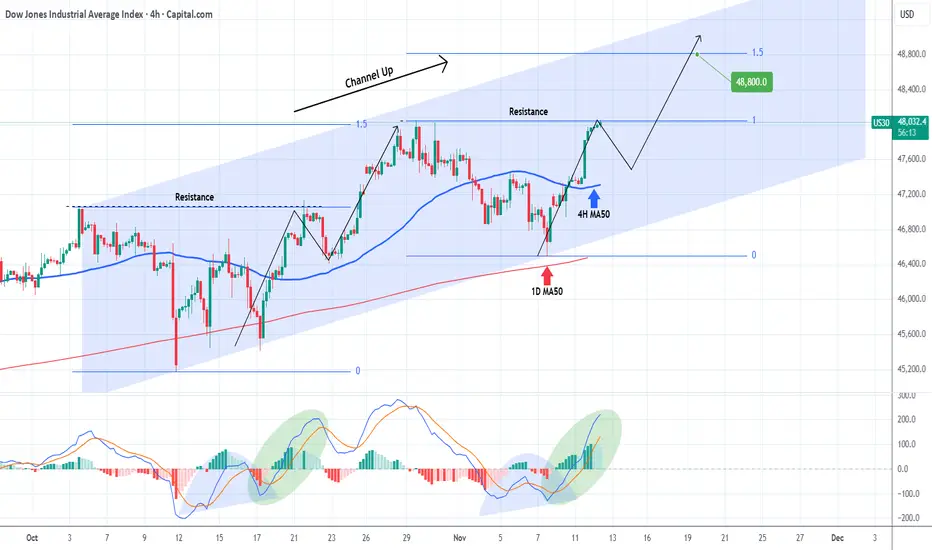
DOW JONES to new All Time Highs and won't stop there!Dow Jones (DJI) has been trading within an aggressive Channel Up since October 03, which made today a new All Time High (ATH). This is its technical Bullish Leg following the Higher Low bottom near the 1D MA50 (red trend-line).
With a 4H MACD sequence identical to the previous Leg, it is possible to see a re-test of the 4H MA50 (blue trend-line) next but on the medium-term, a new Higher High of at least 48800 (the 1.5 Fibonacci extension as on the previous Bullish Leg) is expected.
---
** Please LIKE 👍, FOLLOW ✅, SHARE 🙌 and COMMENT ✍ if you enjoy this idea! Also share your ideas and charts in the comments section below! This is best way to keep it relevant, support us, keep the content here free and allow the idea to reach as many people as possible. **
---
💸💸💸💸💸💸
👇 👇 👇 👇 👇 👇
DOW JONES recovered and is looking for a High at 48500.Exactly 2 weeks ago (October 22, see chart below), we gave a strong Buy Signal on Dow Jones (DJI), as the index had already initiated the new Bullish Leg of its 6-month Channel Up and quickly hit our 47700 Target:
That trading plan included a 2nd Target as well at 48500, which represented a +7.50% rise from the October 10 Low, which was a Higher Low for the Channel Up on its 1D MA50 (blue trend-line).
As Target 1 was on the 1.382 Fibonacci extension, the recent pull-back was technically expected as the sequence was similar to those of August 22 - September 02 among others. As you can see, all minor pull-backs that took place within this Channel Up, hit the 4H MA100 (red trend-line) and rebounded. Major ones found support lower on the 1D MA50, as did the October 10 Low.
Since the index hit yesterday its 4H MA100 and is rebounding today, the Bullish Leg remains valid and on the medium-term can reach our final 48500 Target.
-------------------------------------------------------------------------------
** Please LIKE 👍, FOLLOW ✅, SHARE 🙌 and COMMENT ✍ if you enjoy this idea! Also share your ideas and charts in the comments section below! This is best way to keep it relevant, support us, keep the content here free and allow the idea to reach as many people as possible. **
-------------------------------------------------------------------------------
💸💸💸💸💸💸
👇 👇 👇 👇 👇 👇

DOW JONES approaching the end of its Bull Cycle?Dow Jones (DJI) has been trading within a 16-year Channel Up ever sine the March 02 2009 market bottom of the U.S. Housing Crisis. As this chart shows, we have divided this pattern into three different phases.
Since the March 2020 COVID crash, it appears that the Cycle got restarted as the index broke below its 1W MA200 (orange trend-line) again after 10 years. Technically that was the only time that multi-year Support trend-line broke in 15 years.
In any case, following that Cycle 'restart', it appears that the index is currently inside the Megaphone pattern that in 2015 concluded Phase 2. The conclusion came with a second test on the 1W MA200 (Double Bottom). The first test was the April 07 2025 Low.
With their 1W RSI sequences also identical, having the first 1W MA200 forcing a 30.00 (oversold) RSI rebound, we expect the index to start a new Bearish Leg that might potentially test the 1W MA200 around 39000. For long-term investors, that is the market's next Buy Entry.
-------------------------------------------------------------------------------
** Please LIKE 👍, FOLLOW ✅, SHARE 🙌 and COMMENT ✍ if you enjoy this idea! Also share your ideas and charts in the comments section below! This is best way to keep it relevant, support us, keep the content here free and allow the idea to reach as many people as possible. **
-------------------------------------------------------------------------------
💸💸💸💸💸💸
👇 👇 👇 👇 👇 👇

Live YM Trade - Opening Range BreakoutCBOT_MINI:YM1!
Opening range breakout trade
Set stop orders on both ends for entry
Around a 100 point profit

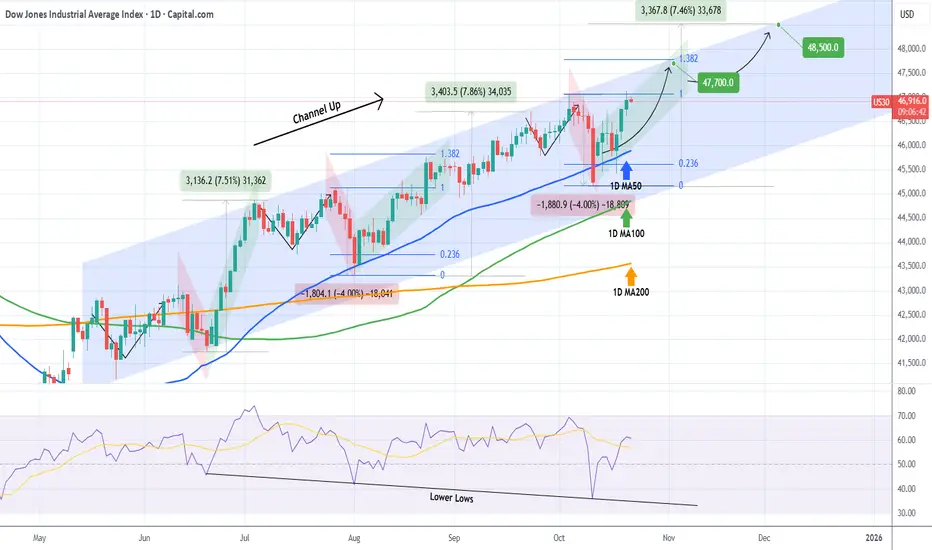
DOW JONES eyes two Bullish Targets before the end of the year.Dow Jones (DJI) has been trading within a 5-month Channel Up and is currently on its new Bullish Leg following the October 10 bounce on its 1D MA50 (blue trend-line).
As you can see, there is a high degree of symmetry between both the Bearish and Bullish Legs within this pattern and if that continues to hold, the immediate Target of the current Bullish Leg is the 1.382 Fibonacci extension at 47700, which we've already mentioned on our previous analysis.
This time however, we also set a second Target towards the end of the year, being a +7.50% rise (standard Leg as you can see) from the bottom at 48500. Both Targets would make ideal technical Higher Highs for the Channel Up.
Notice also how the October 10 bounce took place also on the 1D RSI's Lower Lows trend-line. An additional indication of a strong support for the long-term bullish trend.
-------------------------------------------------------------------------------
** Please LIKE 👍, FOLLOW ✅, SHARE 🙌 and COMMENT ✍ if you enjoy this idea! Also share your ideas and charts in the comments section below! This is best way to keep it relevant, support us, keep the content here free and allow the idea to reach as many people as possible. **
-------------------------------------------------------------------------------
💸💸💸💸💸💸
👇 👇 👇 👇 👇 👇
Breaking Down my Strategy for YM Trade46,700 to 45,700 is my prediction this week. I'm breaking down my thought process for journaling purposes.
