“Mercedes-Benz Stock Struggles Despite India–EU Trade Deal: GlobDespite the landmark India–EU Free Trade Agreement (FTA), Mercedes-Benz Group (MGB) stock remains under pressure due to muted near-term benefits, global demand concerns, and structural limitations in the Indian luxury auto market. The deal is historic, but its impact on MGB’s earnings and pricing power is delayed and diluted.
Why MGB Stock Is Still Under Pressure
India–EU FTA: Long-Term Win, Short-Term Stall
The India–EU FTA, signed in January 2026, reduces import duties on European cars from 110% to 10%, but only under a quota-based system and phased over 5–10 years. Mercedes-Benz India CEO Santosh Iyer called it a “landmark event,” but confirmed there will be no immediate price cuts. The FTA’s fine print is still being studied by automakers, and logistics, homologation, and compliance costs remain high.
Luxury Car Demand in India Is Still Niche
Even with tariff cuts, luxury car penetration in India is less than 2% of total auto sales. Buyers remain price-sensitive, and factors like EV adoption, fuel costs, and urban congestion limit demand for high-end ICE vehicles. MGB’s India volumes are growing, but not enough to offset global headwinds.
Global Macros: Drag on Sentiment
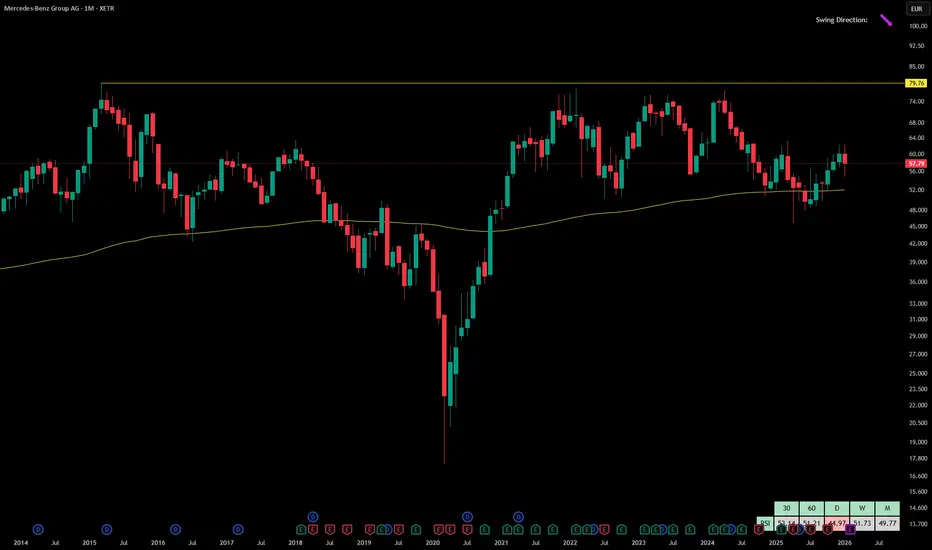
The Eurozone slowdown, China’s weak recovery, and US interest rate uncertainty are weighing on auto exports and investor sentiment. MGB’s monthly chart shows a clear downtrend, with price falling to €57.79, well below the long-term resistance at €79.76. The downward swing and declining volume suggest bearish momentum.
No Immediate Earnings Boost
The FTA does not yet translate into margin expansion or EPS growth for MGB. Investors are waiting for clarity on quotas, localization incentives, and regulatory timelines. Until then, MGB’s India story remains strategic rather than financial.
Technical Snapshot
Current price: €57.79
Monthly high–low: €62.34 – €54.89
Resistance: €79.76
Monthly change: –€2.28 (–3.80%)
Volume: 46.94M
Trend: Bearish
Verdict
Mercedes-Benz Group stock is under pressure because the India–EU FTA, while historic, offers no immediate earnings upside. The luxury auto segment in India remains niche, and global macro headwinds continue to weigh on sentiment. Until pricing, volume, and margin visibility improves, MGB will likely trade below its long-term resistance.
Z-VALUE
SAMVARDHANA MOTHERSONSamvardhana Motherson International Ltd. (CMP ₹113) is a large‑cap auto ancillary company incorporated in 1986. It is one of the world’s largest manufacturers of automotive wiring harnesses, mirrors, polymer parts, and precision components, with a global footprint across 40+ countries.
Promoter: The Sehgal family, founders of the Motherson Group, continue to lead the company, building it into a diversified global auto component giant.
FY22–FY25 Snapshot
Sales – ₹78,600 Cr → ₹95,300 Cr → ₹1,05,200 Cr → ₹1,12,800 Cr
Net Profit – ₹1,040 Cr → ₹1,650 Cr → ₹2,010 Cr → ₹2,420 Cr
Operating Performance – Moderate → Strong → Very Strong → Excellent
Dividend Yield – 0.9% → 1.0% → 1.1% → 1.2%
Equity Capital – ₹563 Cr (constant)
Total Debt – ₹18,200 Cr → ₹16,400 Cr → ₹15,100 Cr → ₹14,200 Cr (steady deleveraging)
Fixed Assets – ₹24,800 Cr → ₹26,200 Cr → ₹27,400 Cr → ₹28,600 Cr
EPS – ₹1.85 → ₹2.93 → ₹3.57 → ₹4.29
Institutional Interest & Ownership Trends
Promoter holding: ~61%, reflecting strong family control.
FIIs/DIIs: Significant exposure, with FIIs attracted to global scale and DIIs supporting domestic growth.
Public float: ~39%, with delivery volumes showing accumulation by long‑term investors.
Strategic Moves & Innovations
Expansion in automotive wiring harnesses and polymer modules across Europe, US, and Asia.
Diversification into aerospace, defense, and medical devices to reduce auto cyclicality.
Aggressive M&A strategy, acquiring global auto component firms to expand product portfolio.
Cash Flow & Balance Sheet Strength
Operating cash flows strengthened in FY25, supported by margin expansion and global recovery.
Free cash flow positive, reinvested into acquisitions and R&D.
Debt reduced steadily, improving balance sheet resilience.
Risk Factors
Dependence on global auto cycles and OEM demand.
Integration risks from multiple acquisitions.
Margin sensitivity to raw material costs and currency fluctuations.
Competition from global auto component majors.
Investor Takeaway
Samvardhana Motherson International Ltd. demonstrates steady revenue growth, margin expansion, and deleveraging, supported by global diversification and EV‑focused innovation.

RELX looking strong fundementallyI like this one more by the day, RELX had quite a slip last year drawing down over -30% however their fundamentals remain strong.
-Many verticals to cling onto
-Subscription based recurring revenue, that along with consistent customer base and you see predictable cash flow
-Poised in a great position for AI integration, actively working on various AI models WITH the hardware to accommodate
-Free cashflow to stimulate any slip ups, this partnered with their Buyback news gives a strong floor for them to hold
They seemingly promise low volatility and steady growth as of lately, tracing new resistance to a COVID fib gives me added confidence. I'll be entering long in the 37-40 area initially and DCAing into the next few months. Looking for TPs at 15% (46.00) and 30% (52.00) removing 25% and 75% of capital respectively. SL will probably be dynamic, hopefully will be able to see the bullet coming with historically low volatility, should be able to get out of the way worst case. All based off technicals and a hunch, just my two cents.

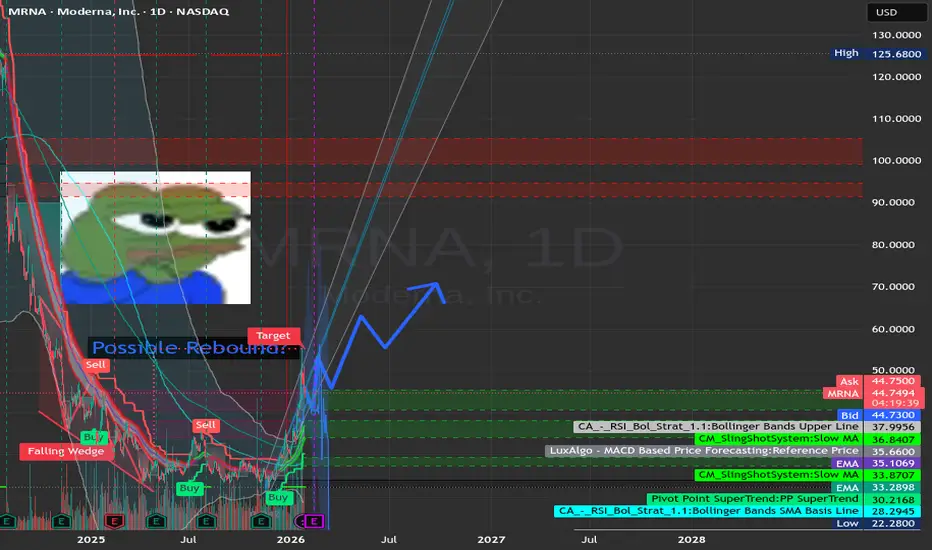
The Case for ModernaModerna ( NASDAQ:MRNA ) looks to be a rebounding stock specializing in RNA therapeutics. Their net income and net margin looks to be in the positive for next earnings by Feb 13th. Their Debt-To-Equity ratio is only 4.2% as per Forbes ( www.forbes.com ) compared to other S&P stocks. Their stock looks to be bouncing back after loss of demand from the Covid Vaccine. Anti-vaccine rhetoric in the United States by the Government and it's supporters makes the future wary for vaccine stocks like NASDAQ:MRNA , but I am entering a trade here based on the fact that their net income may be positive for next quarter, and it will be moreso of a long term trade spanning a couple of months. The lowest that I think it can rise to is $60, but it could go higher than that. Who knows. Worst Case is that It will go back down into to $20-30 range, but then again I am still optimistic that ( NASDAQ:MRNA ) can turn things around. So we'll see. My cost basis for this trade is around 48.5, so that's alright for this stock.
Gold ten years 2.0History doesn't repeat but it's rhymes.
The theme of 72 - 80 are Dollar credit crisis + hyperinflation + geopolitical turmoil
The theme of 01 - 12 are Financial crisis + excessive money supply + low interest rate environment + geopolitical and systemic risks
How about 26 - ?? are all of it?
In first one we got 600%, the second one also a 600% up.
If this is the third one, 600% is pointing at 13k gold.
And look at XAU/XAG, we can get the rising channel is broken at yearly chart. In short silver is different nowadays as the EV cars, AI center etc consume a lot than the past. 1000% from the chart is the least scenario.
I do think a silver alternative as monetary will come oneday. But it won't down until that happen.
Which side do you pick?

Why Volume Profile Changed the Way I TradeWhen I first started trading, I focused on what most beginners do — indicators, patterns, and endless strategies.
RSI. MACD. Support & resistance.
They worked sometimes.
But many times, price moved in ways that didn’t make sense.
It wasn’t until I truly understood Volume Profile that the market finally started to feel logical.
After trading for several years, I can confidently say:
👉 Price doesn’t move because of indicators.
👉 Price moves because of where money is traded.
And Volume Profile shows exactly that.
⸻
What Is Volume Profile (In Simple Words)
Volume Profile is a tool that shows:
• Where the most trading activity happened
• Where big players were interested
• Where price found real acceptance or rejection
Instead of looking at time (like normal volume bars), it shows volume at each price level.
In other words:
📍 It tells you where the market considers “fair value”
📍 And where price is likely to react again
⸻
The Market Leaves Footprints — Volume Profile Reveals Them
Think of the market like this:
Big institutions don’t enter randomly.
They build positions at specific price zones with high volume.
These zones often become:
✔ Strong support
✔ Strong resistance
✔ Major turning points
Volume Profile highlights these areas clearly through:
• High Volume Nodes (HVN) – areas of heavy trading
• Low Volume Nodes (LVN) – areas price moves quickly through
Once you learn to read them, you’ll start seeing:
“Ah… this is where real money stepped in before.”
⸻
Why I Trust Volume Profile More Than Most Indicators
Indicators are calculated from price.
Volume Profile is built from real market participation.
That’s a huge difference.
From my experience:
❌ Indicators react after price moves
✅ Volume shows interest before big moves happen
It helps me:
• Find high-probability entry zones
• Avoid chasing breakouts
• Hold trades with more confidence
⸻
How I Personally Use It in TradingView
Here’s my simple approach:
1. Identify major high volume areas (value zones)
2. Wait for price to return to these zones
3. Look for reaction or confirmation
4. Trade where risk is clear and controlled
No guessing.
No emotional entries.
Just trading around where the market already showed interest.
⸻
Final Thoughts (From a Trader, Not a Guru)
Volume Profile isn’t a magic tool.
But it gives you something most retail traders never look at:
The real story of where money flows in the market.
If I had learned this earlier, I would’ve avoided many bad trades.
For anyone serious about improving their trading —
understanding volume is not optional. It’s essential.

Chesapeake gold- PB ratio of 0.5x
- Eric Sprott is the top shareholder
- The company acquired the leaching technology rights from Hycroft Mining Holding
- Low share price
- Metates project is one of the largest gold and silver deposit
Do your own research!

Manuka Resources (ASX: MKR) – Australia’s only near-term silver Manuka Resources is positioning itself as the only near-term silver producer on the ASX. The company’s Wonawinta Mine in New South Wales is fully permitted and infrastructure-ready, with a confirmed 10-year mine life and planned output of 13.2 Moz silver.
At current silver prices above A$70/oz, and an AISC of around A$31/oz, the project has one of the highest operating margins in the sector. Metallurgical issues from previous operations have been resolved through a new log washer, clearing the way for restart.
Manuka recently restructured its debt, replacing a Hong Kong lender with a consortium of existing shareholders — significantly improving financial flexibility. A binding term sheet with non-bank lenders is now in place to fund the restart, targeting first production and cashflow in Q1 2026.
Additional leverage comes from the Mount Boppy gold project (feed-ready ore) and the large-scale Taranaki vanadium–titanium–iron sands project in New Zealand, which could become a future growth pillar.
With financing near completion and silver momentum building, Manuka stands as a high-leverage, near-term play on rising silver prices.
Please, do your own research!

HOW-TO- Introduction- Blockcircle Fair Value Gap (GAP) IndicatorA detailed step-by-step walkthrough of the open-source BLOCKCIRCLE FAIR VALUE GAPS (FVG) AND VOLUME VALIDATION indicator, which solves the most common FVG (or price value gap) problem: chart clutter from irrelevant gaps and adds two important features, volume validation and trend filtering.
It implements proximity filtering to only show gaps within a configurable percentage of the current price, automatic age-based deletion, and maximum gap size limits to exclude extreme moves. The result is a clean chart showing only actionable gaps near current price action.
You can access it HERE:
I hope you find this tutorial helpful! If you have any questions, please just ask!

Looking at Nintendo as a Strategic InvestmentSo it has been about a month since I last posted an idea. I try not post too many ideas because I feel like if I posted too many ideas about various different companies it would eventually diminish the quality. I decided to write about Nintendo because I don't want to just invest in random companies, psychologically it is much easier for me to buy a company that inspired me somehow. I have been keeping my eye on this ticker for a few months already and today I opened a small position on Nintendo. I don't think the company itself is very risky to invest in but I am keeping my risk to a minimum anyways because earnings are coming up soon.
Nintendo uses capital through a conservative, cash heavy strategy focused on extreme financial self reliance and the long term protection of its intellectual property. As of early 2026, the company continues to maintain a "fortress balance sheet" to weather the cyclical risks of the gaming industry.
Nintendo maintains substantial cash buffers, often exceeding ¥1 trillion (approx. $9.4 billion) in cash and deposits. These reserves protect the company during "bust" cycles if a console hardware generation fails to gain market traction, mitigating risk. Nintendo operates with virtually zero debt, avoiding the interest costs and external pressure typical of Western gaming giants like Microsoft or Sony.
Nintendo is dedicated to expanding and diversifying their library of intellectual property. Capital has been being used to move beyond hardware dependent revenues. There has been a massive capital investment in Super Nintendo World attractions in Japan, Hollywood, and upcoming expansions in Orlando and Singapore. Nintendo has also reached into the movies and streaming market financing high-budget animated films (e.g., The Super Mario Bros. Movie) to broaden brand reach and drive "long-tail" game sales.
Nintendo is notoriously conservative with acquisitions, preferring organic growth over buying external studios. Management views acquisitions as risky because they believe a company's value lies in its talent, which can leave after a buyout. When they do spend, it is often to secure long-term partners, such as their collaboration with NVIDIA for custom chips or purchasing shares in critical developers they already work with.
Technically it seems to be very oversold right now around liberation day lows, personally I am trading the depository receipts. Alright that's all I got to say about that, enjoy the technical analysis and thanks for reading.

Advantage Solutions | ADV | Long at $0.79Advantage Solutions NASDAQ:ADV is a leading outsourced sales and marketing company that provides services to consumer goods brands and retailers (in-store merchandising, sales teams, demos, analytics, and retail execution). They serve 4,000 + consumer packaged goods brands (like Unilever NYSE:UL , Mars Wrigley, Bayer, SC Johnson, and McCormick NYSE:MKC ) and serve 100,000+ retail locations (like Walmart NASDAQ:WMT , Costco NASDAQ:COST , Target NYSE:TGT , and Kroger NYSE:KR ) to execute sales and marketing in-store.
Why Has the Price Collapsed?
Falling revenue & earnings
Heavy debt (debt-to-equity: 2.3x)
Client losses & retail slowdown (slowing retail economy, in-general)
Bull Case
Highly Undervalued (at $0.79, it's trading <0.3x sales and revenue is $3+ billion annually)
Debt reduction underway (allocating most/all of their strong free cash flow to debt reduction, buying back bonds at discounts, etc)
Strong market position with major brands/retailers
Possible turnaround if execution improves
Bear Case
Economic recession
Debt piles even more
Delisting
Action
I suspect this will be a turnaround story or buyout if the market stays stable. Around $0.50 is always a possibility in these cases where the price drops this low for a major company before a substantial rebound. Regardless, while this is a risky play, I am betting on a shift in price soon. Or at the very least, a drop near $0.50 for pump above $1 to prevent delisting, etc. Time will tell.
Targets into 2028
$1.30 (+64.6%)
$2.00 (+153.2%)

OPAL - a potential misvalued hidden gem?Why is a company growing production by 30% YoY trading at a 0.23 P/S ratio?
For years, the market treated OPAL as just another "green fuel" RNG play dependent on the volatile price of RIN (Renewable Identification Number) credits. When RIN prices crashed from $3.13 to $2.15 in late 2025, investors fled. But while the price consolidated at a $2.00 floor, something changed.
Deconstructing the business model and I found a "Double Multiplier" coming in 2026:
- Volume Growth: The startup of Atlantic RNG, Burlington, and Cottonwood projects adds millions of MMBtu in net capacity to a capacity that already grew 30% YOY in 2025.
- Margin Expansion: The shift to Section 45Z credits (recently extended through 2029 via the OBBBA) transforms RNG from a commodity into a high-margin premium product - potentially adding 20-30 million in EBITDA.
- For a stock that was briefly hammered after earnings but recovered quickly once everyone realized that while revenue was down because of the RIN volatility, production was up and a wait and see as a result of those RIN prices was needed.
But with the new credits adding a higher revenue floor with less volatilty, combined with the credit being able to be earned on a larger production capacity too, you start to get the idea.
Then looking at the chart, there was a large candle on Dec. 30th. Originally, perhaps some tax harvesting or something similar I thought. Nope!
- Invesco Ltd.: On January 8, 2026, they disclosed an 18.0% stake (5.2M shares). A massive 77% increase from their prior position. Holy shit!
- Ares Management & NextEra: With 10.5% and 7.4% respectively, we aren't looking at passive investors, we got infrastructure experts.
- Both Co-CEOs have been active buyers in the $2.30–$2.70 range. There has been zero insider selling in the face of 2025’s volatility.
I can add a bull case involving RNG and data center if I wanted to stretch it further, involving the PJM, new projects near data center study requests, etc. for a long hold, but another day perhaps. Let's see this first move.
Lastly, if you like technicals, we have it just recently reclaiming the 200 EMA, my proprietary indicator just had a buy signal appear on Wednesday, and on the weekly chart there is a TTM squeeze as you can see by the chart visual.
Disclaimer: Not financial advice. This represents a deep dive research project based on public filings and technical analysis.

Silver Miners Still Cheap!Silver Miners vs Silver chart (parallel channel)
The more the price of silver goes up, the more profit silver miners stand to make.

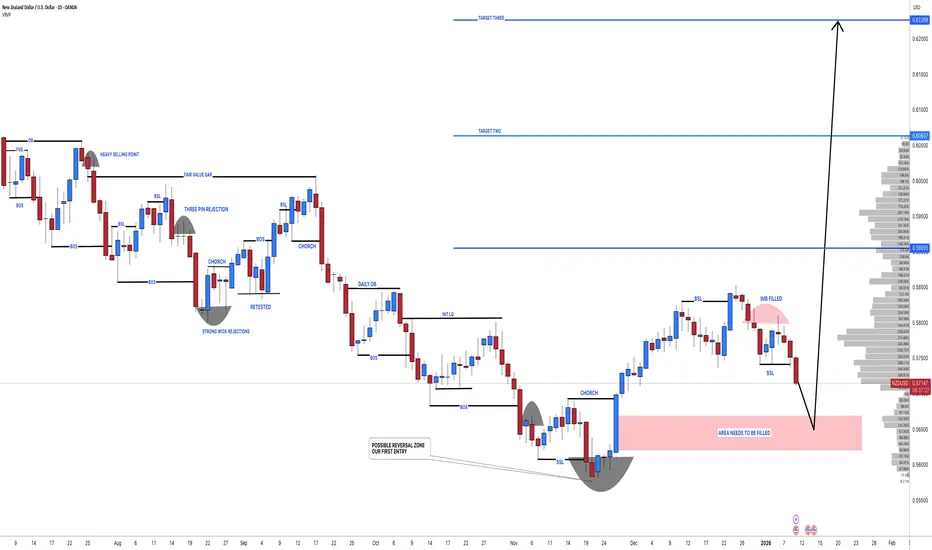
NZDUSD: Latest Chart Analysis 07/01/2026 🔺As per our previous analysis, the price was expected to maintain a bullish trend until all our targets were met. However, we have observed a shift in price behavior, and the price has now reversed, initiating a bearish trend. This presents a favorable opportunity for us, as the price decline is attributed to a previously unaddressed liquidity void.
🔺The entry zone has been clearly indicated by a red box labeled "area needs to be filled." Given the current strong bearish momentum, our entry is anticipated to become active by Monday. Once the entry is activated, the stop loss can be positioned below the designated entry zone.
🔺We have identified three target points that we believe are likely to be achieved within the next couple of months. Kindly utilize this analysis for educational purposes exclusively, and we recommend setting your take-profit levels based on your own informed judgment.
🔺If you appreciate our efforts, please consider liking and commenting for more analyses of these type.
Team SetupsFX❤️🏆
Why 99% of Altcoins Are “Aerotyne”… With a Fan ClubIf you’ve seen The Wolf of Wall Street, you remember that legendary early scene where Jordan Belfort is being told what the stock market really is.
And he gets the most accurate financial definition ever created:
“Fugazi… fugezi… it’s a wazi, it’s a woozy… who gives a f.”*
Now translate that into crypto language and you get:
- Doesn’t matter what the token is called.
- Doesn’t matter what the whitepaper says.
- Doesn’t matter how many buzzwords they stack on top of it like a cursed lasagna.
Because the truth is simple:
It’s not real. It’s smoke. It’s vibes. It’s marketing dressed as math.
And that, my friend, is exactly how 99% of altcoins work.
They’re not investments.
They’re emotions with candlesticks.
The funniest part is that the whole thing has already happened in the movie.
Remember that “Aerotyne” moment?
That random company name no one can pronounce properly?
Aerotyne… Arotine… Aerotine…
It didn’t matter what it was called because he wasn’t selling the stock.
- He was selling the story.
- He was selling the feeling.
- That little dopamine fantasy that whispers: “You’ll pay your morgage.”
That’s basically the entire altcoin market in one sentence.
Now, let me be clear: this isn’t one of those posts where I tell you to “read the whitepaper”, “DYOR”, “be careful guys”, and other sterile advice that sounds smart but doesn’t stop anyone from clicking Buy.
And no, this isn’t coming from bitterness either.
Yes, I’ve lost some money on altcoins last year.
But at least I knew what game I was playing.
- I didn’t marry them.
- I didn’t become their lawyer on Twitter.
- I didn’t start defending my coin like it was my childhood dog.
I took the loss like a man and moved on with one thought:
Alright… enough with small coins.
Because at some point you stop asking “what if it moons?” …and you start asking the adult question: What if it just dies quietly?
And in the altcoin world, that’s not FUD.
That’s not negativity.
That’s just… normal.
Here’s what most people don’t want to admit:
You didn’t buy a coin.
You bought a conversation topic for beer night.
A reason to sit with your friends and pretend you’re not gambling — you’re “investing”.
You bought hours of:
“Bro, have you seen the tokenomics?”
“No, no, you don’t understand… this is Layer 0.”
“Wait, they’re building a new ecosystem!”
“This will change the planet!”
“They’re solving a real-world problem!”
And suddenly you’re not gamblers anymore.
You’re analysts.
Economists.
Visionaries.
You and your friends start comparing coins the way others compare football teams.
Your friend picks one altcoin. You pick another.
And now it’s war.
You defend your token like it’s your club.
He says his coin is better, and you take it personally like he insulted your family name.
“No bro, mine is stronger.”
“Mine has better community.”
“Mine has bigger partnerships.”
“Yours is VC-backed.”
“Mine is organic.”
“Mine is still early.”
Two grown men. Arguing like football fans. Over who chose the better Aerotyne with a modern logo.
That’s what you bought.
Not a coin.
Not an investment.
You bought a social identity.
- A team.
- A badge.
- A belief.
- A conversational piece.
But you also bought something else — something deeper: you bought hope, hope in a dark world.
So when a coin shows up with a clean website, a shiny roadmap, and a promise that sounds like:
“We’re building the future…”
…it doesn’t just hit your wallet.
It hits your psychology.
It hits the part of you that still wants to believe there’s a shortcut to freedom, out the stress, out the routine.
That maybe this is the one thing that finally makes life feel fair.
And there’s nothing wrong with that.
There’s nothing wrong with wanting to believe.
There’s nothing wrong with dreaming.
The problem starts when that hope gets monetized.
Because in crypto, hope isn’t just an emotion.
Hope is a business model.
And yes, some developers are real builders.
But most of them?
- They’re not selling tech.
- They’re selling meaning.
- They’re selling purpose.
- They’re selling belonging.
And trust me — they don’t do it randomly.
They have marketing teams trained in mass psychology.
They understand human behavior better than most traders understand their own charts.
They know:
- people copy influencers,
- people chase excitement,
- people fear missing out,
- people want a tribe,
- people defend what they paid for,
- people confuse “community” with “safety”.
That’s why even dead projects always sound alive.
“Big announcement coming.”
“Major update soon.”
“Partnership incoming.”
“New exchange listing.”
“Something huge is cooking.”
Because the goal isn’t to create value. The goal is to keep hope alive…
And once you see that, you can’t unsee it.
You realize that many altcoins don’t behave like businesses.
They behave like campaigns.
Hype campaigns.
They don’t need revenue.
They don’t need customers.
They don’t even need product-market fit.
They need narrative.
They need a pump.
They need attention.
They need your hope.
And that’s why the new altcoin cycle always looks the same:
The teaser.
The hype.
The “community”.
The influencer wave.
The green candles.
... And then silence.
A slow bleed that turns every proud investor into a long-term philosopher: “I’m holding because I believe in the project.”
No bro.
You’re holding because selling would force you to admit you bought Aerotyne.
So if I had to give one useful piece of advice, it wouldn’t be “DYOR”.
It would be boring.
It would be simple.
It would be this: Trade only big coins .
BTC.
ETH.
SOL.
Use technical analysis.
And most importantly…
Drop the “moon” fantasy.
Because moon trading is not strategy.
Moon trading is religion.
And since I started with a quote, I’ll end with one too.
From the immortals SNAP:
“Don’t believe the hype, it’s a sequel.”
And that’s exactly what most altcoins are.
- Not innovation.
- Not a revolution.
- Not “the next big thing”.
Just a sequel.
An Aerotyne sequel.
An Aerotyne with a community.
An Aerotyne with an X account posting daily optimism.
An Aerotyne with a Telegram group full of people chanting “LFG” while the chart bleeds.
An Aerotyne with a swarm of paid influencers…
…who get copied by thousands of smaller influencers…
…because human psychology never changes:
If you see enough people cheering, you start cheering too.
Even if you don’t know what you’re cheering for.
Even if the coin name sounds like a typo.
Even if deep down you already know…
It’s Fugazi!

Paramount Skydance Corp | PSKY | Long at $11.53Bull Case
Undervalued: Trading at a steep discount (P/S ~0.5x, P/B ~0.7x) compared to peers like Netflix $NASDAQ:NFLX.
Turnaround: New management (post-Skydance merger) is driving $3B+ in cost savings, heavy investment in high-impact content (e.g., UFC deal, major talent signings), and revitalizing Paramount+ streaming growth.
Mergers / Acquisitions: Ongoing bid for Warner Bros. Discovery NASDAQ:WBD could create massive synergies, scale in streaming, and unlock significant value if successful.
Portfolio: Iconic brands (CBS, Paramount Pictures, Nickelodeon, etc.) plus Skydance's production firepower position it for box office/streaming wins and long-term cash flow recovery.
Bear Case
Debt: ~$15B in debt with high interest costs (though lowering) - risk of dilution.
Streaming Losses: Paramount+ is still burning significant cash; subscriber growth has slowed, and profitability remains distant amid competition.
Weak Box Office & Content Risks: Recent theatrical underperformance and uncertainty around major releases could delay recovery.
Technical Analysis
The stock is currently at the bottom of my selected historical simple moving average (see bands). This is often and area of consolidation, but there is a chance that the price dips below the current trading value ($8-$10 is a possibility) in the near-term before moving higher.
Action
Personally, I think the UFC deal is huge - especially the upcoming White Fight in June 2026. Paramount is introducing real-time programmatic ad sales for live sporting events and trying to reduce costs. With interest rates shifting and reducing the weight of the debt burden, this one may be a sleeper. But, near-term downside is a risk ($8-$10). Regardless, at $11.53, NASDAQ:PSKY is in a personal buy zone for a starter position. If the stock falls further to the predicted "lows", more entries will be made if the outlook stays bullish.
Targets into 2029
$15.00 (+30.1%)
$22.00 (+90.8%)

Iluniam: Crypto Market Can Surge in the Morning and CrashAt Iluniam, we analyze real-time crypto market behavior every day and observe the same pattern repeatedly: Bitcoin or Ethereum opens the day up 4–8%, climbs to +12% by midday, then drops 10–15% from the peak by evening or the next day — often with no major news, no Fed reports, no loud regulatory announcements. In 2025–2026, such intraday reversals have become the norm rather than the exception.
Why does the market behave like this? At Iluniam, we believe the root cause lies in a fundamentally changed market structure. Here are the key factors driving these “rollercoaster” days.
Thin Liquidity and Empty Order Books
Spot liquidity on most major exchanges (especially outside the top 3) remains extremely shallow compared to futures volumes. When large players or algorithms start pushing the price, there simply aren’t enough resting limit orders in the book to absorb the impulse.
Result: $50–100 million in buying can drive the price up 5–7% in minutes because “the book is empty.” The reverse happens on selling — price collapses just as fast. At Iluniam, we constantly monitor order-book depth across key pairs and see that liquidity is particularly thin during Asian sessions and overnight UTC hours — exactly when the sharpest moves tend to originate.
Dominance of Futures and High Leverage
Today, more than 70–80% of total trading volume in Bitcoin and major altcoins occurs on perpetual futures. Most participants trade with 10×–125× leverage. This means real spot-price movement is often dictated not by organic supply/demand, but by cascades of margin positions in derivatives.
When price moves up — shorts get liquidated, creating additional buy pressure → momentum accelerates. When reversal hits — longs get liquidated, sell pressure grows exponentially. At Iluniam, we call this “futures dominance”: spot follows futures, not the other way around.
Liquidation Cascades — Primary Driver of Reversals
Data from Coinglass, Bybit, and others shows that on days with sharp intraday swings, liquidation volumes frequently exceed $1–3 billion within just a few hours. One strong upward impulse → mass short liquidations → even stronger impulse → overbought conditions → reversal → mass long liquidations → crash.
This is a self-reinforcing loop. At Iluniam, we track liquidation levels in real time (heatmap, funding rates, open interest by strike) and observe that the biggest reversals almost always occur precisely when price approaches large clusters of liquidations.
Algorithmic Trading and HFT
A significant portion of volume today comes from high-frequency algorithms, market makers, and arbitrage bots between spot and futures. They react to momentum in milliseconds: amplifying trends while strong, and instantly flipping direction as soon as order flow or funding rate shifts.
When retail and small funds start FOMO buying, algos join and accelerate the move. As soon as momentum fades — they switch to short and speed up the decline. At Iluniam, we see this clearly in the tape: often 70–80% of volume in a given moment comes from bots.
Emotional Retail Decisions — Fuel for Impulses
Retail traders (especially via mobile apps) react to price action with a lag: see +8% → pile into longs → amplify the move → price reaches liquidation zone → reversal → panic selling → crash. This “crowd effect” is especially pronounced during Asian and U.S. sessions.
At Iluniam, we analyze retail behavior through Google Trends, social sentiment, and volume on retail-focused exchanges — and find a clear correlation: FOMO peaks almost always coincide with daily local highs.
Conclusion
The modern crypto market thrives on volatility — and punishes those unprepared for sharp reversals. Thin liquidity, leverage-driven futures dominance, liquidation cascades, algorithms, and emotional retail participation have created an environment where 10–20% intraday swings are routine, not anomalies.
At Iluniam, we help clients avoid becoming victims of these mechanics:
real-time tracking of liquidation levels and open interest,
filtering signals with order-book depth and funding-rate context in mind,
avoiding trades during “empty book” periods and clustered liquidation zones,
using more conservative leverage and strict risk management.
The crypto market hasn’t become “broken” — it has simply evolved. Those who understand its new mechanics survive and profit. Those who trade by the old 2017–2021 rules pay the price.

Grounded Lithium 5x inboundSee my previous post on this ticker for more details.
In short, Grounded Lithium's Kindersley property has an estimated after tax NPV at 8% discount of ~$1B with a lithium hydroxide (carbonate?) price of $25,000 per tonne. Lithium prices have made an extreme move this past month and is selling for at least $22,000 per tonne.
The Kindersley project is partially funded by Denison Mines Corp (DNN) who is making bank on their uranium projects and is financially loaded currently. DNN currently owns 25% of the Kindersley project, or $250M of NPV. This will likely rise to 55% soon, pending further funding.
Grounded Lithium will release their Pre-feasibility Study (PFS) on the project soon, which will likely show an increase in NPV and a decrease in all-in-sustaining costs. There is little to no share dilution for the foreseeable future.
This is a lithium ticker that took a beating the past few years and has never seen a proper bull run. The company is sound, the financials are sound, the project is decent (and not American).
I believe we will see the price run up to and past $0.3 USD, potentially higher, leading up to the PFS. If the PFS is golden, then I think $0.5 USD and higher.
Assume stock market cap reaches 15% of NPV, Grounded Lithium owns 45% interest in Kindersley property, this gives a market cap of $67.5M, with share price of $0.9.
The price has broken above a strong resistance and has held for weeks at this level.
Finally, weekly RSI is on the rise.

Double bottom?CRYPTOCAP:DOGE KRAKEN:DOGEUSD
Correct me if I am wrong, but it appears that the daily DOGE candle have made a double bottom pattern. That would be one of the last buy-signals after it made a bullish divergence on the daily RSI a few weeks ago.
#DOGE #CRYPTO

Double bottom?Correct me if I am wrong, but it appears that the daily DOGE candle have made a double bottom pattern. That would be one of the last buy-signals after it made a bullish divergence on the daily RSI a few weeks ago.

$DFLI is back on its original launch pad. What happens next?The last time NASDAQ:DFLI broke the top of the current range from the underside, with technicals following positively, the path of least resistance was straight up.
I believe there is a chance this occurs again. With the price absorbing energy and accumulation within a very tight current range almost identical to its previous base, I think this is a great area to work long from.
The market has absorbed a lot of news from NASDAQ:DFLI since last September. Now that the stock is back on its launch pad, it may attract institutional commitment.
This is also coinciding with a perfect Elliot Wave cycle completion, allowing for a new cycle to begin.
GL!

Constellation Brands | STZ | Long at $134.50Constellation Brands NYSE:STZ
Technical Analysis:
Currently trading just below my "crash" simple moving average area. This area is often a bottom, even if temporary (sometimes there is a continuous stairstep down, though). There is a high probability the stock could drop down to the "major crash" zone ($120 and below) in the near-term, but all price gaps on the daily chart since 2020 that were open below the current price are now closed (bullish).
Earnings and Revenue Growth
Projected earnings increase from 2025 ($11.6 billion) to 2028 ($15.4 billion): +38.2%
Projected revenue increased from 2025 ($9.1 billion) to 2028 ($9.8 billion): +8.3%
www.tradingview.com
Health
Debt-to-Equity: 1.6x (high)
Altman's Z-Score/Bankruptcy Risk: 3.1 (excellent/very low risk)
Insiders
Warning: Selling outweighs buying.
openinsider.com
Action
Constellation Brands hold a number of major names in the alcohol industry. While sales have slumped and revenue growth is weak, it's a solid company paying a +3% dividend. I do not expect this to skyrocket any time soon, so those into overnight returns may want to pass. The decision to enter is primarily based on technical analysis and name-brand recognition. I am also going to keep my target low for a swing trade due to the unknown economic times ahead.
Targets in 2028
$158.00 (+17.5%)
$178.00 (+32.3%)

Gelaxy IG: Why Stablecoins Lost StabilityIn the cryptocurrency world, stablecoins have long been viewed as a safe haven — digital assets pegged to the US dollar, promising a near-perfect price of $1 with virtually no fluctuations. They are used for hedging volatility, fast transfers, margin trading, and as an entry/exit point in DeFi. However, in recent years — especially throughout 2025 — we have increasingly seen even the largest stablecoins deviate from their peg, sometimes for hours and sometimes for days. For traders, this is no longer a rare anomaly but a systemic risk that must be factored into any strategy. Let’s break down why this is happening and how to adapt.
Liquidity Issues During Panic Moments
The most common reason for deviations is a sharp imbalance between supply and demand during periods of market stress. When Bitcoin and altcoins drop sharply, traders and investors rush to exit into “dollars” — meaning stablecoins. But if exchanges lack enough buyers at $1, or if the issuer cannot quickly provide liquidity for fiat withdrawals, the stablecoin’s price begins to fall below the peg.
During such periods, spreads on exchanges widen dramatically, and on decentralized platforms massive slippage occurs. This creates a cascading effect: position liquidations, margin calls, panic selling — and the price can drop 5–35% below $1 in just hours.
Dependence on Reserves and Market Trust
Fiat-backed stablecoins (USDT, USDC, BUSD, and others) hold reserves in banks, Treasury bonds, commercial paper, and other assets. As soon as doubts arise about whether these reserves are real, accessible, or sufficient, trust collapses — and outflows begin.
It only takes one major negative event — a banking crisis, regulatory pressure, asset freezes, or even a viral rumor on social media — for the price to fall. Decentralized and algorithmic models are even more vulnerable: they rely on arbitrage and over-collateralization mechanisms that break down during panic.
Price Deviations Among Major Stablecoins
In 2025 we witnessed several notable cases:
USDT repeatedly dropped below $0.95–0.97 amid global sell-offs and capital outflows from Asian markets.
USDC showed short-term deviations to $0.98–0.99 during banking news and regulatory noise.
Certain DeFi-oriented stablecoins (including algorithmic and hybrid models) lost 10–35% from their peg, triggering millions of dollars in liquidations across protocols.
These events are no longer seen as exceptions — they have become part of the market cycle.
Risks of Centralized vs. Algorithmic Models
Centralized stablecoins (USDT, USDC, etc.) depend on the issuer:
regulatory risks (account freezes, sanctions, audit demands),
banking risks (reserve freezes, as seen in the past),
operational risks (hacks, errors).
Algorithmic and hybrid models are vulnerable to:
“death spirals”,
lack of arbitrageurs during stress,
smart-contract exploits,
oracle manipulations.
In both cases, systemic risk remains: a depeg of one major stablecoin can trigger a chain reaction across the entire market.
How to Use Stablecoins Correctly in Trading
To minimize damage, a modern trader should:
Diversify — never keep all funds in a single stablecoin. A popular combination: 50–70% USDT/USDC + 20–30% in decentralized options + a small portion in fiat.
Monitor in real time — track prices across different exchanges (CEX + DEX), volumes, spreads, and issuer-related news.
Use limit orders — avoid market orders when converting during high volatility.
Have an exit plan — define in advance the levels at which you move from stablecoins to fiat or other assets.
Avoid excessive leverage — using stablecoins as collateral with high leverage can lead to rapid liquidation during a depeg.
Conclusion
Stablecoins are a convenient and powerful tool, but they are far from a guarantee of absolute stability. In 2025–2026, depegs have become a regular occurrence, especially during periods of market stress. Understanding their mechanics, risks, and limitations has turned into an essential skill for any serious trader.
Gelaxy IG reminds you: stability is not a property of the asset — it is the result of your strategy and level of preparation. Trade consciously.
Gelaxy IG — your partner in understanding modern crypto markets.
