Prospects for movement on ZEC!Hello everyone 👋🏼
Many people in private messages ✉️ ask about further movement on ZEC
📌 Today we will look at what prices will be interesting for purchases and to what values the coin may still fall.
❕ Here I want to immediately indicate that the main timeframes are currently in a downward trend
▫️ During the month, the price adjusted to a large imbalance zone, covering 50%
Last month was too aggressive, and the current one also shows a tendency for the seller to prevail. 📉
Below there is another small imb zone at around $74 - $46 (I don't think they will let us buy at such prices, but I mean there is an imbalance)
▫️ On the daily timeframe, the price is under an uptrend, which has already been reacted to before the growth
At this stage, I am considering the option of forming a sideways movement or correction within the framework of a descending wave.
If the market shows weakness again, then seeing the coin in the range of $120 would be a good buying point, since in the future I consider this asset at around $1000
💡 The chart shows one of the movement options that I am considering within the framework of the current market behavior. Everything can change in a moment. For growth, I focus on the price going beyond the downward trend or after the accumulation phase.
Have a good trade and profit, everyone 💵
Please leave🚀 and write in the comments which coins you would like to see 🔎 at the next showdown.
Zcash


ZEC - Time to lay a bit (part.3)Our little pause from our previous zec shorts went well, its now almost back at our entry price !
4h showing a fake out with high volume and a break of a lower trendline
> thats my short signals
(sorry volume not showed here but be sure im using it)
I will TP on all the fibs retracement (same not showed on chart) and refill on shorts if I see bearish continuation !
Im playing very safe here as i expect BTC to go higher than 94 at some point
I will react on whats happening later !
Will let you know all by updating this idea
SL around 600
Cheers

ZEC 1W update: approaching the $300 inflectionZcash is now rotating back toward the $300 level, and this is a very important area from a higher-timeframe perspective.
Context first:
ZEC went from a long period of compression into a vertical expansion, followed by a sharp rejection and distribution. What we’re seeing now is not random downside – it’s a mean reversion back toward the first major support formed after the breakout.
Why $300 matters:
• It’s the prior breakout / acceptance zone
• It acted as support on the first pullback
• It’s where buyers previously stepped in aggressively
• Losing it would signal failed acceptance; holding it keeps structure intact
As price approaches this level again, there are two clean scenarios:
Bullish / constructive
If ZEC holds ~$300 with weekly closes and reduced sell pressure, this becomes a higher-timeframe higher low. That would favor:
• Base building
• Volatility compression
• Potential re-expansion toward $380–450 later
Bearish / invalidation
If $300 loses with acceptance below, the move starts to look more like a blow-off top rather than a trend shift, opening the door to deeper mean reversion.
Right now, this is a decision zone, not a panic zone. Strong trends retest their breakout levels. Weak ones lose them. ZEC is approaching the line where that distinction gets made.
Patience here matters more than prediction.

$ZEC 1D Update: Into the chop here ZEC update.
ZEC is firmly in the doldrums right now. Price is all over the place with no clear directional control, and the chart is telling a story of chop rather than trend.
After the sharp breakdown and the fast bounce that followed, ZEC has failed to reclaim the prior uptrend structure and is now stuck rotating in the middle of the range. Rallies are getting sold, dips are getting bought, but neither side is showing conviction. That’s classic consolidation behavior after a high-volatility move.
The $400–430 area is acting as a noisy pivot zone where price keeps flipping back and forth. This is not a level to expect clean follow-through. Above here, there’s still heavy overhead supply from the prior breakdown. Below, buyers continue to defend in anticipation of another bounce, which is why price isn’t collapsing either.
The only higher timeframe level that really matters remains $300–310. As long as that zone holds, this chop can be interpreted as digestion rather than full trend failure. But until price either decisively reclaims the mid-$400s or flushes closer to $300, ZEC is likely to remain frustrating and directionless.
This is a low-quality environment for momentum trades. Patience is key here. ZEC tends to resolve these dull, messy ranges with expansion, but right now it’s firmly in chop mode, and the chart is reflecting that clearly.

$ZEC 1D Update: Catching a pump ZEC update.
ZEC is catching a strong bounce here after the recent flush, and the response off the lows is notable. Price has reclaimed the $400 area with an impulsive move, which suggests there was real demand waiting rather than just a weak oversold bounce.
This move comes after a sharp breakdown, so it’s important to keep context. Rallies following high-volatility selloffs are often fast and emotional, and they don’t automatically mean the trend has flipped back up. However, the fact that buyers stepped in aggressively before a full retest of $300 is constructive in the near term.
The $430–450 zone is now the key short-term area to watch. Holding above this region keeps the bounce alive and opens the door for a push back toward the $480–520 range, where prior support has likely turned into resistance. Acceptance above that would be needed to talk about a more meaningful trend repair.
On the downside, $300–310 remains the higher timeframe line in the sand. As long as that level holds, this still fits a volatile consolidation after a major advance rather than a full structural failure.
Overall, ZEC pumping here looks like a volatility-driven rebound inside a broader corrective phase. It’s constructive, but still needs follow-through and structure before it can be called “back on track.” Patience and level-to-level trading matter here more than chasing the candle.

ZCSH huge ZCASH moon begins 2024 ends Apr 2025This is not financial advice
$1.70 buying
$27.00 selling
20 month position duration
1,500% estimate return

ZEC Zcash redemption arc 2025 $500This Privacy Project has been a terrible performer. So anticipate more of that trend.
However since it is PoW and has a Halving in just over 1 year, that following supply deterioration should create a pump cycle
In the 12 months ahead prior to halving I will recommend DCA under $30 and then plan to begin selling above $150
O' Barry Where Art Thou?

Zcash update · Moving lower based on Elliott Wave TheoryZcash is another project that has an inverse relationship with Bitcoin, when it comes to price action.
ZEC started a strong decline after a 3,000%+ bullish wave on the exact same date that Bitcoin ended its correction, 21-November 2025. Bitcoin started to move up as Zcash started to move down.
Now, ZECUSDT is about to produce a bearish continuation; a lower low and major crash. Which can be translated into Bitcoin, and the rest of the altcoins market, as producing a strong bullish resumption and/or continuation. Awesome. Let's look at this chart.
ZECUSDT is trading below EMA55. This is extremely bearish because it is happening after a major high. If we look back to August 2025, ZEC was trading below EMA55 but conditions were bullish because the action was coming out of a major low—context. Signals are no good in isolation. The interpretation of a signal requires the whole chart structure for the conclusion to be accurate.
There you have it. The incoming lower low will be the C wave of an ABC correction. First, we have the bullish impulse, a 1-2-3-4-5 advance (5 steps). After an impulse we get a correction—ABC (3 steps). The entire sequence gives us an 8. Five steps forward, three steps back. Elliott Wave Theory.
Thank you for reading.
Namaste.

Bull Flag Breakout for ZCashVenezuela Just Proved the ZCash Bull Case, And No One Is Paying Attention
Maduro used Tether to move 80% of Venezuela's oil revenue. Billions in sanctions evasion, settled on Tron since 2020.
Then the US made a phone call.
Tether froze the wallets.
Game over.
Everyone's focused on the arrest. The real story is the lesson every finance minister on earth just learned in real time:
Stable coins are a leash, not an escape.
If someone can freeze it, it isn't money. It doesn't solve sovereignty.
First principles:
USDT is dollar plumbing without SWIFT. Faster. Cheaper. Still has a CEO. Still has a compliance department. Still picks up when Washington calls.
This is why USDT adoption exploded, 71-year-old grandmothers in Caracas pay their HOA fees in tether now. But useful ≠ sovereign.
The entire value proposition for sanctions evasion just got publicly falsified.
Now do the game theory:
You're Iran. Russia. Any country hedging against dollar weaponization. You just watched Venezuela's "crypto solution" get shut off like a light switch.
Where do you put reserves now?
USDT? Compromised.
Yuan? Political strings.
Gold? Try settling $500M across borders in 10 minutes.
CBDCs? Same kill switch, government branding.
There's exactly one asset that clears final settlement without asking permission from anyone.
21 million units. No CEO. No freeze function. No phone number.
This is the ad ZCash never had to buy.
The most desperate, highest-stakes capital on earth just learned there's only one door.
ZCash is showing bullish momentum that is not fading, Satoshi did a screen play with Bitcoin, but I believe ZCash was the true vision.

Zcash: Range market, seller initiative, conditions for buyingHi traders and investors!
On the daily timeframe, the market is in a sideways range, with the current initiative remaining on the seller’s side. Seller targets are located in the 301.14–299 area.
Previously, buyers attempted to start an upward move, but the 50% level of the trading range (524.02) prevented the price from holding above it. As a result, the buyer initiative was stopped, and the price moved into a decline.
Within the current structure, two key scenarios can be identified for searching for long positions.
Buying from the 476.76 level.
Longs should only be considered if the price holds above 476.76. This would signal a return of buyer activity and a potential continuation of movement within the range.
Buying after liquidity is collected below.
A move below the lower boundary of the range with liquidity taken below the two extremes 301 and 299, followed by a return of the price back into the range (above 299). In this case, conditions for searching for long positions will appear.
The target for longs in both scenarios is the 560 area.
Until one of these conditions is met, the priority remains on a wait-and-see approach.
Local short opportunities can be considered on the hourly timeframe.
Profitable trades!
This analysis is based on the Initiative Analysis (IA) method.

$ZEC 1D Update: Post-dev drama dump ZEC update.
Technically, this is a gnarly breakdown on the daily. Price has rejected the prior uptrend structure and is now putting in an impulsive leg lower, which usually means volatility is not finished yet. The bounce structure that was holding the higher lows has been lost, and we are back in “find the next real bid” mode rather than “trend continuation.”
Key levels I’m watching:
400 area (roughly where price is now) is a short-term pivot, but after this kind of sell candle it often acts as overhead supply on any bounce.
300–310 remains the major higher timeframe line in the sand. That level was the launchpad for the last expansion and the cleanest demand shelf on the chart. If we tag that zone, I’m watching for a reaction (slowing momentum, reclaim attempts, and better candle structure). If 300 loses on daily closes, the market likely needs more time to rebuild and the drawdown risk increases materially.
Fundamentals are messy right now and that matters for sentiment and liquidity. Multiple outlets are reporting that the entire Electric Coin Company team resigned / split following a governance dispute with Bootstrap (the nonprofit tied to ECC), and plans are being discussed around the team forming a new entity.
This doesn’t “kill” Zcash from a protocol standpoint (it’s open source and other contributors exist), but it does inject real uncertainty around coordination, roadmap execution, and optics, which can amplify volatility in the token.
DL News
How I’m treating it:
This is now a high-volatility, headline-sensitive environment. I’m not interested in guessing bottoms in the middle of a breakdown. I want to see where price stabilizes, and for me the most important read is the reaction at 300. If buyers can defend that zone and rebuild structure, it can set up the next tradable leg. If 300 fails, the market is telling us it needs a deeper reset before it can get “cooking” again.

[SHORT] ZECUSDT - Continuation Trend?Hello traders!
Will ZEC continue to offer opportunities in a downtrend?
If price revisits the Golden Zone and forms a Bearish Engulfing, it could be a valid setup.
Make sure the candle closes within the Golden Zone before entering a SHORT position.
Targets are already set — and be sure to manage your Stop Loss properly.
Happy hunting! 🎯📉

$ZEC: Biggest Stress TestZcash just went through a major stress test. After the full Electric Coin Company team resigned, the market reacted fast with panic selling, pushing the price down roughly –30%.
CRYPTOCAP:ZEC briefly dipped near $380, the sell-off followed a governance dispute that led the ECC team to exit. This isn’t abandonment though — the same developers are regrouping under a new independent company and plan to continue building, including a new wallet based on the existing codebase.
TECHNICAL VIEW:
The main hurdle right now sits around the $460–490 area, lining up with the diagonal trendline resistance. Price has already struggled here multiple times, so another rejection could send CRYPTOCAP:ZEC back toward the $360 region. Ideally, this level holds — but if it doesn’t, a deeper pullback into the $300–250 demand zone wouldn’t be surprising.

Zcash ZEC price analysisCRYPTOCAP:ZEC holders, it’s time to be extra careful.
Over the past few months, #Zcash showed solid strength.
Over the last weeks — the price was clearly being “held” around key levels.
But now OKX:ZECUSDT is entering a truly critical zone.
⚠️ Key levels to watch:
$300–310 — a crucial support area. Holding above it keeps the medium-term structure alive.
A daily close below $300 may open the door to $190–200 — and that’s still a relatively optimistic downside scenario.
From a pure technical perspective, the global trendline sits much lower, around $100–110, and by TA rules it may eventually be tested.
CRYPTOCAP:ZEC is currently at a crossroads:
either buyers defend the structure,
or the market transitions into a deeper redistribution phase.
👉 What’s your take: will $300 hold, or is CRYPTOCAP:ZEC heading for a much deeper correction?
______________
◆ Follow us ❤️ for daily crypto insights & updates!
🚀 Don’t miss out on important market moves
🧠 DYOR | This is not financial advice, just thinking out loud

Will ZCash go Down?What Zcash (ZEC) Actually Is:
Zcash is a privacy-focused cryptocurrency that was created in 2016 as an alternative to Bitcoin.
Kriptomat
Key features: Like Bitcoin, it’s a digital currency with a limited supply and proof-of-work consensus.
The major difference is optional privacy:
ZEC uses zero-knowledge proofs (zk-SNARKs) to allow private, encrypted transactions where the sender, receiver, and amounts are hidden. Users can choose shielded (private) or transparent transactions depending on their needs. So its value proposition is privacy, which appeals to people who want more confidentiality than Bitcoin’s public ledger offers.
Why Zcash Has Surged Recently
In 2025, Zcash has had strong rallies, even outperforming many other cryptos:
Possible reasons for the recent run:
1) Privacy coin demand:
Privacy coins like Zcash and Monero have outpaced most sectors in 2025. Rising interest in digital privacy and financial confidentiality boosts demand for privacy-focused tokens.
2) Technical breakout and adoption:
Innovations (e.g., protocols like Zashi CrossPay expanding use cases) can push utility and liquidity.
3) Market rotation:
Some analysts believe traders rotate capital from Bitcoin into altcoins like ZEC when BTC is tiring or consolidating, which can lift ZEC even when BTC isn’t rising strongly.
Why Zcash Can Go Down
1) Correlation with Bitcoin:
Even if ZEC can decouple, crypto markets still broadly move together. In periods when Bitcoin rallies strongly, many altcoins also rise because market sentiment improves. Conversely, if BTC drops to $70–60k or weaker conditions return, liquidity often shifts back to BTC, and many altcoins, including ZEC, may fall too.
2) Negative or weak correlation is fragile:
Some observations show Zcash can have inverse or low correlation with Bitcoin, meaning sometimes it rises when BTC falls. But that relationship is not stable, and if the overall market environment turns bearish again, that correlation can weaken or reverse.
3) Profit-taking and volatility:
After strong rallies, traders often take profits, which can cause sharp corrections. Liquidity is relatively thinner than major assets, so price swings can be abrupt.
4) Regulatory risk:
Privacy coins face increased regulatory scrutiny, which can dampen demand if governments restrict or delist privacy-focused tokens.
How Bitcoin (BTC) Affects Zcash
Bitcoin is still the dominant market driver in crypto:
Many altcoins historically move with BTC’s direction, up in bull markets and down in bear markets.
Even if ZEC occasionally outperforms or diverges, prolonged declines in BTC often reduce overall crypto risk appetite, negatively impacting altcoins. So if BTC falls significantly (e.g., to $70–60k), ZEC may face selling pressure too, even if it has its own narrative, because: investors tend to exit riskier assets first; funds rotate back into BTC as the “safe crypto”; liquidity for smaller assets dries up faster
Disclaimer:
This analysis is for informational and educational purposes only and does not constitute financial advice, investment recommendation, or an offer to buy or sell any securities. Asset prices, valuations, and performance metrics are subject to change and may be outdated. Always conduct your own due diligence and consult with a licensed financial advisor before making investment decisions. The information presented may contain inaccuracies and should not be solely relied upon for financial decisions. I am not a licensed financial advisor or professional trader. I am not personally liable for your own losses; this is not financial advice.

ZEC 1D Update: Bucking the uptrend again ZEC is bucking the uptrend again in the short term, and the price action is starting to look more volatile rather than clean continuation. After riding the rising channel higher, price has rolled over near the upper portion of the structure and is now slipping back toward the mid-range instead of holding the highs.
This kind of behavior usually signals that the market isn’t ready to trend yet. Momentum has cooled, upside follow-through stalled, and price is breaking short-term support, which opens the door for more back-and-forth and potentially another push lower before any sustained move higher develops.
Importantly, this doesn’t break the broader bullish structure. As long as the larger support levels hold, this still looks like digestion after a strong advance rather than a full trend failure. ZEC has a history of being messy before it really starts moving, and this volatility fits that pattern.
My base case here is more chop and possibly lower prices in the near term, shaking out late longs and resetting momentum. If that happens while higher timeframe support remains intact, it likely sets the stage for a stronger move once it finally gets cooking. For now, patience matters more than prediction.
Zcash - Time to buy again!The price on the 6h timeframe is within an ascending triangle, which can be promising. If the price breaks this pattern with bullish candles, it could easily rise by the distance of AB=CD.

Zcash: Mapping the Multi-Layer Retest | Path to Trendline RetestZcash will enter a critical decision phase if price falls and holds under $491, which suggests a potential shift in momentum that places us in a consolidation range. We would then be operating within a consolidation box potentially. My focus is on the multi-layered support structure below us.
Near-Term Bullish Structure: We must hold the $473–$479 area. A bounce and break back above the 490s here keeps the immediate momentum intact.
The Fake-out Risk: Watch $468 closely. "Prior highs become support" logic suggests a bounce point, Could be a potential fake-out zone to catch late shorts chasing a trendline breakdown—don't get trapped.
The Mid-Layer: Below the potential fake-out zone, we have a secondary structural layer encompassing the prior and secondary highs.
The Macro Target: The actual trendline retest—and the highest-probability entry—sits in the $432–$435 confluence zone. This is the 3rd layer where the full breakout logic is truly tested.
⚠️ Risk Management & Invalidation
While the outlook remains constructive above the trendline, we must respect the downside risk:
The Red Flag: If price falls and closes under $425, the bullish retest thesis is under significant pressure.
Structural Breakdown: A break under the $390–$405 zone would suggest that the probability of a further breakdown has increased significantly.
The "C-Wave" Scenario: Losing the $390 level could trigger a major C-Wave correction, potentially leading to a deep retracement as low as the mid-$200s.

ZEC looks short.BINANCE:ZECUSDT.P
It looks short. I would short the areas of the first liquidity accumulation on the hourly chart. I have indicated all ranges on the chart. Set a stop above the December highs.
Use your risk management (RM).

Zcash Breakout Long IdeaIf you're like me, you missed the "privacy coin" meta narrative that sent Zooko's Zcash CRYPTOCAP:ZEC (and to a lesser extent, monero CRYPTOCAP:XMR ) soaring to prices NOBODY had on their bingo cards.
I haven't traded either of these dino coins since 2019 and 2020, respectively, but here we are. I actually love the renewed interest in privacy because it's true to crypto's cypherpunk origins and fights back against increasing surveillance.
But if you didn't ape Zcash early, like me, you got woefully sidelined, waiting for THIS MOMENT, a better entry point (potentially).
ZEC has retraced and printed a nice double-bottom pattern and now a potential cup & handle beneath a key S/R level. I think this long gets a lot less risky if you wait for a break above resistance + confirmation of S/R flip around that $443 level. Of course, you might get front run and it could just take off, so don't get too cute with it.
While ZEC fully decoupled from the rest of the crypto market during it's epic rally, this trade is probably at least somewhat dependent on BTC's cooperation and continued rally as bulls fight to defend 90k and push higher. IF instead we see a continuation of the downtrend, I think the odds of Zcash rallying are significantly lower.
Potential target levels: $528, $572, $644 and I would keep a tight SL given the shaky market conditions.
happy trades,
CD

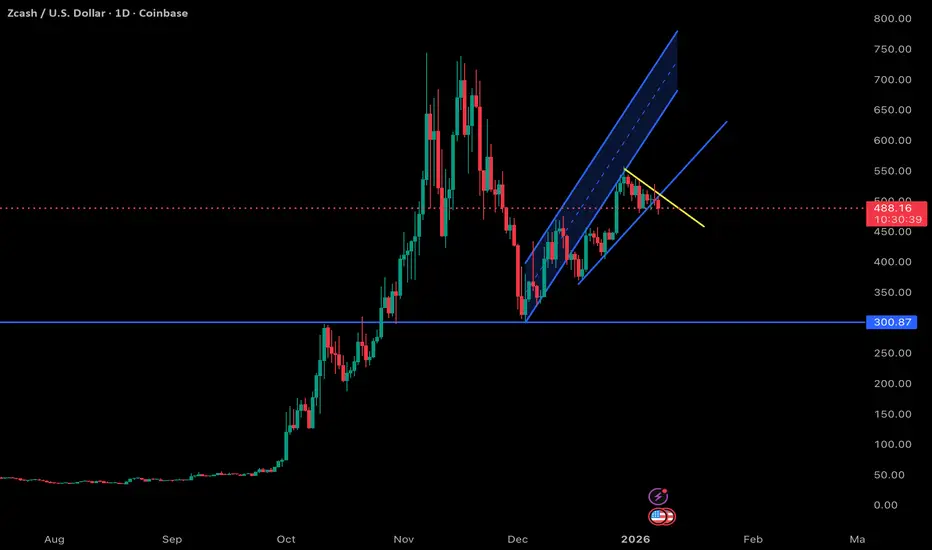
ZEC / USD – Daily – Structural Update (Bullish going into 2026)ZEC remains in a higher timeframe uptrend despite the recent pullback. The move lower from the recent highs is corrective in nature and fits within a rising channel structure that developed after the strong bounce from the $300 region. No daily lower low has formed, keeping the broader bullish structure intact.
The $300–310 zone remains the most important level on the chart. This area marks the macro breakout base and prior demand. As long as daily closes hold above this level, the bullish thesis remains valid and the trend favors continuation into 2026 rather than a full reversal.
Price is currently consolidating between roughly $450 and $550. This zone is acting as a compression area following the last impulse leg. Dips into the $420–450 region have been bought and continue to form higher lows, suggesting accumulation rather than distribution.
A sustained reclaim and hold above the $520–550 range would signal trend continuation and open the door for a move toward $600, followed by $680 and potentially the upper channel region near $750–800 over time.
Volume behavior supports this view, with expansion on upside moves and contraction on pullbacks. Momentum has cooled but remains constructive, resetting conditions for another expansion leg rather than signaling exhaustion.
The primary risk to this view is a daily close below $300, which would break the macro structure and invalidate the bullish continuation scenario. Until that occurs, this remains a buy-the-dip environment, favoring patience and entries on controlled pullbacks rather than chasing strength.
Overall bias remains bullish, with ZEC consolidating above its breakout base and positioning for potential continuation into 2026.

Key Breakout Setup: #ZEC Eyes $475-$530 RallyIn this technical analysis, I break down the current price action using a multi-timeframe approach. Starting with the 4-hour chart, I then zoom out to capture the broader market structure and identify how price recently broke above local highs before pulling back to retest that level as new support—a classic bullish confirmation pattern.
Zooming back in, I outline the critical $400 level that's keeping the near-term outlook bullish. As long as price holds above this support, we're positioned for a potential breakout toward the $475 target area, which could then open the door to the $530s.
I also cover downside risk management, including the key levels to watch that would signal weakness and potentially trigger a move to new lows. Whether you're looking for entry opportunities or managing existing positions, this video provides the technical levels you need to navigate the current setup.
