Zcash ZEC price analysisCRYPTOCAP:ZEC holders, it’s time to be extra careful.
Over the past few months, #Zcash showed solid strength.
Over the last weeks — the price was clearly being “held” around key levels.
But now OKX:ZECUSDT is entering a truly critical zone.
⚠️ Key levels to watch:
$300–310 — a crucial support area. Holding above it keeps the medium-term structure alive.
A daily close below $300 may open the door to $190–200 — and that’s still a relatively optimistic downside scenario.
From a pure technical perspective, the global trendline sits much lower, around $100–110, and by TA rules it may eventually be tested.
CRYPTOCAP:ZEC is currently at a crossroads:
either buyers defend the structure,
or the market transitions into a deeper redistribution phase.
👉 What’s your take: will $300 hold, or is CRYPTOCAP:ZEC heading for a much deeper correction?
______________
◆ Follow us ❤️ for daily crypto insights & updates!
🚀 Don’t miss out on important market moves
🧠 DYOR | This is not financial advice, just thinking out loud
Zecash

ZEC — Daily & 4H Bias (Long & Short Scenarios)Price broke out of the prior consolidation around 449.46, where buyers stepped in on the 4H timeframe. This was confirmed by a bullish engulfing move, followed by a brief pause near 472.13.
However, the bullish momentum weakened as price entered a higher-timeframe supply zone (513.70 – 554.93) — a previous sell-off area. Although price swept above this zone, it failed to sustain acceptance and began to reverse
From there:
Market broke initial structure
Printed a lower low, followed by a reaction from buyers
Price pushed up to 536.37, but momentum was insufficient to break the prior high
This formed the first lower high
A subsequent sell-off broke the previous low, creating a new low at 480.32
Another push up failed again, forming a second lower high
With two confirmed lower highs and lower lows, market structure currently favors continuation to the downside.
Trade Scenario's
Short bias:
Shorting at market offers poor R:R.
A more favorable setup would be a limit short around 523.59, within the supply zone.
Long bias:
Alternatively, price may retrace into daily demand (435.71 – 449.46), where a long setup could form if buyers step in.
Both scenarios are marked on the chart — patience and confirmation are key.
Appreciate everyone’s input. If you have a different bias, feel free to share.
Follow my journey on X: @CTucker99670
I’ll be actively posting my market bias and learning progress.
Happy trading 📊

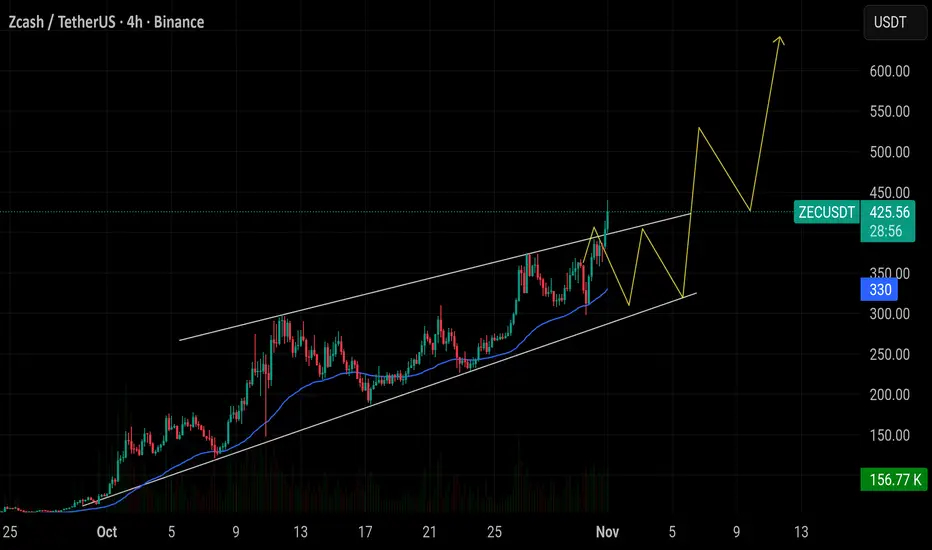
ZEC/USDT – Head & Shoulders Pullback within Rising ChannelHi!
Pattern: Head & Shoulders (short-term correction)
Trend: Overall bullish (ascending channel intact)
➡️ After forming a Head & Shoulders near the top of the channel, price saw a healthy pullback
➡️ Price is now approaching the lower boundary of the rising channel, which acts as strong dynamic support
➡️ As long as this support holds, the broader uptrend remains valid
🎯 Bullish Targets:
TP1: 520
TP2: 550
A deeper correction is possible, but buyers are expected to step in near channel support

#ZEC/USDT – Potential Long Setup at Key Fibonacci Level#ZEC
The price is moving in a descending channel on the 1-hour timeframe. It has reached the lower boundary and is heading towards breaking above it, with a retest of the upper boundary expected.
We have a downtrend on the RSI indicator, which has reached near the lower boundary, and an upward rebound is expected.
There is a key support zone in green at 296. The price has bounced from this zone multiple times and is expected to bounce again.
We have a trend towards stability above the 100-period moving average, as we are moving close to it, which supports the upward move.
Entry price: 334
First target: 352
Second target: 386
Third target: 430
Don't forget a simple principle: money management.
Place your stop-loss below the support zone in green.
For any questions, please leave a comment.
Thank you.

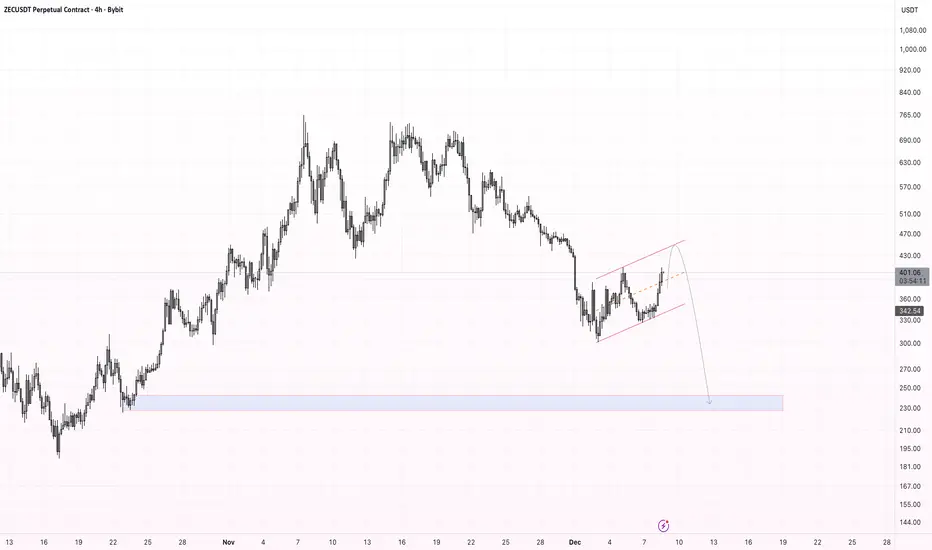
ZEC - forming a clear bearish flag on the 4H timeframe.After a strong impulsive sell-off, the price is consolidating inside an ascending channel, which typically acts as a continuation pattern in a downtrend.
There is still a chance that the market may retest the upper boundary of the flag, but as long as the structure remains intact, the bearish scenario is more likely to play out.
My main target for the next leg down is the $ 240–$230 demand zone, where previous liquidity and support levels are located.
Summary:
Structure: Bearish flag (continuation pattern)
Possible move: Retest of upper channel resistance before reversal
Bearish target: $240–$230
If the flag breaks downward with momentum, continuation of the larger downtrend becomes highly probable.
ZEC proves that old-school crypto still got the fire!The price of CRYPTOCAP:ZEC finally broke out from a long consolidation (unlike poor #DASH 😅).
💰 Market cap already exceeded $6B, even slightly surpassing CRYPTOCAP:XMR (Monero).
🪙 True old-school vibes:
Total supply is limited to 21M coins — just like CRYPTOCAP:BTC . No trillions, no inflationary nonsense 😎
📊 On the #ZECUSDT chart, we see an almost correction-free rally — brief pauses between levels and then another leg up.
In fact, CRYPTOCAP:ZEC just broke above its 2021 high, and we don’t really see any major profit-taking yet.
🧩 P.S. The technical levels work beautifully — use them wisely 😉
⚖️ But the real question is:
is this genuine demand for anonymity, or is someone carefully pumping CRYPTOCAP:ZEC after years of mining accumulation?
______________
◆ Follow us ❤️ for daily crypto insights & updates!
🚀 Don’t miss out on important market moves
🧠 DYOR | This is not financial advice, just thinking out loud.

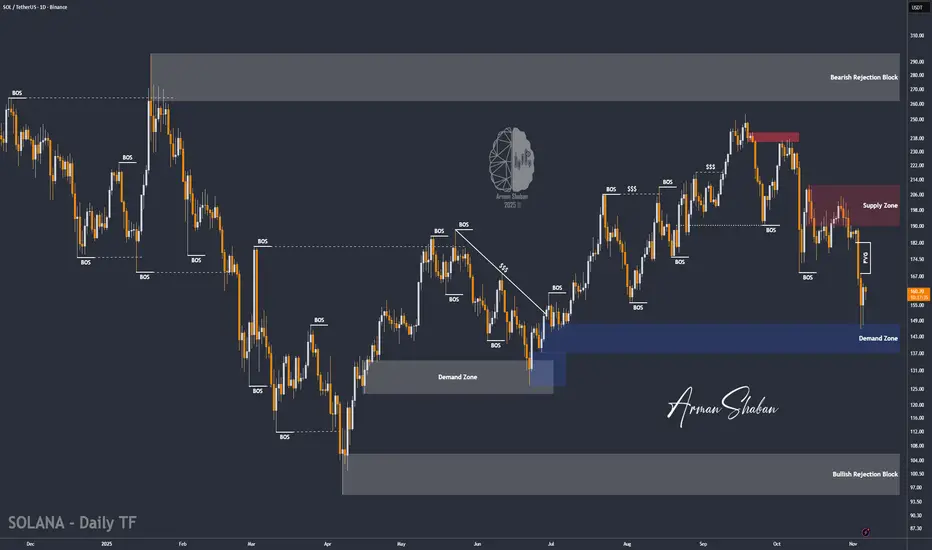
SOL/USDT | Solana Rebounds From $146 – Bulls Back in Control!By analyzing the #Solana chart on the daily timeframe, we can see that after correcting to $146, the price found strong demand and is now trading around $160.
If Solana manages to hold above the key demand zone of $137–$147, we can expect further upside movement. The medium-term targets are $168, $182, and $196. This analysis will be updated soon.
Please support me with your likes and comments to motivate me to share more analysis with you and share your opinion about the possible trend of this chart with me !
Best Regards , Arman Shaban
ZKUSDT - Don't waste this opportunity!Did you know that ZK dropped more than 98.5% from its peak in December 2024 until October 10, 2025?
If you can’t imagine what that means, let me explain:
Coins that experience such a massive drop usually get delisted and die off—they rarely recover.
But ZK surged over 1,300% from its October 10 bottom in less than 23 days and is now about to break a major resistance at the 0.618 Fibonacci level.
And I want to point out something:
ZEC and ZK sound similar, and even their letters resemble each other—definitely a hint at the market makers’ codes.
Best Regards:
Ceciliones🎯

$ZEC/USDT successfully retested the $308 zone at the 50 EMA. $ZEC/USDT successfully retested the $308 zone at the 50 EMA and bounced strongly upward. The breakout above $400 confirms a clear bullish continuation pattern. With the retest already completed, momentum now favors further upside. As long as the price holds above $400, ZEC remains in a strong uptrend. The next target zone is between $500 and $600.
ZECUSDTMy idea is bullish for BINANCE:ZECUSDT .
But keep 220$ support.
Next target is 290 - 370
Support: 220 - 1755 - 125 - 78
⚠️Please control risk management.

ZECUSDT - another leg up ahead!Keep your eyes on it — just like I told you before. Its target was $250–$280, and it actually hit $298 exactly. It then entered a temporary corrective phase, forming a falling wedge pattern.
This coin is an ideal pick for the current phase, and don’t worry — its bullish run isn’t over yet.
Next target: $360. I’ll keep posting updates about it regularly.
Best regards:
Ceciliones🎯

ZEC breakout of multi years resistance !ZEC / USDT
We noticed a Strong move this week
Price broke multi-years resistance line (2024/2022/2020) which is a huge breakout for this coin !
Simple thing , Holding above line = bullish
Invalidation: candle close below it

#ZECUSDT - Another leg up is aheadWe all saw a massive bullish in zec in previous days out of 260% instant bullish... and now it's in consolidation
it shows a symmetrical triangle pattern in hourly chart with 2 attempts of breakout ... third one must be work
the next station at ( 250 - 280$)
best Regards:
Ceciliones🎯

#ZEC/USDT Breakout Confirmed - Bullish Rally Loading!#ZEC
The price is moving within a descending channel on the 1-hour frame, adhering well to it, and is heading for a strong breakout and retest.
We have a bearish trend on the RSI indicator that is about to be broken and retested, which supports the upward breakout.
There is a major support area in green at 48.26, representing a strong support point.
For inquiries, please leave a comment.
We are in a consolidation trend above the 100 Moving Average.
Entry price: 52.70
First target: 53.70
Second target: 54.90
Third target: 56.85
Don't forget a simple matter: capital management.
When you reach the first target, save some money and then change your stop-loss order to an entry order.
For inquiries, please leave a comment.
Thank you.

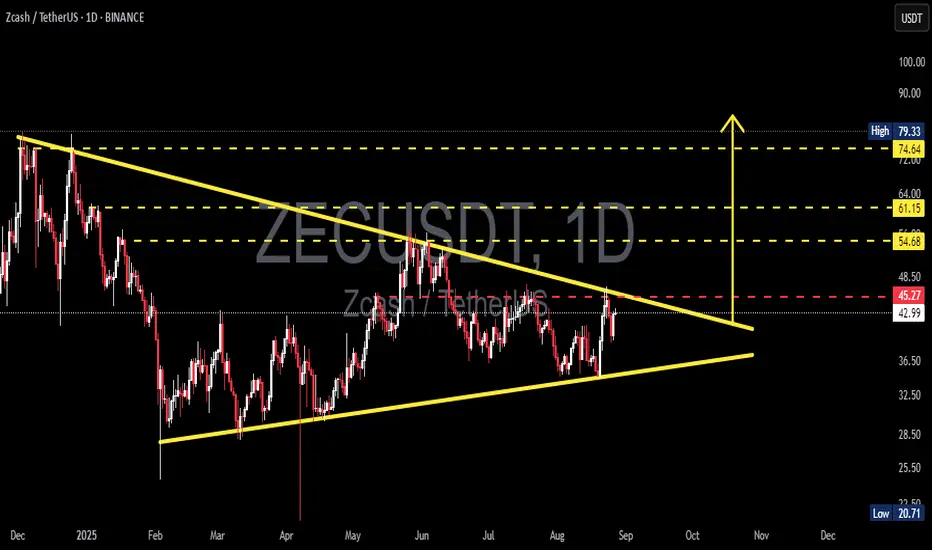
ZEC/USDT — Symmetrical Triangle: A Big Breakout?🔎 Pattern Analysis
On the daily chart, ZEC/USDT is forming a symmetrical triangle. This structure is characterized by:
Lower Highs → sellers continue to defend lower levels (descending resistance).
Higher Lows → buyers step in earlier each time (ascending support).
Both lines are converging, compressing volatility, and signaling that a major move is imminent. The apex of this triangle is projected around late September to early October 2025, meaning a breakout (up or down) is likely to occur before then.
---
📈 Bullish Scenario (Upside Breakout)
If ZEC manages to break and close above 45–48 (red dashed line + descending resistance), especially with rising volume, it would confirm a bullish breakout.
➡️ Potential upside targets:
🎯 Target 1: 54.68 (+27%)
🎯 Target 2: 61.15 (+42%)
🎯 Target 3: 74.64 (+73%)
Such a breakout often sparks sustained rallies, especially if the broader crypto market sentiment aligns.
---
📉 Bearish Scenario (Downside Breakdown)
If ZEC fails to break resistance and instead closes below ~36.50 (ascending support), downside momentum could accelerate.
➡️ Potential downside targets:
🎯 Target 1: 36.50 (first support, −15%)
🎯 Target 2: 32.50 (major support, −24%)
🎯 Target 3: 20.71 (historical low, −52%)
This would indicate weakness and could open the door for deeper declines toward multi-month lows.
---
⚖️ Key Takeaways
The symmetrical triangle is a neutral but powerful pattern → direction will depend on the breakout.
Always wait for confirmation (daily close + volume spike) before committing.
Beware of false breakouts — a retest of the breakout zone is often a safer entry.
Risk management is crucial: protect capital with stop-loss and proper position sizing.
👉 In short: ZEC is approaching a make-or-break moment. Breakout to the upside could fuel a strong rally, while a breakdown could trigger heavy selling pressure.
#ZECUSDT #Zcash #CryptoAnalysis #Breakout #SymmetricalTriangle #Altcoins #TechnicalAnalysis #PriceAction
#ZEC/USDT#ZEC
The price is moving in a descending channel on the 1-hour frame and is expected to continue upward.
We have a trend to stabilize above the 100 moving average once again.
We have a downtrend on the RSI indicator that supports the upward move with a breakout.
We have a support area at the lower boundary of the channel at 37.40.
Entry price: 37.90
First target: 38.82
Second target: 40
Third target: 41

Trading opportunity for ZECUSDTBased on technical factors there is a Buy position in :
📊 ZECUSDT
🔵 Buy Now
🪫Stop loss 57.20
🔋Target 63.00
📏 R/R 2
💸RISK : 1%
We hope it is profitable for you ❤️
Please support our activity with your likes👍 and comments📝

ZECUSDT Hits All Targets – 940% Profit Secured at 10x!ZECUSDT on the 1-Day timeframe delivered an outstanding long trade setup, smashing all profit targets and securing a remarkable 940% profit at 10x leverage.
Key Levels:
TP1: 41.78 ✅
TP2: 52.53 ✅
TP3: 63.28 ✅
TP4: 69.93 ✅
Technical Analysis:
The trade was perfectly executed using the Risological Swing Trading Indicator , which provided a clean entry at 35.14 with an SL at 29.77. ZECUSDT displayed strong upward momentum, supported by a clear price crossover above the Risological Trend Line, leading to a sustained uptrend. All targets were hit with precision, delivering massive gains.

ZEC moment to shineKeep it simple! According to the chart, my estimate is to hit the zone in early Feb 2024
Estimate rebound 6x from here > $120 zone
My average entry is $19.7
I think this is the bottom for it in this cycle, next is rebound then the correction zone then bull run.
Disclaimer: I could be wrong, don't invest what you can't handle to lose. Manage your risks.

ZEC, shifting after 2.5 years! massive price growth ahead!After peaking at a parabolic price of 300, ZECASH has been on a weighty downtrend for eons -- trimming down it's valuation every single month and coming back to ground to almost 10x from its peak.
Now, based on recent long term data metrics, ZEC is finally shifting massively after 2.5 years! That's a long wait! This shift is massive -- it's happening for a good reason.
As seen on diagram, we are seeing a bear clearance based on long term metrics. Bear dissolvement has been spotted this month, August -- for the first time in ages.
Net buying activity has surge exponentially from the current range signifying renewed interest, and buyers positioning on the enormous growth prospect of the coin.
The RR ratio of ZEC is too attractive to be missed at 8-10x.
The current bargain range is an ideal seeding area.
One of the few coins which boast a juicy RR from this corrective season.
Spotted at 40.0
Interim target at 120.0
Long term at 300.
TAYOR.

ZECASH long setup / 1:1 SettingBINANCE:ZECUSDT
COINBASE:ZECUSD
Hello Traders
💥Long position on ZECASH
SL1 ---> Low-risk status: 3x-4x Leverage
SL2 ---> Mid-risk status: 5x-8x Leverage
👾The setup is active but expect the uncertain phase as well.
➡️Entry Area:
Yellow zone
⚡️TP:
32.35
🔴SL:
30.32
32.75
33.45
🧐The Alternate scenario:
If the price stabilizes below the trigger zone, the setup will be cancelled.

ZEC LONG PlanZEC HTF Analysis
Swing Long Trade, Spot Buy
Weekly Liquidity Sweep: External - Bottom
Daily Swing High Liquidity Sweep: Internal - Top
We can take a long entry on retracement in the Displacement + Discount zone (fib OTE level). For reference, entry, SL, DCA, and TP levels are marked on the chart.
#DoYourOwnResearch

#ZEC/USDT#ZEC
The price is moving in a downward channel trend on a 4-hour frame and is sticking to it well
After bouncing from a major support area in green at the level of 18.00, which is a very strong area
We have a tendency to stabilize above the Moving Average 100
We have a downtrend on the RSI that is about to break higher
Entry price is 18.20
First goal: 21.93
Second goal: 25.52
Third goal 29.12
