ZEC — Daily & 4H Bias (Long & Short Scenarios)Price broke out of the prior consolidation around 449.46, where buyers stepped in on the 4H timeframe. This was confirmed by a bullish engulfing move, followed by a brief pause near 472.13.
However, the bullish momentum weakened as price entered a higher-timeframe supply zone (513.70 – 554.93) — a previous sell-off area. Although price swept above this zone, it failed to sustain acceptance and began to reverse
From there:
Market broke initial structure
Printed a lower low, followed by a reaction from buyers
Price pushed up to 536.37, but momentum was insufficient to break the prior high
This formed the first lower high
A subsequent sell-off broke the previous low, creating a new low at 480.32
Another push up failed again, forming a second lower high
With two confirmed lower highs and lower lows, market structure currently favors continuation to the downside.
Trade Scenario's
Short bias:
Shorting at market offers poor R:R.
A more favorable setup would be a limit short around 523.59, within the supply zone.
Long bias:
Alternatively, price may retrace into daily demand (435.71 – 449.46), where a long setup could form if buyers step in.
Both scenarios are marked on the chart — patience and confirmation are key.
Appreciate everyone’s input. If you have a different bias, feel free to share.
Follow my journey on X: @CTucker99670
I’ll be actively posting my market bias and learning progress.
Happy trading 📊
Zeclong

#ZEC/USDT – Potential Long Setup at Key Fibonacci Level#ZEC
The price is moving in a descending channel on the 1-hour timeframe. It has reached the lower boundary and is heading towards breaking above it, with a retest of the upper boundary expected.
We have a downtrend on the RSI indicator, which has reached near the lower boundary, and an upward rebound is expected.
There is a key support zone in green at 296. The price has bounced from this zone multiple times and is expected to bounce again.
We have a trend towards stability above the 100-period moving average, as we are moving close to it, which supports the upward move.
Entry price: 334
First target: 352
Second target: 386
Third target: 430
Don't forget a simple principle: money management.
Place your stop-loss below the support zone in green.
For any questions, please leave a comment.
Thank you.

ZEC: Downside Scenario Still in PlayHi, friends! 👋
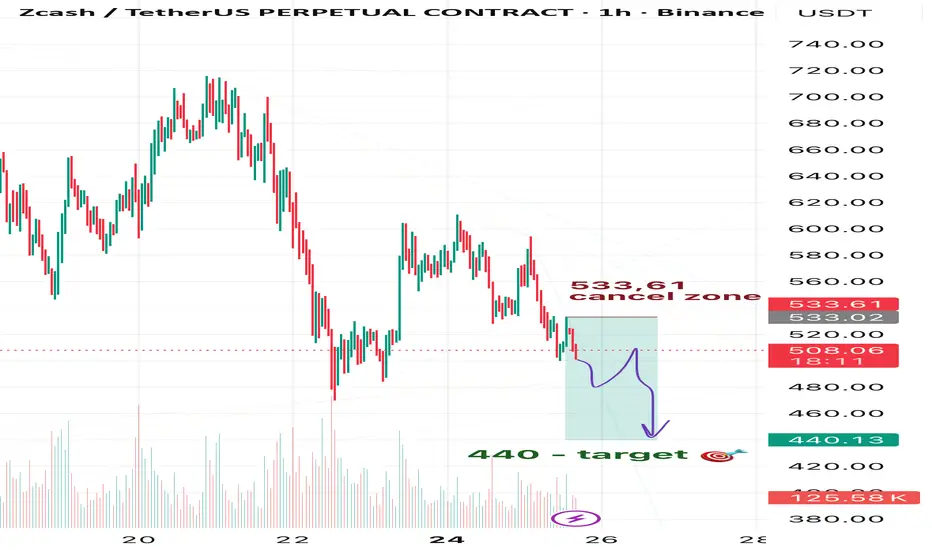
Yesterday, ZEC broke through my scenario invalidation zone. Earlier, I shared an idea expecting ZEC to move toward 480 and lower. Despite this breakout, the broader bearish setup is not invalidated — in fact, ZEC has only confirmed its intention to continue downward 📉
My targets:
🎯 Target 1: 480
🎯 Target 2: 460
🎯 Target 3: 440
❌ Plan invalidation zone: 533.61
#ZECUSDT Privacy Narrative 2025-2026!ZEC is a privacy coin, and before we jump into numbers, you should ask yourself:
Why are privacy coins leading this cycle?
If you haven’t asked this yet, then it’s time to dive deeper —
because the narrative itself is part of the pump.
🔥 Main Question
Will ZEC hold momentum and continue bullish,
Or will $800 be the end of this wave?
Short Answer:
I see ZEC reaching $1,500 before or by Feb 2025.
We already caught it in the $4XX range days ago after making this TA:
🧭 Technical Foundation
This ZEC read is based on:
Elliott Wave (EW)
Gann Timing
Fibonacci Map
Harmonic structure confirmations
ZEC is currently at a crossroads, and the next monthly close will decide its fate.
🔑 What ZEC Needs for $1,500
1. Weekly Hold for now to keep things up:
$480 must hold weekly
No monthly close below this range
2. Bullish Monthly Close:
$560–$630 monthly close → excellent strength
Confirms buyers defending the trend
3. Breakout Key:
$800 → breakout
Opens runway to $1,200 → $1,500
New ATH window
Monthly close = the key factor for ZEC’s entire roadmap.
💼 Trade Plan (My Setup)
My Buy Levels:
$359.25
$419.13
$479.00 → now in profit
Stop-Loss:
$250
A monthly close below $ 230 invalidates the structure.
Risk Allocation:
3–5% max investment
Even with a 2× target, the risk remains controlled
→ You risk $1 to aim for $2+
Duration:
180+ days
Confidence Level: Medium
📌 Quick Recap
Key support: $480 weekly
Monthly range to watch: $560–$630
Breakout: $800 → $1,200 → $1,500
❌ Invalidation: Monthly below $260
🧩 Risk: 3–5%
⏱ Duration: 6 months+
⚓ Renzo Tip
“Privacy coins rise when the crowd starts whispering, smart captains listen before the storm arrives.”
Do your own research, as always.
Prayer
May Allah protect our trades from hidden risks, guide us toward clarity,
and give us wisdom to manage both fear and greed in every cycle.

ZEC Weekly Outlook: Crucial Zones & Scenario BreakdownHi, friends! 👋
A brand new trading week has just begun — wishing all of you a profitable one! 💸
I’ll do my best to contribute with timely analysis and updates.
Today we’re taking a look at ZEC .
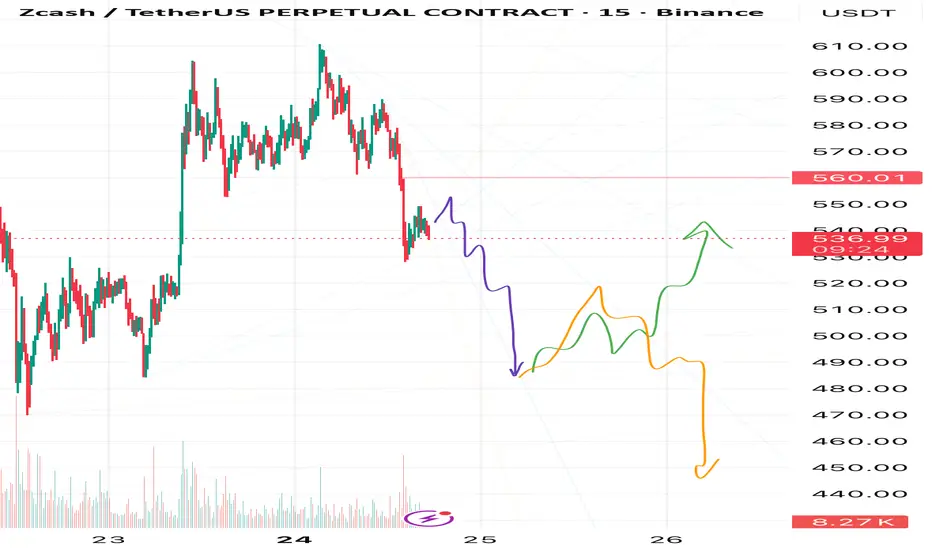
In my view, after reaching the 550–555 zone, we may see ZEC drop toward 480 .
From there, I’m considering two potential scenarios — the green and the orange arrows.
I’m personally leaning toward the orange path 🟧, but I can’t be fully confident until we see how the initial purple move plays out.
❌Also — the cancel zone for the purple scenario is at 560 . If price breaks above that level, the purple scenario becomes invalid .
As the purple scenario begins to unfold, I’ll be posting updates so you don’t miss any shifts 📈
What do you think?
Will ZEC follow the orange arrow or the green one?
And do you think ZEC will complete the initial purple move at all?
Share your thoughts in the comments — I’m genuinely interested in your view! 💬
👉 Make sure to follow and hit “Like” so you don’t miss upcoming updates!
⚠️ Disclaimer: This is not financial advice and not a call to action. This is only my personal market view. Please make decisions according to your own trading system.
ZECUSDTMy idea is bullish for BINANCE:ZECUSDT .
But keep 220$ support.
Next target is 290 - 370
Support: 220 - 1755 - 125 - 78
⚠️Please control risk management.

ZEC: Bullish Breakout with $57 and $61 Targets AheadHello guys!
ZEC is showing some interesting technical setups right now:
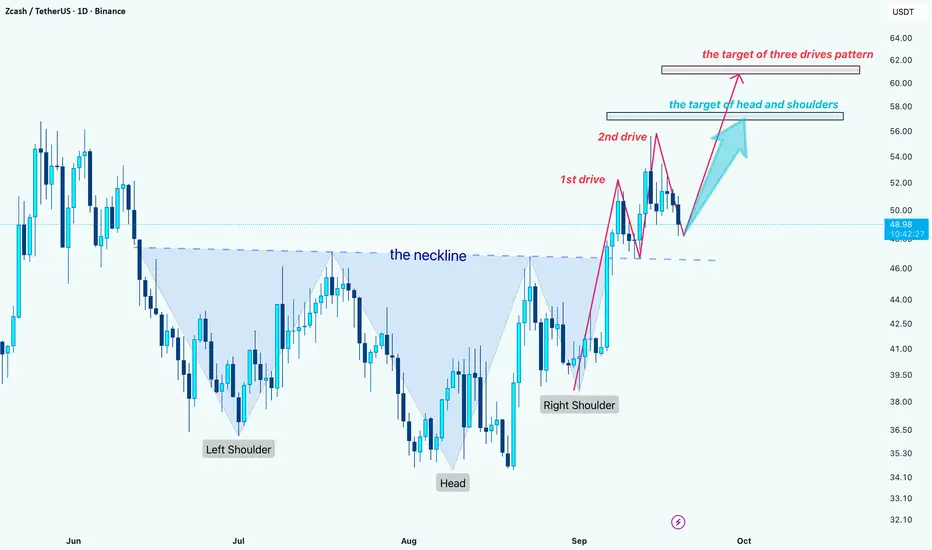
First, the chart has completed a Head & Shoulders reversal and successfully broken above the neckline. Based on this structure, the next potential upside target sits around $57.
On a lower level, the price is also shaping a Three Drives pattern. If this plays out, the extension could take ZEC higher toward the $61 zone.
Overall, the technical picture looks bullish as long as the price holds above the neckline. A breakout confirmation with momentum could push ZEC step by step toward those targets.
#ZEC/USDT Breakout Confirmed - Bullish Rally Loading!#ZEC
The price is moving within a descending channel on the 1-hour frame, adhering well to it, and is heading for a strong breakout and retest.
We have a bearish trend on the RSI indicator that is about to be broken and retested, which supports the upward breakout.
There is a major support area in green at 48.26, representing a strong support point.
For inquiries, please leave a comment.
We are in a consolidation trend above the 100 Moving Average.
Entry price: 52.70
First target: 53.70
Second target: 54.90
Third target: 56.85
Don't forget a simple matter: capital management.
When you reach the first target, save some money and then change your stop-loss order to an entry order.
For inquiries, please leave a comment.
Thank you.

ZECUSDT UPDATE#ZEC
UPDATE
ZEC Technical Setup
Pattern : Bullish Wave pattern
Current Price: $43.49
Target Price: $69.50
Target % Gain: 61%
Technical Analysis: ZEC has broken out of the falling wedge on the 1D chart with strong bullish momentum. The breakout candle closed above trendline resistance, confirming upside potential. If price sustains above $43, continuation toward $69 is likely.
Time Frame: 1D
Risk Management Tip: Always use proper risk management.

ZEC Technical Outlook – Can It Reach $80?ZEC Technical Outlook – Can It Reach $80?
Can ZEC reach the $80 level, implying a +60% potential gain? It’s possible — but there are key resistance and support levels to watch closely.
The first major resistance lies around $55, which might be tested soon. However, there is also a possibility of a fake breakout above this level, followed by a short-term correction.
In such a case, price could pull back toward the $40 support zone, which may act as a stronger base for a more sustainable move to the upside.
📈 For now, the trend remains bullish, but price action around $55 will be critical in shaping the next move.
📌 This analysis is for educational and informational purposes only and does not constitute financial advice.
📝 Follow for more updates on ZEC and other crypto assets.

#ZEC/USDT#ZEC
The price is moving in a descending channel on the 1-hour frame and is expected to continue upward.
We have a trend to stabilize above the 100 moving average once again.
We have a downtrend on the RSI indicator that supports the upward move with a breakout.
We have a support area at the lower boundary of the channel at 37.40.
Entry price: 37.90
First target: 38.82
Second target: 40
Third target: 41

$ZECUSDT : Privacy Coin Ready to Rally?BINANCE:ZECUSDT , a leading privacy-focused cryptocurrency, has demonstrated a strong rebound following a recent market downturn. This resilience has captured the attention of the crypto community, sparking renewed interest in the coin. Technically, BYBIT:ZECUSDT.P has exhibited a pattern of overcoming resistance levels, forming higher highs, and suggesting a bullish trajectory. The current resistance at $80 is a critical hurdle. A successful breach of this level could potentially unleash significant upward momentum. Traders are advised to exercise prudent risk management practices, including setting stop-loss orders, to mitigate potential losses.
COINBASE:ZECUSD Currently trading at $53
Buy level: Above $44
Stop loss: Below $34
Target : $200
Max Leverage 3x
Always keep Stop loss
Follow Our Tradingview Account for More Technical Analysis Updates, | Like, Share and Comment Your thoughts

ZECUSDT Hits All Targets – 940% Profit Secured at 10x!ZECUSDT on the 1-Day timeframe delivered an outstanding long trade setup, smashing all profit targets and securing a remarkable 940% profit at 10x leverage.
Key Levels:
TP1: 41.78 ✅
TP2: 52.53 ✅
TP3: 63.28 ✅
TP4: 69.93 ✅
Technical Analysis:
The trade was perfectly executed using the Risological Swing Trading Indicator , which provided a clean entry at 35.14 with an SL at 29.77. ZECUSDT displayed strong upward momentum, supported by a clear price crossover above the Risological Trend Line, leading to a sustained uptrend. All targets were hit with precision, delivering massive gains.

#ZEC/USDT#ZEC
The price is moving in a descending channel on a 3-day frame and is sticking to it well
We have a bounce from the lower limit of the descending channel and we are now touching this support at a price of 24
We have a downtrend on the RSI indicator that is about to be broken, which supports the rise
We have a trend to stabilize above the moving average 100
Entry price 31
First target 43
Second target 56
Third target 73

#ZEC/USDT#ZEC
The price is moving in a downward channel trend on a 4-hour frame and is sticking to it well
After bouncing from a major support area in green at the level of 18.00, which is a very strong area
We have a tendency to stabilize above the Moving Average 100
We have a downtrend on the RSI that is about to break higher
Entry price is 18.20
First goal: 21.93
Second goal: 25.52
Third goal 29.12

Zcash ; attractive R:RHappy halving mates ! Here we have zcash , one of the coins in absolute bottom, dont tell me its dead or it wanted cause crypto world is a crazy environment, im adding this beauty to my portfolio here at 22 $ , main reason is its cheap and also positive weekly divergence, second is its bloody halving today , and third its in super support and I definitely believe that any breakdown would be fake and to be gathered in monthly candle so its a definite buying chance with zcash , see you around 200$
Not financial advice, DYOR , happy halving lads .

#ZEC/USDT LONG#ZEC
The price has been moving in a bear flag since July 2022
and we are about to break that pattern by breaking the downtrend
Supported by oversold on MACD
Current price 31.24
First goal 42.94
Second goal 53.25
Which represents 180% of the current price
This rise is supported by the break of moving average 100, and you must pay attention to the correction points on the chart

Zcash longZcash bounced off the ascending trendline and bounced off the support level. Bullish movement to resistance level at 43.3 is expected to happen.

#ZECBTC - Swinging to Top of Channel RangetheCrypster -
As you can see #ZCASH has ben ranging this channel against #bitcoin for a little while now, with clear swings from top resistance to lower support. After a quick retest of the lower edge we're moving on up once again!
The mid-line within this channel has played a pivotal role previously, providing a level of both support and resistance numerous times; but with the fresh rejection, the price breaking above a significant historical low and a good Buy signal from Crypto Tipster v2, we can see this heading on up!
If you enjoyed or agree with this idea - drop us a comment, like & follow! :)
ZLong

$ZEC #ZEC | LTF LONGGreen box and EQ might be worked as a support level .
The bottom of the green box, liquidity zone and around 41.52 will be the points I will observe as resistance.
With the loss of 39 (1H) , the first bounce of the price will be around 38 .
I wish everyone a good year.

ZECUSDT - Falling Wedge PatternZECUSDT (4h Chart) Technical analysis
ZECUSDT (4h Chart) Currently trading at $38.7
Buy level: Above $38.5
Stop loss: Below $36
TP1: $40
TP2: $43
TP3: $48
Max Leverage 3x
Always keep Stop loss
Follow Our Tradingview Account for More Technical Analysis Updates, | Like, Share and Comment Your thoughts

ZEC Pump Are You Rdy ?The analysis we have done for you is in all time frames. To enter in the one-hour time frame, our signal type is buy. I, Manouchehr Azar, have determined the entry points for you and also the targets that the desired currency will see. You can make profit. My suggestion for dear friends of Lorj is up to 5x. Be successful and victorious

🟢 ZECUSDT - 3D (07.10.2022)🟢 ZECUSDT
TF: 3D
Side: Long
SL: $49.96
TP 1: $59.13
TP 2: $63.63
TP 3: $67.28
Buy ZECUSDT now and DCA over the next few weeks or buy when it enters the red area.
The 1W support should break it out of the falling wedge.
ZLong
