ZECUSD

ZEC - Time to lay a bit (part.3)Our little pause from our previous zec shorts went well, its now almost back at our entry price !
4h showing a fake out with high volume and a break of a lower trendline
> thats my short signals
(sorry volume not showed here but be sure im using it)
I will TP on all the fibs retracement (same not showed on chart) and refill on shorts if I see bearish continuation !
Im playing very safe here as i expect BTC to go higher than 94 at some point
I will react on whats happening later !
Will let you know all by updating this idea
SL around 600
Cheers

ZEC 1W update: approaching the $300 inflectionZcash is now rotating back toward the $300 level, and this is a very important area from a higher-timeframe perspective.
Context first:
ZEC went from a long period of compression into a vertical expansion, followed by a sharp rejection and distribution. What we’re seeing now is not random downside – it’s a mean reversion back toward the first major support formed after the breakout.
Why $300 matters:
• It’s the prior breakout / acceptance zone
• It acted as support on the first pullback
• It’s where buyers previously stepped in aggressively
• Losing it would signal failed acceptance; holding it keeps structure intact
As price approaches this level again, there are two clean scenarios:
Bullish / constructive
If ZEC holds ~$300 with weekly closes and reduced sell pressure, this becomes a higher-timeframe higher low. That would favor:
• Base building
• Volatility compression
• Potential re-expansion toward $380–450 later
Bearish / invalidation
If $300 loses with acceptance below, the move starts to look more like a blow-off top rather than a trend shift, opening the door to deeper mean reversion.
Right now, this is a decision zone, not a panic zone. Strong trends retest their breakout levels. Weak ones lose them. ZEC is approaching the line where that distinction gets made.
Patience here matters more than prediction.

ZEC/USDT - Bullish Pennant: Consolidation Before Next Breakout?ZEC/USDT on the Daily (1D) timeframe is currently in a healthy consolidation phase following a strong impulsive rally from lower levels toward the 758 USDT high. This price behavior reflects strong prior buyer dominance, followed by a cooling phase before a potential trend continuation.
---
Pattern Explanation – Bullish Pennant
The price structure clearly forms a Bullish Pennant, characterized by:
A strong flagpole created by an aggressive bullish impulse move.
A tight symmetrical consolidation with:
Lower highs
Higher lows
Decreasing volume during consolidation, which is typical for a pennant pattern.
This pattern is a bullish continuation structure, not a reversal pattern.
---
Key Levels
Key Resistance Levels:
448 USDT (minor resistance / mid-pennant area)
539 USDT (major breakout confirmation level)
697 – 758 USDT (major resistance & previous high)
Key Support Levels:
Bullish pennant lower trendline
360 USDT (structural support)
300 USDT (strong psychological support)
---
Bullish Scenario (Primary Bias)
Price holds above the lower pennant trendline.
A valid breakout above the upper pennant trendline with a strong daily close.
Additional confirmation if price breaks and holds above 539 USDT.
Bullish continuation targets:
697 USDT
Retest of 758 USDT
Further upside extension if momentum remains strong, based on the flagpole measured move.
---
Bearish Scenario (Invalidation)
Price fails to hold the lower pennant trendline.
A strong daily close below the structure confirms a failed bullish pennant.
Downside targets:
360 USDT
300 USDT
This bearish scenario represents pattern invalidation, not the primary bias.
---
Conclusion
ZEC/USDT remains in a bullish continuation phase as long as price respects the pennant structure. The market is currently at a decision zone, and a confirmed breakout could trigger the next impulsive move to the upside. Traders should wait for clear breakout confirmation before taking aggressive positions.
#ZEC #ZECUSDT #BullishPennant #CryptoAnalysis #TechnicalAnalysis #Altcoins #BullishContinuation #PriceAction #MarketStructure

ZEC's Last Correction Before Moon Mission?We’re Watching
Yello Paradisers! Are you ready for the last piece of the puzzle before #ZEC makes its next massive move? We've been carefully tracking this setup, and it's reaching a critical inflection point—ignore it at your own risk.
💎#ZECUSDT is currently forming an ending diagonal pattern within the C wave of an ABC correction. This structure typically appears at the end of a larger corrective phase and often signals a major reversal or the beginning of a strong new trend. As it stands, wave 4 of this diagonal appears to be completed, and wave 5 is now in progress. This final leg of the pattern is what we’re watching closely.
💎What adds weight to our current thesis is the presence of a clear bearish divergence between wave 3 and wave 5 within the diagonal pattern. Divergence at this stage provides strong confluence that the move is likely nearing exhaustion. A confirmed break of the diagonal pattern would then offer a very attractive risk-reward trading opportunity for those ready to act decisively.
💎Wave C, if it isn’t truncated, should ideally complete below the low of wave 1. That’s why, at this stage, we are only observing, not entering. We want to see this structure fully play out before taking any action. The bottom of wave A serves as a key support zone, while the top of wave B is expected to provide minor resistance. These zones will be critical to monitor once price action starts reacting more aggressively.
💎If this analysis plays out as anticipated, we could be witnessing the final correction before #ZEC begins a new macro impulse — potentially pushing us to a new lifetime high. But again, patience and precision are essential here.
That is why we are playing it safe right now, Paradisers. If you want to be consistently profitable, you need to be extremely patient and always wait only for the best, highest probability trading opportunities.
MyCryptoParadise
iFeel the success🌴

ZEC has started a bearish wave (12H)From the point where we placed the red arrow on the chart, it appears that ZEC is forming an ABC correction or potentially a more complex corrective structure. Based on the current price action, wave B seems to have completed, and we are now in the early stages of a bearish wave C.
All the upward recovery we’ve seen over the past period, where price retraced and moved higher, appears to have been part of wave B. The recent drop confirms that wave C has officially started.
If price respects the red box area we’ve highlighted on the chart, there is potential for it to move towards the green box zone, which represents our target area. All target levels are clearly marked on the chart for reference.
It’s important to note that a daily candle close below the invalidation level would invalidate this analysis and suggest that the current wave count may need to be reassessed.
This setup is suitable for traders looking for short-term bearish opportunities while keeping proper risk management in place.
If you have a coin or altcoin you want analyzed, first hit the like button and then comment its name so I can review it for you.
This is not a trade setup, as it has no precise stop-loss, stop, or target. I do not publish my trade setups here.

$ZEC 1D Update: Into the chop here ZEC update.
ZEC is firmly in the doldrums right now. Price is all over the place with no clear directional control, and the chart is telling a story of chop rather than trend.
After the sharp breakdown and the fast bounce that followed, ZEC has failed to reclaim the prior uptrend structure and is now stuck rotating in the middle of the range. Rallies are getting sold, dips are getting bought, but neither side is showing conviction. That’s classic consolidation behavior after a high-volatility move.
The $400–430 area is acting as a noisy pivot zone where price keeps flipping back and forth. This is not a level to expect clean follow-through. Above here, there’s still heavy overhead supply from the prior breakdown. Below, buyers continue to defend in anticipation of another bounce, which is why price isn’t collapsing either.
The only higher timeframe level that really matters remains $300–310. As long as that zone holds, this chop can be interpreted as digestion rather than full trend failure. But until price either decisively reclaims the mid-$400s or flushes closer to $300, ZEC is likely to remain frustrating and directionless.
This is a low-quality environment for momentum trades. Patience is key here. ZEC tends to resolve these dull, messy ranges with expansion, but right now it’s firmly in chop mode, and the chart is reflecting that clearly.

$ZEC 1D Update: Catching a pump ZEC update.
ZEC is catching a strong bounce here after the recent flush, and the response off the lows is notable. Price has reclaimed the $400 area with an impulsive move, which suggests there was real demand waiting rather than just a weak oversold bounce.
This move comes after a sharp breakdown, so it’s important to keep context. Rallies following high-volatility selloffs are often fast and emotional, and they don’t automatically mean the trend has flipped back up. However, the fact that buyers stepped in aggressively before a full retest of $300 is constructive in the near term.
The $430–450 zone is now the key short-term area to watch. Holding above this region keeps the bounce alive and opens the door for a push back toward the $480–520 range, where prior support has likely turned into resistance. Acceptance above that would be needed to talk about a more meaningful trend repair.
On the downside, $300–310 remains the higher timeframe line in the sand. As long as that level holds, this still fits a volatile consolidation after a major advance rather than a full structural failure.
Overall, ZEC pumping here looks like a volatility-driven rebound inside a broader corrective phase. It’s constructive, but still needs follow-through and structure before it can be called “back on track.” Patience and level-to-level trading matter here more than chasing the candle.

ZCSH huge ZCASH moon begins 2024 ends Apr 2025This is not financial advice
$1.70 buying
$27.00 selling
20 month position duration
1,500% estimate return

DeGRAM | ZECUSD is preparing for a correction📊 Technical Analysis
● ZEC/USD rebounded from the long-term support line after completing a falling wedge, but the recovery stalled below a descending resistance, keeping the broader structure corrective. Recent price action forms a rising channel capped by a key resistance trendline, signaling weakening upside momentum.
● Repeated rejections near the upper boundary and a failed triangle breakout suggest distribution, with downside risk toward channel support if sellers regain control.
💡 Fundamental Analysis
● Privacy-focused altcoins like ZEC remain under pressure amid subdued risk appetite and lack of fresh sector-specific catalysts, while capital continues rotating toward higher-liquidity majors.
✨ Summary
● Medium-term bearish bias. Resistance: 550–570. Downside targets: 460–430, with invalidation above descending resistance.
-------------------
Share your opinion in the comments and support the idea with a like. Thanks for your support!

ZEC - 35% drop since previus idea. As i mentioned in a previus idea - big drop is coming!
at this moment price already dropped 35%
for new drop we need bigger range to take a trade
but drop below 100$ is likly to hppen

$ZEC 1D Update: Post-dev drama dump ZEC update.
Technically, this is a gnarly breakdown on the daily. Price has rejected the prior uptrend structure and is now putting in an impulsive leg lower, which usually means volatility is not finished yet. The bounce structure that was holding the higher lows has been lost, and we are back in “find the next real bid” mode rather than “trend continuation.”
Key levels I’m watching:
400 area (roughly where price is now) is a short-term pivot, but after this kind of sell candle it often acts as overhead supply on any bounce.
300–310 remains the major higher timeframe line in the sand. That level was the launchpad for the last expansion and the cleanest demand shelf on the chart. If we tag that zone, I’m watching for a reaction (slowing momentum, reclaim attempts, and better candle structure). If 300 loses on daily closes, the market likely needs more time to rebuild and the drawdown risk increases materially.
Fundamentals are messy right now and that matters for sentiment and liquidity. Multiple outlets are reporting that the entire Electric Coin Company team resigned / split following a governance dispute with Bootstrap (the nonprofit tied to ECC), and plans are being discussed around the team forming a new entity.
This doesn’t “kill” Zcash from a protocol standpoint (it’s open source and other contributors exist), but it does inject real uncertainty around coordination, roadmap execution, and optics, which can amplify volatility in the token.
DL News
How I’m treating it:
This is now a high-volatility, headline-sensitive environment. I’m not interested in guessing bottoms in the middle of a breakdown. I want to see where price stabilizes, and for me the most important read is the reaction at 300. If buyers can defend that zone and rebuild structure, it can set up the next tradable leg. If 300 fails, the market is telling us it needs a deeper reset before it can get “cooking” again.

[SHORT] ZECUSDT - Continuation Trend?Hello traders!
Will ZEC continue to offer opportunities in a downtrend?
If price revisits the Golden Zone and forms a Bearish Engulfing, it could be a valid setup.
Make sure the candle closes within the Golden Zone before entering a SHORT position.
Targets are already set — and be sure to manage your Stop Loss properly.
Happy hunting! 🎯📉

Zcash ZEC price analysisCRYPTOCAP:ZEC holders, it’s time to be extra careful.
Over the past few months, #Zcash showed solid strength.
Over the last weeks — the price was clearly being “held” around key levels.
But now OKX:ZECUSDT is entering a truly critical zone.
⚠️ Key levels to watch:
$300–310 — a crucial support area. Holding above it keeps the medium-term structure alive.
A daily close below $300 may open the door to $190–200 — and that’s still a relatively optimistic downside scenario.
From a pure technical perspective, the global trendline sits much lower, around $100–110, and by TA rules it may eventually be tested.
CRYPTOCAP:ZEC is currently at a crossroads:
either buyers defend the structure,
or the market transitions into a deeper redistribution phase.
👉 What’s your take: will $300 hold, or is CRYPTOCAP:ZEC heading for a much deeper correction?
______________
◆ Follow us ❤️ for daily crypto insights & updates!
🚀 Don’t miss out on important market moves
🧠 DYOR | This is not financial advice, just thinking out loud

ZEC: The Textbook Breakdown Everyone's IgnoringWe just witnessed a structural breakdown with conviction, CHoCH Bearish confirmed, 10.71% drop in 24 hours, and 264% above-average volume. This isn't retail panic. This is institutional money exiting positions. Price sits at $429.45 in equilibrium, and the structure is screaming continuation lower.
1. THE TECHNICAL REALITY 📉
• Ascending support trendline (27 touches) broken with authority
• Descending resistance at $506.70 (40 touches) remains the ceiling
• Converging wedge resolved bearish, technical target projects to ~$395
• Market structure has officially flipped from bullish to bearish
2. THE INDICATORS ⚖️
Bearish Signals:
• MACD deeply bearish at -18.6, no crossover in sight
• MFI at 27.3 confirms money flowing OUT
• Volume spike 264% above average validates the breakdown
• ADX at 19.9 suggests we're early in trend acceleration
Bullish Signals:
• RSI at 28.8 shows oversold conditions
• Stochastic at 33.3 hasn't hit peak capitulation yet
The Conflict:
Oversold doesn't mean reversal, it means momentum. High volume on breakdown with bearish divergence expanding tells us supply overwhelms demand. Room to run lower before true capitulation.
3. THE TRADE SETUP 🎯
🔴 Scenario A: Continuation Lower (Primary Path - 75% confidence)
• Trigger: Bounce into $445-$460 range (better risk-adjusted entry than chasing oversold)
• Entry: $445-$460 on relief rally into resistance
• Target 1: $404.34 (bullish OB demand zone)
• Target 2: $380.85 (24h low, extended target)
• Stop: Above $529.90 (bearish OB, 4H close above this breaks the down structure)
• R:R: ~2.5:1 on conservative target
🟢 Scenario B: Structural Reversal
• Trigger: 4H candle close above $529.90 (bearish OB)
• Entry: Reclaim of premium zone above $509.42
• Target: Retest descending resistance at $506.70+
• Invalidation: Failure to hold above $509.42 after reclaim
MY VERDICT
The setup favors shorts on bounces, not longs on dips. Structure broken bearish, volume confirms it, path of least resistance is down to $404. If you're holding longs from higher, the market just told you the story changed.

$ZEC 1D update: The trend has been bucked, monitoring... ZEC has now dumped back down decisively, and attention shifts straight back to the $300 level.
The recent breakdown from the rising channel confirms that the prior uptrend leg has been interrupted. What initially looked like consolidation has resolved lower, with expanding volatility and an impulsive move down, which usually signals unfinished business to the downside rather than an immediate reversal.
The $300–310 zone is once again the key level that matters. This area previously acted as a major demand base and launch point for the last expansion. A controlled move into that region with slowing momentum would still fit a broader bullish digestion narrative. However, a fast loss of $300 on a daily closing basis would materially weaken the structure and open the door to deeper retracement.
From a market behavior standpoint, this type of flush is not unusual for ZEC. It tends to overshoot, shake out late positioning, and only then form a more durable base. For now, I’m treating this as a volatility phase rather than assuming the larger trend has already resumed.
Bias here is cautious and reactive. I’m watching how price behaves as it approaches $300, not trying to front-run a bounce. The reaction at that level will determine whether this is just another reset before continuation, or something that requires more time to rebuild structure.

$ZEC/USDT ANALYSISOn the 12-hour ZEC/USDT chart, price is overall weak and under selling pressure even though it is sitting on an important support area. After a strong drop from the upper supply zone, ZEC tried to recover inside an upward channel, but that move looks corrective rather than strong because buyers could not push price back to the previous highs. The latest big bearish candle shows sellers stepping in aggressively and breaking the short-term upward structure, pushing price back down to the rising long-term trendline and demand zone. This area is acting as support for now, but the reaction is not strong, which means buyers are defending carefully, not confidently. As long as price remains below the supply zone and fails to make higher highs, the market remains bearish in structure, with the current support acting more like a pause in the fall rather than a clear reversal.

ZEC Analysis (4H)The bullish and upward structure of ZEC appears to be completed, and from the point where we placed the red arrow on the chart, its bearish phase seems to have begun.
It now looks like we are in wave B of the bearish phase, and it is expected to drop from the red zone toward the targets marked on the chart.
The targets are clearly indicated on the chart.
A daily candle closing above the invalidation level will invalidate this analysis.
For risk management, please don't forget stop loss and capital management
When we reach the first target, save some profit and then change the stop to entry
Comment if you have any questions
Thank You

ZEC 1D Update: Bucking the uptrend again ZEC is bucking the uptrend again in the short term, and the price action is starting to look more volatile rather than clean continuation. After riding the rising channel higher, price has rolled over near the upper portion of the structure and is now slipping back toward the mid-range instead of holding the highs.
This kind of behavior usually signals that the market isn’t ready to trend yet. Momentum has cooled, upside follow-through stalled, and price is breaking short-term support, which opens the door for more back-and-forth and potentially another push lower before any sustained move higher develops.
Importantly, this doesn’t break the broader bullish structure. As long as the larger support levels hold, this still looks like digestion after a strong advance rather than a full trend failure. ZEC has a history of being messy before it really starts moving, and this volatility fits that pattern.
My base case here is more chop and possibly lower prices in the near term, shaking out late longs and resetting momentum. If that happens while higher timeframe support remains intact, it likely sets the stage for a stronger move once it finally gets cooking. For now, patience matters more than prediction.
Zcash: Mapping the Multi-Layer Retest | Path to Trendline RetestZcash will enter a critical decision phase if price falls and holds under $491, which suggests a potential shift in momentum that places us in a consolidation range. We would then be operating within a consolidation box potentially. My focus is on the multi-layered support structure below us.
Near-Term Bullish Structure: We must hold the $473–$479 area. A bounce and break back above the 490s here keeps the immediate momentum intact.
The Fake-out Risk: Watch $468 closely. "Prior highs become support" logic suggests a bounce point, Could be a potential fake-out zone to catch late shorts chasing a trendline breakdown—don't get trapped.
The Mid-Layer: Below the potential fake-out zone, we have a secondary structural layer encompassing the prior and secondary highs.
The Macro Target: The actual trendline retest—and the highest-probability entry—sits in the $432–$435 confluence zone. This is the 3rd layer where the full breakout logic is truly tested.
⚠️ Risk Management & Invalidation
While the outlook remains constructive above the trendline, we must respect the downside risk:
The Red Flag: If price falls and closes under $425, the bullish retest thesis is under significant pressure.
Structural Breakdown: A break under the $390–$405 zone would suggest that the probability of a further breakdown has increased significantly.
The "C-Wave" Scenario: Losing the $390 level could trigger a major C-Wave correction, potentially leading to a deep retracement as low as the mid-$200s.

ZEC looks short.BINANCE:ZECUSDT.P
It looks short. I would short the areas of the first liquidity accumulation on the hourly chart. I have indicated all ranges on the chart. Set a stop above the December highs.
Use your risk management (RM).

ZEC/USDT – Head & Shoulders Pullback within Rising ChannelHi!
Pattern: Head & Shoulders (short-term correction)
Trend: Overall bullish (ascending channel intact)
➡️ After forming a Head & Shoulders near the top of the channel, price saw a healthy pullback
➡️ Price is now approaching the lower boundary of the rising channel, which acts as strong dynamic support
➡️ As long as this support holds, the broader uptrend remains valid
🎯 Bullish Targets:
TP1: 520
TP2: 550
A deeper correction is possible, but buyers are expected to step in near channel support

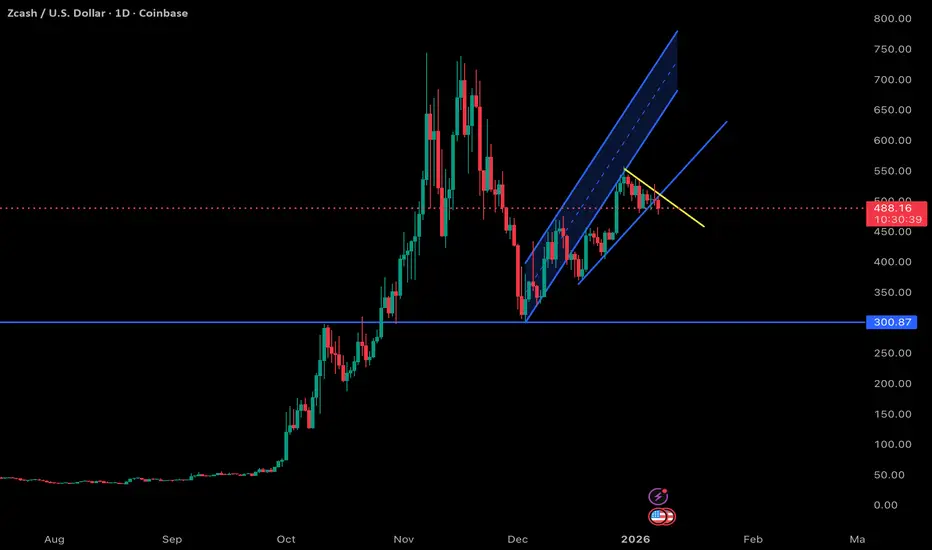
ZEC / USD – Daily – Structural Update (Bullish going into 2026)ZEC remains in a higher timeframe uptrend despite the recent pullback. The move lower from the recent highs is corrective in nature and fits within a rising channel structure that developed after the strong bounce from the $300 region. No daily lower low has formed, keeping the broader bullish structure intact.
The $300–310 zone remains the most important level on the chart. This area marks the macro breakout base and prior demand. As long as daily closes hold above this level, the bullish thesis remains valid and the trend favors continuation into 2026 rather than a full reversal.
Price is currently consolidating between roughly $450 and $550. This zone is acting as a compression area following the last impulse leg. Dips into the $420–450 region have been bought and continue to form higher lows, suggesting accumulation rather than distribution.
A sustained reclaim and hold above the $520–550 range would signal trend continuation and open the door for a move toward $600, followed by $680 and potentially the upper channel region near $750–800 over time.
Volume behavior supports this view, with expansion on upside moves and contraction on pullbacks. Momentum has cooled but remains constructive, resetting conditions for another expansion leg rather than signaling exhaustion.
The primary risk to this view is a daily close below $300, which would break the macro structure and invalidate the bullish continuation scenario. Until that occurs, this remains a buy-the-dip environment, favoring patience and entries on controlled pullbacks rather than chasing strength.
Overall bias remains bullish, with ZEC consolidating above its breakout base and positioning for potential continuation into 2026.
