ZEC Expected to Cool DownAnalysts predict a possible sharp retrace after ZCash's 1,500% surge.
Let's imagine how the price might evolve if it were to retest the historical trend line, Fib .382, confident that ZEC is poised for a 5 digits price in the medium term.
ZECUSD

Privacy is Pricy Again — How Zcash Got Back in the GameA significant shift is recently observed in the cryptocurrency space, indicating a resurgence of interest in privacy. The sharp rise of Zcash (ZEC) — over 46% in the week following Galaxy Research's analysis — is a clear example of this trend, reflecting the market's demand for untraceable funds.
Zcash, after years on the sidelines, has returned to the forefront, confirming that the fundamental cypherpunk ideals of privacy hold high value in the modern financial system.
1. Technological Breakthroughs and Zcash’s Fundamental Growth
The Zcash rally is driven not only by speculation but also by major improvements that have made privacy both more accessible and more effective:
Removing Barriers (Zashi & NEAR Intents): The use of zk-SNARKs (zero-knowledge proofs) has become more user-friendly. Enhanced user experience (UX) in new wallets (like Zashi) and integration with cross-chain mechanisms like NEAR Intents have removed the technical friction associated with "shielding" transactions.
Strengthening Anonymity: The most crucial network metric for Zcash is the increase of shielded coins in the Orchard pool to over 30% of the total supply. The more coins are "hidden," the larger the anonymity set becomes, which mathematically increases the difficulty of tracing transactions.
Technological Edge: Zcash, unlike some competitors, offers quantum-resistant cryptography and a stronger privacy mechanism via zk-SNARKs, which allows transaction validation without revealing the amount, sender, or receiver.
2. Zcash as a Counter-Trend to Transparency
The sharp price increase of ZEC after years of stagnation reflects a broader market narrative:
Reaction to Institutionalization: Against the backdrop of Bitcoin's growing transparency and institutionalization (ETFs, centralized custodians), Zcash is positioning itself as “encrypted Bitcoin”—an asset that refocuses attention on the decentralized and private nature of crypto assets.
Regulatory Balance: Zcash utilizes optional privacy, which, according to analysts, may provide the project with greater regulatory resilience compared to coins where privacy is mandatory by default.
Repricing Privacy: The market has demonstrated that the demand for confidentiality has not disappeared. The Zcash rally has forced investors to re-evaluate all privacy-focused projects, proving that, amid increasing online surveillance, the ability to transact privately has once again become a highly valuable feature.
Summary: Zcash is back in the game, bolstered by strong technological improvements that have made its privacy accessible and effective. The sustained nature of this growth will depend on whether the project can convert this speculative momentum into stable growth in user and network activity.

TC and ICP · The Quiet Storm Before the BreakoutMarkets are buzzing again after Trump mentioned a possible “tariff dividend” – a $2,000 payout per person funded by tariffs. It reminds many of 2020’s stimulus wave that pushed Bitcoin from $4K to $69K. If liquidity returns, older assets like Litecoin COINBASE:LTCUSD and Internet Computer BINANCE:ICPUSDT could be the next to move.
LTC: The Silent Giant
Litecoin is showing one of the cleanest technical setups in the market. The monthly chart forms a massive symmetrical triangle that’s been tightening since 2018. LTC just reclaimed the $108–$110 zone, sitting right below resistance. A monthly close above it could confirm a breakout toward $175 or more.
Historically, LTC rallies begin in November – right before broader altcoin seasons. The pattern from 2017 and 2020 looks set to repeat. If it does, the next rally could align perfectly with the 2025 halving cycle.
LTC Trading Plan:
- Breakout: $135
- Resistance: $160–$170
- Cut Loss: $70
- Targets: $240 / $400 / $600 / $1000
ICP: Rising Scarcity, New Narrative
Coinbase reserves of ICP have hit record lows. Only ~284,000 tokens remain on the exchange, while Binance’s reserves grow. This shift hints at growing demand.
Coinbase’s CEO recently talked about taking the exchange onchain, and ICP’s tech is one of the few ready for that move. With 44% of its supply locked, ICP’s real market cap is smaller than it looks, making it ripe for repricing.
ICP Trading Plan:
- Entry: $6.0–$7.0
- Stop: $5.0
- Targets: $11 / $12.5 / $14 / $20
Both LTC and ICP show strong asymmetry. One stands on historical cycles, the other on real scarcity and narrative growth. The setup looks familiar – quiet now, but maybe not for long.
TheCryptoFire

ZEC/USDT Major trend. 2 halving 17 11 2024. 17/160,18Major trend. Large time frame for clarity. Old exchange Poloniex (low liquidity) due to long trading history to show everything clearly. As you can see with each cycle the highs are decreasing....
Cycles of life and death . This cryptocurrency is going into its third cycle. It will most likely be the last because of its anonymity. In a decentralized super centralized world, nothing can be anonymous! Am I wrong? States don't need anything anonymous. The demands of market regulation will “strangle” anything anonymous. But, this is later, and before the halving, which will happen on 17 11 2024 with a high probability they will pump up to 160.18$, and maybe even higher, if the card falls.
Saving "dirty money" when CBDC is introduced by banks . Some people think that when CBDC of central banks is introduced, through anonymous coins like ZEC, HMR and so on, big capital will "save" their shadow money. A fairy tale for school children. I have little faith in it. I think such money has been saved long ago. Although this story to create a news background as a reason to pump has a place ....
It's worth noting that BCH and BTC will first halve in April 2024.
News from Satoshi . By the way, "rumor has it" that closer to the summer of 2024, according to the plot of our crypto movie called good/bad, a new “Satoshi Nakamoto”. Will be announced, who will plunge everyone into “uncertainty of actions/consequences” in the market. Rumors also claim it will be the universally hated villain, Craig Wright). Do you think the role will go to another villain, Roger Ver? Or have these two characters already played out and the role will go to someone else? Or maybe the plot itself will be canceled? Perhaps. Time will tell, the manipulators can come up with anything, that's not the point.
Immunity from news nonsense. The main thing is to treat such "crypto stories", even if there is a real imitation of provability, with the utmost equanimity. Remember, no matter what is going on, it is all a hoax to capitalize on the direction of the trend. The news background that is created to accompany price movement.
Line chart.
Secondary trend. Timeframe 3 days

Watch ZEC Supports Level Next Stops? | ZECUSDT | BTCUSDT | ZCash📊 Market Update | Zcash Key Support Levels Ahead
The price action is currently hovering near the $515 zone, which coincides with the 0.618 retracement — acting as immediate minor support.
If this level fails to hold, we could see a short-term continuation toward deeper Fibonacci zones.
🔹 Support Structure:
$515 (.618 Fib) → Minor support. Losing this could trigger a quick selloff.
$482 (.706 Fib) → First strong support area; expect buyers to test momentum here.
$454 (.786 Fib) → Secondary support; deeper correction zone if sentiment weakens further.
$385 → Major support and potential reversal zone. If price reaches this area, it could mark a long-term accumulation opportunity.
🔸 Market Outlook:
Momentum remains cautious with sellers showing dominance near resistance zones. However, watch for volume spikes or bullish divergence on lower timeframes around the $482–$454 range, as that’s where potential short-term reversal setups could emerge.
As long as $515 holds, structure remains healthy for a possible bounce. A clean breakdown below it, however, would confirm weakness and open doors toward the next supports.
🧭 Strategy:
Traders may consider scaling in gradually between $482–$454 with tight risk management, or wait for a confirmed retest above $515 for a safer re-entry.

ZEN (Horizen) Could Behave Well In The Weeks AheadIts funny how human psychology may repeat Beauty is that charts can visually show you patterns, no matter the timeframe. Its amazing how human psychology may repeat itself. Beauty here is that charts can visually show you human psychology in patterns, no matter the timeframe you're comparing them to.
It has many similar tokenomics as Zcash (ZEC)
DISCLAMER:
Non of this should be take as a financial advise. Be well.

ZEC proves that old-school crypto still got the fire!The price of CRYPTOCAP:ZEC finally broke out from a long consolidation (unlike poor #DASH 😅).
💰 Market cap already exceeded $6B, even slightly surpassing CRYPTOCAP:XMR (Monero).
🪙 True old-school vibes:
Total supply is limited to 21M coins — just like CRYPTOCAP:BTC . No trillions, no inflationary nonsense 😎
📊 On the #ZECUSDT chart, we see an almost correction-free rally — brief pauses between levels and then another leg up.
In fact, CRYPTOCAP:ZEC just broke above its 2021 high, and we don’t really see any major profit-taking yet.
🧩 P.S. The technical levels work beautifully — use them wisely 😉
⚖️ But the real question is:
is this genuine demand for anonymity, or is someone carefully pumping CRYPTOCAP:ZEC after years of mining accumulation?
______________
◆ Follow us ❤️ for daily crypto insights & updates!
🚀 Don’t miss out on important market moves
🧠 DYOR | This is not financial advice, just thinking out loud.

ZCash ZEC Strong Accumulation about to play outZCASH has seen a long accumulation phase during which especially Koreans (ZECKRW PAIR) has seen alot of Volume the past few Weeks/Months.
As soon as this BTC pullback os over and the fear in the market clears. ZEC will be ready to move strongly.
I marked the first few months of ZEC/USD or even ZECBTC in a black box. The Valuation can be ignored. It was only cause due to it's low initial supply.
Like If you appreaciate.
Feel free to tip so i can start doing this on a regular basis.
BTC 0.09% -0.90% / Bitcoin: 1GLr5xkEQonUBquXjLQWoxhT5BSxdTpkur

Z CASH Would you risk one to gain 5?IT seems like a good area to pick up a "asset"
at a previous All time low.
Buying weakness vs strength historically a bad move.
yet..
#MONERO got delisted from #Binance ysterday
Whilst #ZEC has passed their compliance review --- coincidence???
Laughable stuff !!!
But what can we do.
Make some "money" on ZEC
whilst using XMR
if you are that way inclined.
Target 1 seems reasonable this year
Target 2 in 2025 sure why not
and anything beyond from these levels
and still are holding well done to you.

Zec can se more gain 40% gain toward370$Hi
the support and resistances on the chart are based on the previous data and weekly candlesticks if BINANCE:ZECUSDT holds this last support the potential of 40% gain is logical toward 370$

ZKUSDT - Don't waste this opportunity!Did you know that ZK dropped more than 98.5% from its peak in December 2024 until October 10, 2025?
If you can’t imagine what that means, let me explain:
Coins that experience such a massive drop usually get delisted and die off—they rarely recover.
But ZK surged over 1,300% from its October 10 bottom in less than 23 days and is now about to break a major resistance at the 0.618 Fibonacci level.
And I want to point out something:
ZEC and ZK sound similar, and even their letters resemble each other—definitely a hint at the market makers’ codes.
Best Regards:
Ceciliones🎯

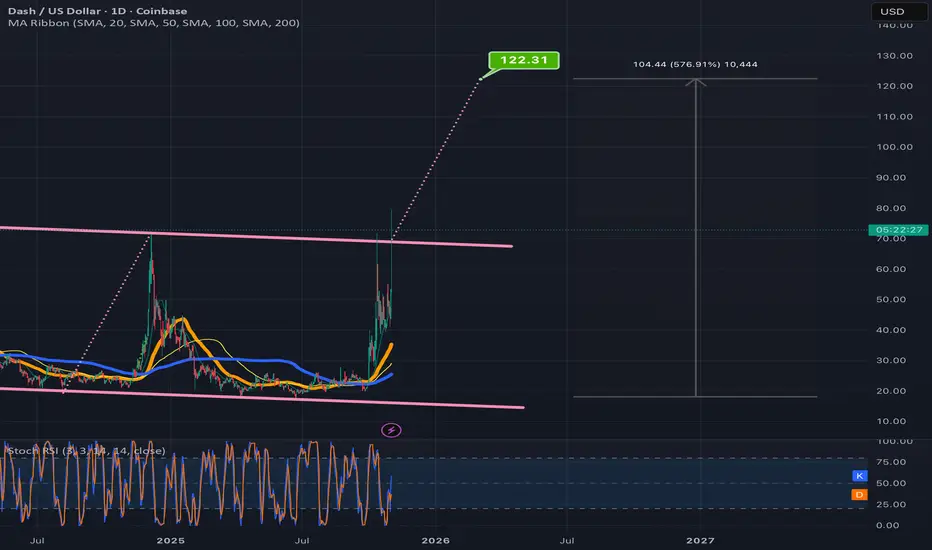
Dash trying to catch back up with ZCash hereUntil recently, Zcash and Dash tended to pump and dump in tandem with eachother, ever since ZCash’s recent big breakout though Dash has noticeably lagged behind. It was hard to say whether it was just delayed reaction on dash’s part or if a true decoupling between the two ahd occurred but it seemed like a least a safe gamble(not financiala dvice) to put a little chunk of money on dash in the interim in case it would do something similar to what Zec has been doing in the enar future. So that’s what I did and now dash is pumping and has gotten above the top trendline of this pink channel. If it validates the breakout at this breach point the measured move target is around $122. From the bottom around $18 thats over a 500% gain. Could always just keep going after that like Zcash has done also but that remains to be seen. First things first is just to validate the breakout of the channel which has not yet happened but a decent probability that it will. *not financial advice*
$ZEC/USDT successfully retested the $308 zone at the 50 EMA. $ZEC/USDT successfully retested the $308 zone at the 50 EMA and bounced strongly upward. The breakout above $400 confirms a clear bullish continuation pattern. With the retest already completed, momentum now favors further upside. As long as the price holds above $400, ZEC remains in a strong uptrend. The next target zone is between $500 and $600.
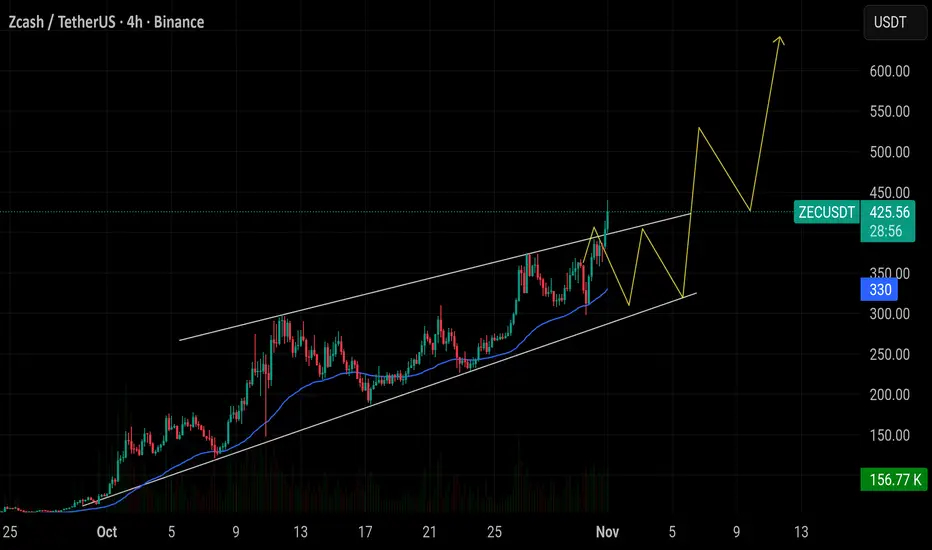
Bull flagPerfect setup. It's knocking on heaven's door. Will likely reject and dance within its parameters. But when it punches through, next stop is $420.69.

Can LITECOIN copy ZEC's enormous rally?Zcash (ZECUSD) marginally broke its May 10 2021 Cycle Top (orange trend-line) this week, rising by more than +800% in just 2 months.
Throughout its trading history, it has been tightly correlated with Litecoin (LTCUSD). It's not uncommon to see ZEC lead the way and then LTC (purple) follow. As this chart shows, whenever the two diverged, the one always caught up with the other and converged again.
Does this mean that LTC will eventually catch up to this enormous rally? If it does indeed, the Top of the previous Cycle that it 'has to' fill is at $415.
-------------------------------------------------------------------------------
** Please LIKE 👍, FOLLOW ✅, SHARE 🙌 and COMMENT ✍ if you enjoy this idea! Also share your ideas and charts in the comments section below! This is best way to keep it relevant, support us, keep the content here free and allow the idea to reach as many people as possible. **
-------------------------------------------------------------------------------
💸💸💸💸💸💸
👇 👇 👇 👇 👇 👇

ZECUSDTMy idea is bullish for BINANCE:ZECUSDT .
But keep 220$ support.
Next target is 290 - 370
Support: 220 - 1755 - 125 - 78
⚠️Please control risk management.

Zcash (ZEC/USDT): Bullish Reversal Confirmed from QML ZoneHi!
Zcash is currently showing a potential bullish structure following the completion of a QML (Quasimodo Level) pattern around the $220–$230 demand zone.
After the previous high was engulfed, the price retraced deeply into the QML zone, forming a higher low and respecting the ascending structure highlighted by the trendline. This indicates that buyers are gradually regaining control.
The recent bullish impulse from the QML zone aligns with the ascending channel, suggesting that as long as the price remains above the lower boundary, the short-term bias stays bullish.
If the momentum continues, the next key resistance levels to watch are:
$280–$300 → mid-channel resistance and previous supply area
$340–$360 → upper boundary of the channel and extended target
On the other hand, a break below $230 (QML invalidation) would signal weakness and could trigger a deeper correction toward the $190–$200 demand zone.

ZECUSDT - another leg up ahead!Keep your eyes on it — just like I told you before. Its target was $250–$280, and it actually hit $298 exactly. It then entered a temporary corrective phase, forming a falling wedge pattern.
This coin is an ideal pick for the current phase, and don’t worry — its bullish run isn’t over yet.
Next target: $360. I’ll keep posting updates about it regularly.
Best regards:
Ceciliones🎯

ZEC Head & Shoulders Breakdown – Dead Cat Bounce Setup?ZEC has broken down after completing a fairly large head-and-shoulders pattern, which typically signals bearish momentum. The neckline break triggered a sharp sell-off, putting pressure on support zones. Price action suggests that a rebound may be in play soon as the market searches for a local bottom.
👀 Key Zone to Watch: The $215–$210 range is the ideal bounce zone, where buyers may step in for a classic dead cat bounce. This area has confluence with prior structure and should attract tactical entries. A strong reaction here could open the door for a smart pump.
🎯 Trade Plan:
Entry Zone: $215–$210
Take Profits: $235 / $250 / $270
Stop Loss: Close below $207

Check if 224.47-260.42 can be supported
Hello, fellow traders!
If you "Follow" us, you'll always get the latest information quickly.
Have a great day.
-------------------------------------
(ZECUSDT 1M chart)
You might be wondering why it's rising, but you don't need to know why.
Because it's already rising.
It's a sharp rise, breaking above the important support and resistance area of 56.29-78.91.
The key is whether the price can hold above the Fibonacci 1.618 (338.52) level.
If not, we need to check for support near 220.20, the previous DOM (60) indicator level.
Since the chart was broken by a surge, I believe the next support period is crucial.
-
(1W chart)
The next volatility period is expected to be November 3-23, around the week of November 10.
-
(1D chart)
As mentioned earlier, since the chart was broken by a surge, I think we can calculate the next volatility period based on the next support period.
Until then, we need to see how the price moves after this volatility period, which runs around October 21 (October 20-22).
Looking at the current 1D chart, the HA-High ~ DOM(60) range is forming between 224.47 and 260.42. Therefore, we need to see if it can find support within this range and rise.
If it falls below 220.20, it could fall to around 115.72, so we should consider a response plan.
-
Thank you for reading to the end.
I wish you successful trading.
--------------------------------------------------

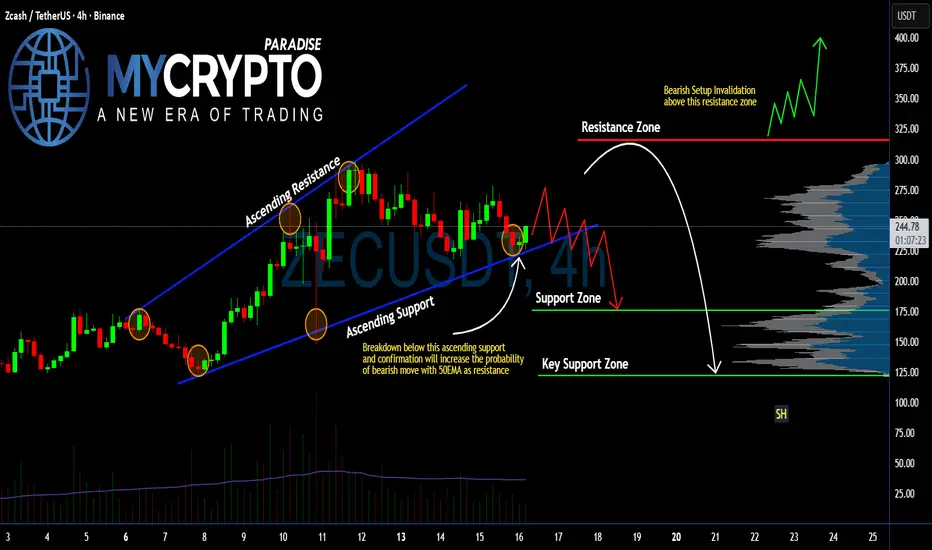
#ZEC Ready to Collapse? Breakdown Here Could Trigger Panic Sell Yello Paradisers! Are you really paying attention to what’s brewing on #ZECUSDT? Because if not, you might be blindsided by what could be a brutal move down. Let's get into the #ZEC setup:
💎#Zcash has been trading inside an Ascending channel, but the momentum is clearly fading. The last bounce off the ascending support was weak, and now we are testing that same ascending support again, but this time, with growing selling pressure.
💎Current price of #ZEC is around $242, and the situation is getting critical. A confirmed breakdown below this ascending support will flip the structure bearish and open up a clean setup toward significantly lower levels. The 50 EMA, which is now acting as dynamic support, will act as resistance. It will only accelerate the downside if this breaks.
💎If this breakdown plays out and is followed by a failed retest of the broken trendline, we could easily see price dump into the Support Zone around $175, and possibly even fall into the Key Support Zone near $121, where stronger buyers may finally step in.
💎On the flip side, the bearish setup is invalidated only if #ZECUSD breaks back above the Resistance Zone at $316. That would shift momentum in favor of the bulls and could spark a sharp rally.
Trade smart, Paradisers. This setup will reward only the disciplined.
MyCryptoParadise
iFeel the success🌴
ZEC breakout of multi years resistance !ZEC / USDT
We noticed a Strong move this week
Price broke multi-years resistance line (2024/2022/2020) which is a huge breakout for this coin !
Simple thing , Holding above line = bullish
Invalidation: candle close below it

ZECUSDT – Bullish Flag Pattern: Consolidation Before Breakout?Overview
After a powerful rally that pushed ZEC from around $100 to nearly $300, the market has entered a healthy consolidation phase — forming a clean Bullish Flag Pattern on the 4H timeframe.
This pattern often represents a pause within a strong uptrend, where smart money accumulates positions quietly before the next major breakout.
As long as price remains within this downward-sloping channel (yellow zone), the structure still reflects controlled consolidation inside a broader bullish context.
---
Pattern Identification
Primary Pattern: Bullish Flag
Characteristics: A downward-sloping parallel channel following a sharp upward impulse
Technical Implication: Typically signals a continuation pattern, suggesting that the uptrend is not yet over
Confirmation: A 4H candle close above the upper boundary of the flag, supported by rising volume
---
Key Technical Levels
Upper Flag Resistance: $289 – $298
→ A breakout and 4H close above this zone confirms bullish continuation
Mid-Zone Support: $271
→ Serves as a balance level within the consolidation range
Lower Flag Support: $261
→ Acts as invalidation for the flag; a breakdown below could trigger short-term correction
---
Bullish Scenario
If ZEC breaks out above the flag and closes firmly above $298, the next leg of the rally could begin.
Confirmation: 4H close > $298 with strong bullish volume
Target 1: $320 – $340
Target 2 (Measured Move): $480 – $490, based on the length of the previous flagpole
Invalidation: 4H close back below $261
💡 Bullish Flags often lead to explosive continuation moves — once confirmed, momentum can accelerate rapidly.
---
Bearish Scenario
If price fails to hold support and breaks down below $261, it could shift into a short-term correction phase.
Confirmation: 4H close < $261
Target 1: $220 (previous demand area)
Target 2: $190
Invalidation: Close back above $289 cancels the bearish bias
---
Conclusion
ZEC is currently in a calm but critical stage — consolidating after a major impulse, with a textbook Bullish Flag forming at the top of the move.
A confirmed breakout above $289 – $298 would strongly suggest that the next bullish leg is about to unfold.
Patience and confirmation are key: true breakouts are often preceded by quiet compression like this one.
---
#ZEC #ZECUSDT #BullishFlag #CryptoAnalysis #TechnicalAnalysis #ZECBreakout #PriceAction #CryptoTrading #MarketStructure #SwingTrade #ChartPattern
